2013 West Sussex County Council election

Last updated

2013 West Sussex County Council election
Flag of West Sussex.svg
  2009 2 May 2013 2017  

All 71 seats to West Sussex County Council
36 seats needed for a majority
 First partySecond party
 
Party Conservative UKIP
Seats won4610
Seat changeDecrease2.svg3Increase2.svg8

 Third partyFourth party
 
Party Liberal Democrats Labour
Seats won86
Seat changeDecrease2.svg10Increase2.svg3

West Sussex County Council election results 2013.svg
Map showing the results of the 2013 West Sussex County Council elections.

Council control before election

Conservative

Council control after election

Conservative

The West Sussex County Council election, 2013 took place on 2 May 2013, as part of the 2013 United Kingdom local elections. All 71 electoral divisions were up for election, which returned one county councillor each by first-past-the-post voting for a four-year term of office. [1] At this election, the Conservative Party was seeking to retain overall control of the council, and the Liberal Democrats to maintain their position as the main opposition party.

Contents

All locally registered electors (British, Irish, Commonwealth and European Union citizens) who were aged 18 or over on Thursday 2 May 2013 were entitled to vote in the local elections. Those who were temporarily away from their ordinary address (for example, away working, on holiday, in student accommodation or in hospital) were also entitled to vote in the local elections, [2] although those who had moved abroad and registered as overseas electors cannot vote in the local elections. It is possible to register to vote at more than one address (such as a university student who had a term-time address and lives at home during holidays) at the discretion of the local Electoral Register Office, but it remains an offence to vote more than once in the same local government election. [3]

Summary

The Conservative Party, who have controlled control of the council since 1997, retained control with a majority of 10 seats, a loss of three seats compared to the 2009 result. [4] The Conservative Party also retained Imberdown which had been gained due to a defection from the Liberal Democrats. [5]

The United Kingdom Independence Party (UKIP) won 10 seats to become the official opposition on the council, a net gain of 8 seats. In the intervening period since the last election UKIP gained two seats by defection from the Conservatives, Kingston Buci and Worthing West, UKIP failed to retain either seat. [6] [7] The Liberal Democrats lost 11 seats and gained 1 seat, leaving them with a total of 8 seats. Labour gained 4 seats from the Conservatives, but lost Haywards Heath Town to the Conservative, which Labour had gained by defection from the Liberal Democrats. [5] [8] Labour won a total of 6 seats, all in the Borough of Crawley.

Of the parties that did not gain any representation on the council. only the Green Party contested more than one electoral division. The Green Party lost its only county councillor, who had defected from the Liberal Democrats. [5] [9]

An independent gained Midhurst division from the Conservatives. [10] The Conservative candidate for the Division of Midhurst was forced to resign from the Conservative Party, but did so after the close of nomination and date to withdraw nominations, meaning their name remained on the ballot paper. This was due to comments made regarding the potential admissions policy of a proposed new boarding school in West Sussex. [11]

Election Results Summary

West Sussex County Council election, 2013
PartySeatsGainsLossesNet gain/lossSeats %Votes %Votes+/−
  Conservative 461316-364.838.471,618-10.00%
  UKIP 10102+814.129.354,751+20.75%
  Liberal Democrats 8111-1011.314.426,882-14.86%
  Labour 641+38.513.926,036+ 5.42%
  Independent 110+11.41.32,377+0.67%
  Green 001-10.02.54,758+0.29%
  Peace 00000.00.05102-0.02%
  BNP 00000.00.0357-1.98%
  Socialist Labour 00000.00.0242N/A
  Justice 00000.00.0240-0.03%
 Patria00000.00.0126N/A

Results by electoral division

West Sussex is composed of 7 districts: Adur District, Arun District, Chichester District, Crawley Borough, Horsham District, Mid Sussex District and Worthing Borough. The following results are grouped by district.

Adur

Kingston Buci
PartyCandidateVotes%±%
Conservative Peter Metcalf82335.9-9.9
UKIP Paul Graysmark74732.6+11.4
Labour Sami Zeglam44319.3+2.0
Green Helen Mears1737.6+7.6
Liberal Democrats Cyril Cannings1155.0-10.7
Majority762.7-21.9
Turnout 2,29129.7-5.4
Conservative gain from UKIP Swing
Lancing
PartyCandidateVotes%±%
UKIP Mike Glennon1,32353.8+25.0
Conservative Angie Mills50520.5-13.9
Labour Douglas Bradley27211.1+2.7
Liberal Democrats Stephen Martin2439.9-19.5
Green Louise Carroll1174.8+4.8
Majority81833.3
Turnout 2,46029.8-1.8
UKIP gain from Conservative Swing
Saltings
PartyCandidateVotes%±%
UKIP Mick Clark76934.7+8.9
Conservative Dave Simmons69731.5-6.6
Labour David Devoy32814.8+5.9
Green Jennie Tindall26612.0-0.1
Liberal Democrats Doris Martin1557.0-8.1
Majority723.2
Turnout 2,21526.3-10.9
UKIP gain from Conservative Swing +7.7%
Shoreham
PartyCandidateVotes%±%
Conservative Debbie Kennard1,03746.3-2.8
UKIP Clive Burghard50722.6+9.2
Labour Irene Reed32114.3+5.6
Green Lynn Finnigan23210.4-5.9
Liberal Democrats John Hilditch1426.3-6.2
Majority53023.7-9.1
Turnout 2,23929.5-3.3
Conservative hold Swing
Sompting & North Lancing
PartyCandidateVotes%±%
UKIP Lionel Parsons1,14445.5+20.9
Conservative Carson Albury77330.7-14.6
Labour Alun Jones36814.6+2.4
Green Simon Williams1244.9+4.9
Liberal Democrats Patricia Izod1074.3-13.7
Majority37114.8
Turnout 2,51628.9-6.4
UKIP gain from Conservative Swing +17.8%
Southwick
PartyCandidateVotes%±%
Conservative Janet Mockridge73836.2-6.4
UKIP Jenny Greig61130.0+6.8
Labour Brian Hall42620.9+9.8
Liberal Democrats David Edey1607.8-6.2
Green Moyra Martin1055.1-4.5
Majority1276.2-13.2
Turnout 2,04025.6-7.5
Conservative hold Swing -6.6%

Arun

Angmering & Findon
PartyCandidateVotes%±%
Conservative Deborah Urquhart1,10044.0-22.6
UKIP Tricia Wales94137.6N/A
Liberal Democrats Jamie Bennett2329.2-24.2
Labour James Elwood2289.1+9.1
Majority1596.4-26.8
Turnout 2,50131.2-8.5
Conservative hold Swing
Arundel & Wick
PartyCandidateVotes%±%
Conservative Nigel Peters96742.1-14.1
UKIP Jeannie Dunning78334.1N/A
Labour Alan Butcher38716.9+7.6
Liberal Democrats Nick Wiltshire1617.0-27.4
Majority1848.0-13.8
Turnout 2,29827.7-10.5
Conservative hold Swing
Bersted
PartyCandidateVotes%±%
UKIP Ann Rapnik1,04441.0+23.9
Liberal Democrats Simon McDougall52620.7-12.5
Labour Roger Nash51220.1+9.2
Conservative Paul Dendle46218.2-11.0
Majority51820.4
Turnout 2,54428.2-5.9
UKIP gain from Liberal Democrats Swing
Bognor Regis East
PartyCandidateVotes%±%
Liberal Democrats Francis Oppler76335.2-10.7
UKIP Derek Ambler73333.8+15.2
Labour Jan Cosgrove35116.2+16.2
Conservative David Edwards32214.8-10.7
Majority301.4-19.0
Turnout 2,16924.4-5.5
Liberal Democrats hold Swing
Bognor Regis West & Aldwick
PartyCandidateVotes%±%
Conservative Ashvin Patel1,15936.4-6.4
UKIP Janet Taylor96830.4N/A
Liberal Democrats Paul Wells87327.4-16.9
Labour Richard Dawson1865.8-0.1
Majority1916.0
Turnout 3,18635.9-4.2
Conservative gain from Liberal Democrats Swing
East Preston & Ferring
PartyCandidateVotes%±%
Conservative Peter Evans1,80449.3-16.7
UKIP Phil Ruddock1,14231.2N/A
Labour Ed Miller52714.4+5.7
Liberal Democrats Trevor Richards1875.1-9.4
Majority66218.1-33.4
Turnout 3,66036.6-9.3
Conservative hold Swing
Felpham
PartyCandidateVotes%±%
UKIP Graham Jones98935.1+11.2
Conservative George Blampied92632.8-21.7
Independent Sandra Daniells66023.4N/A
Labour Steve McConnell1545.5-0.7
Liberal Democrats David Meagher903.2-12.2
Majority632.3
Turnout 2,81935.2-4.1
UKIP gain from Conservative Swing +16.5%
Fontwell
PartyCandidateVotes%±%
Conservative Derek Whittington1,17644.3-20.0
UKIP Graham Draper90734.2N/A
Liberal Democrats Stephen White33812.7-23.0
Labour John Mayes1776.7N/A
BNP John Robinson572.1N/A
Majority26910.1-18.5
Turnout 2,65529.6-10.3
Conservative hold Swing
Littlehampton East
PartyCandidateVotes%±%
Liberal Democrats James Walsh1,10639.1-6.0
UKIP Geoff Holloway77227.3+11.0
Conservative Emma Neno73726.1-3.7
Labour Christine Macdonald2147.6+2.3
Majority43411.8-1.7
Turnout 2,82932.1-5.9
Liberal Democrats hold Swing
Littlehampton Town
PartyCandidateVotes%±%
Liberal Democrats Ian Buckland65830.6+4.5
UKIP Bill Watkins57626.8+6.8
Labour George O'Neill46321.5±0.0
Conservative David Britton34816.1-12.6
Independent David Jones1064.9+4.9
Majority823.8
Turnout 2,15127.7-3.7
Liberal Democrats gain from Conservative Swing
Middleton
PartyCandidateVotes%±%
UKIP Joan Phillips1,18144.2+16.7
Conservative Hilary Flynn1,09941.2-7.7
Labour Gilbert Cockburn26810.0+3.6
Liberal Democrats Conrad Meagher1217.2-8.9
Majority823.0
Turnout 2,66931.5-7.7
UKIP gain from Conservative Swing +12.2%
Nyetimber
PartyCandidateVotes%±%
UKIP Tony Sutcliffe1,50348.9+24.3
Conservative Mike Coleman1,05834.4-13.3
Labour Pauline Nash30910.1+4.5
Liberal Democrats Gregory Burt2036.6-7.9
Majority44514.5
Turnout 3,07333.0-8.2
UKIP gain from Conservative Swing +18.8%
Rustington
PartyCandidateVotes%±%
Conservative Graham Tyler1,56045.9-23.3
UKIP Janet Penn1,20335.4N/A
Labour Tony Dines34010.0+2.7
Liberal Democrats Val Capon2958.7-14.5
Majority35710.5-35.9
Turnout 3,39835.3-9.8
Conservative hold Swing

Chichester

Bourne
PartyCandidateVotes%±%
UKIP Sandra James1,24140.6N/A
Conservative Mark Dunn1,15837.9-18.4
Liberal Democrats Jonathan Brown36011.8-28.2
Labour Theo Child2959.7+6.0
Majority832.7+2.7
Turnout 3,05431.8-5.3
UKIP gain from Conservative Swing
Chichester East
PartyCandidateVotes%±%
Conservative Simon Oakley89435.0-0.6
Liberal Democrats Andrew Smith66326.0-26.3
UKIP Alicia Denny64825.4N/A
Labour Ben Earnshaw-Mansell34913.7+7.7
Majority2319.0+9.0
Turnout 2,55424.4-10.1
Conservative gain from Liberal Democrats Swing +12.9%
Chichester North
PartyCandidateVotes%±%
Conservative Jeremy Hunt1,43149.8-2.6
UKIP Michael Mason67523.5+11.4
Liberal Democrats John Illenden46416.2-14.6
Labour Michael Waite30310.5+5.9
Majority75626.3+4.7
Turnout 2,87331.9-12.1
Conservative hold Swing
Chichester South
PartyCandidateVotes%±%
Conservative Margaret Whitehead1,02440.1-2.8
UKIP Nigel Sitwell 67226.3+8.7
Liberal Democrats Michael Woolley50819.9-12.4
Labour James Hobson34813.6+6.3
Majority35213.8+3.2
Turnout 2,55227.6-9.1
Conservative hold Swing -5.8%
Chichester West
PartyCandidateVotes%±%
Conservative Louise Goldsmith1,69154.6-0.4
UKIP Douglas Denny71623.1+13.6
Liberal Democrats Jon Stevens33910.9-6.5
Labour John Bennett32610.5+5.5
PatriaAndrew Emerson260.8N/A
Majority97531.5-6.1
Turnout 3,09832.2-10.8
Conservative hold Swing -7.0%
Fernhurst
PartyCandidateVotes%±%
Conservative Michael Brown1,35051.0-3.9
UKIP Andrew Moncreiff70026.4+8.7
Liberal Democrats David Martin-Jenkins33912.8-9.9
Labour John Smith2599.8+5.1
Majority65024.5-7.7
Turnout 2,64830.0-12.9
Conservative hold Swing -6.3%
Midhurst
PartyCandidateVotes%±%
Independent Gordon McAra86431.4N/A
Conservative John Cherry74226.9-51.3
UKIP Pamela Hayton54919.9-1.9
Independent Margaret Guest29210.6N/A
Liberal Democrats Bob Green1977.2N/A
Labour Frances Turner1104.0N/A
Majority1224.5N/A
Turnout 2,75431.1+5.6
Independent gain from Conservative Swing
Petworth
PartyCandidateVotes%±%
Conservative Janet Duncton1,70354.8-15.5
UKIP Julian Batchelor80926.0N/A
Liberal Democrats Karon Read39412.7-7.9
Labour Philip Robinson2016.5+2.7
Majority89428.8-20.9
Turnout 3,10731.7-9.6
Conservative hold Swing
Selsey
PartyCandidateVotes%±%
UKIP Bernard Smith1,20145.8+5.8
Conservative Roland O'Brien1,09141.6-5.5
Labour Ian Bell33212.7-0.1
Majority1104.2
Turnout 2,62429.9-6.7
UKIP gain from Conservative Swing +5.7%
The Witterings
PartyCandidateVotes%±%
Conservative Pieter Montyn1,26551.5+1.9
UKIP Roger Wilson82933.7N/A
Labour Joe O'Sullivan2148.7+3.3
Liberal Democrats Gillian Gardner1506.1-4.5
Majority43617.8-13.0
Turnout 2,45829.8-10.3
Conservative hold Swing

Crawley

Bewbush & Ifield West
PartyCandidateVotes%±%
Labour Chris Oxlade92748.6+12.6
UKIP Norman Aston49225.8N/A
Conservative Duncan Peck37819.8-11.7
Liberal Democrats Lucy-Marie Nelson703.7-10.6
Justice Arshad Khan402.1-2.9
Majority43522.8+18.3
Turnout 1,90722.5-6.0
Labour hold Swing
Broadfield
PartyCandidateVotes%±%
Labour Brian Quinn1,08450.5+8.7
Conservative Lee Gilroy49423.0-35.2
UKIP Mia Bristow47622.2N/A
Liberal Democrats Keith Sunderland512.4N/A
Socialist Labour Derek Isaacs422.0N/A
Majority59027.5
Turnout 2,14723.3-3.6
Labour gain from Conservative Swing +22.0%
Gossops Green & Ifield East
PartyCandidateVotes%±%
Labour Sue Mullins1,10941.0+13.1
Conservative Ken Trussell72026.6-12.0
UKIP Stephen Wade70526.1N/A
Green Iain Dickson1063.9N/A
Liberal Democrats Gregory-George Collins622.3-8.2
Majority38914.4
Turnout 2,70232.3-5.8
Labour gain from Conservative Swing +12.6%
Langley Green & West Green
PartyCandidateVotes%±%
Labour Brenda Smith1,55858.4+12.9
UKIP Peter Brent53320.0N/A
Conservative Vanessa Cumper49918.7-18.5
Liberal Democrats Kevin Osborne772.9-14.4
Majority1,02538.4+30.1
Turnout 2,66727.9-5.4
Labour hold Swing
Maidenbower
PartyCandidateVotes%±%
Conservative Bob Lanzer1,16550.3-22.0
Labour Peter Smith50621.8+7.8
UKIP Simon Mizzi46219.9N/A
Green Ben Liles1044.5+4.5
Liberal Democrats Bill Morrison793.4-10.3
Majority65928.5-6.3
Turnout 2,31624.9-9.9
Conservative hold Swing -14.9%
Northgate & Three Bridges
PartyCandidateVotes%±%
Labour Peter Keir Lamb 1,06540.2+9.6
Conservative Bob Burgess89433.8-6.4
UKIP Andrew Gill56221.2N/A
Liberal Democrats David Anderson1274.8-12.5
Majority1716.4N/A
Turnout 2,64831.9-4.9
Labour gain from Conservative Swing +8.0%
Pound Hill & Worth
PartyCandidateVotes%±%
Conservative Richard Burrett1,49354.0-15.7
UKIP John MacCanna54520.6N/A
Labour David Shreeves41315.6+4.7
Green Susi Liles1134.3N/A
Liberal Democrats Graham Knight833.1-16.2
Majority94833.4-17.0
Turnout 2,64730.3-8.8
Conservative hold Swing
Southgate & Crawley Central
PartyCandidateVotes%±%
Labour Michael Jones77436.8-2.6
Conservative Howard Bloom65531.2-17.0
UKIP David Matthews48222.9N/A
Green Malcolm Liles1336.3N/A
Liberal Democrats Anthony Millson572.7N/A
Majority1195.6
Turnout 2,10127.1-7.6
Labour gain from Conservative Swing +7.2%
Tilgate & Furnace Green
PartyCandidateVotes%±%
Conservative Duncan Crow1,46144.3-1.7
Labour Colin Moffatt1,05431.9+6.9
UKIP Graham Harper54416.5N/A
Green Derek Hardman1243.8N/A
Liberal Democrats John Lovell621.9N/A
Independent Richard Symonds561.7N/A
Majority40712.4-8.6
Turnout 3,30137.3-2.4
Conservative hold Swing -4.3%

Horsham

Billingshurst
PartyCandidateVotes%±%
Conservative Amanda Jupp1,01342.8-11.3
UKIP David Duke91938.8+16.7
Liberal Democrats Gillian Knight2289.6-9.1
Labour Keith Maslin2068.7+3.6
Majority9944.0-28.0
Turnout 2,36627.6-10.8
Conservative hold Swing -14.0%
Bramber Castle
PartyCandidateVotes%±%
Conservative David Barling1,32242.3+6.1
Liberal Democrats Jessica Sproxton-Miller84827.1-21.7
UKIP Mike Grizzard67021.4+13.8
Labour Adrian Norridge2889.2+6.7
Majority47415.2
Turnout 3,12834.2-16.6
Conservative gain from Liberal Democrats Swing +13.9%
Henfield
PartyCandidateVotes%±%
Conservative Lionel Barnard1,24851.4-12.1
UKIP Liz Wallace72329.8N/A
Liberal Democrats Andrew Purches25510.5-13.2
Labour Janet Miller2048.4+2.9
Majority52521.6-18.2
Turnout 2,43028.9-13.4
Conservative hold Swing
Holbrook
PartyCandidateVotes%±%
Conservative Peter Catchpole1,23746.2-0.9
UKIP Sally Wilkins67825.3N/A
Liberal Democrats Leonard Crosbie48718.2-25.1
Labour Sheila Chapman27310.2+6.7
Majority55920.9+17.1
Turnout 2,67530.4-12.6
Conservative hold Swing
Horsham Hurst
PartyCandidateVotes%±%
Liberal Democrats Nigel Dennis1,22544.4-6.4
Conservative Keith Bridgeman67924.6-1.7
UKIP Claire Bridewell53719.4+10.5
Labour Carol Hayton32111.6+6.1
Majority54619.8-4.7
Turnout 2,76234.2-7.9
Liberal Democrats hold Swing -4.7%
Horsham Riverside
PartyCandidateVotes%±%
Liberal Democrats Morwen Millson1,05339.0-16.7
Conservative David Scozzafava68325.3-10.7
UKIP Douglas Rands62023.0N/A
Labour David Hide2398.9+5.1
Peace Jim Duggan1023.8-0.7
Majority37013.7-6.0
Turnout 2,69732.8-11.8
Liberal Democrats hold Swing -3.0%
Horsham Tanbridge & Broadbridge Heath
PartyCandidateVotes%±%
Liberal Democrats David Sheldon72135.7-20.4
Conservative Ronald Vimpany55127.3-11.3
UKIP Martin Bridewell53726.6N/A
Labour Raymond Chapman21210.5+5.2
Majority1708.4-9.1
Turnout 2,02129.2-10.0
Liberal Democrats hold Swing
Pulborough
PartyCandidateVotes%±%
Conservative Pat Arculus1,38043.7-29.5
UKIP John Wallace1,15936.7N/A
Independent Tom Williams2869.1N/A
Liberal Democrats Rosalyn Deedman1755.5-15.6
Labour Antony Bignell1595.0-0.7
Majority2217.0-45.1
Turnout 3,15932.7-9.8
Conservative hold Swing
Roffey
PartyCandidateVotes%±%
Conservative Jim Rae75332.4-6.0
UKIP Mike Rowlands72831.4N/A
Liberal Democrats Warwick Hellawell59725.7-22.7
Labour George Murrell24410.5+6.4
Majority251.0
Turnout 2,32230.0-9.8
Conservative gain from Liberal Democrats Swing
Southwater & Nuthurst
PartyCandidateVotes%±%
Conservative Brad Watson1,26341.4-8.2
UKIP Stuart Aldridge1,09435.8+22.5
Liberal Democrats Peter Stainton49216.1-11.4
Labour Jacqueline Little2036.7+3.8
Majority1695.6-16.5
Turnout 3,05230.4-6.1
Conservative hold Swing -15.4%
Storrington
PartyCandidateVotes%±%
Conservative Frank Wilkinson1,58047.9-16.1
UKIP Graham Croft-Smith1,25238.0N/A
Liberal Democrats Nick Hopkinson46414.1-4.3
Majority3289.9-35.7
Turnout 3,29633.1-10.0
Conservative hold Swing
Warnham & Rusper
PartyCandidateVotes%±%
Conservative Mick Hodgson1,22855.0-3.9
UKIP Geoff Stevens67330.2+10.9
Liberal Democrats Ian Shepherd33114.8-2.9
Majority55524.8-14.8
Turnout 2,23230.2-11.5
Conservative hold Swing -7.4%

Mid Sussex

Burgess Hill East
PartyCandidateVotes%±%
Conservative Anne Jones1,12733.9-11.6
UKIP Kevin Walker84725.5N/A
Liberal Democrats Sue Knight60118.1-31.9
Labour Tony Balsdon56417.0+12.5
Green Anne Eves1855.6+5.6
Majority2808.4
Turnout 3,32435.0-6.5
Conservative gain from Liberal Democrats Swing
Burgess Hill Town
PartyCandidateVotes%±%
Conservative Andrew Barrett-Miles1,01636.6-3.5
UKIP Chris French70925.5+11.6
Liberal Democrats Roger Cartwright57620.7-20.8
Labour Janet Smith38413.8+9.4
Green Victoria Grimmett913.3+3.3
Majority30711.1
Turnout 2,77630.6-7.5
Conservative gain from Liberal Democrats Swing
Cuckfield & Lucastes
PartyCandidateVotes%±%
Conservative Pete Bradbury1,28248.6+1.8
UKIP Marc Montgomery58522.2+16.2
Liberal Democrats Stephen Blanch47017.8-3.4
Labour Sarah Moss30011.4+8.8
Majority69726.4+0.8
Turnout 2,63733.0-12.4
Conservative hold Swing -7.2%
East Grinstead Meridian
PartyCandidateVotes%±%
Conservative Liz Bennett1,00648.0+0.5
UKIP Ian Simcock50724.2N/A
Liberal Democrats Jackie Beckford30714.7-24.2
Labour Andrew Skudder1637.8+4.3
Green Catherine Edminson1115.3-4.8
Majority49923.8+15.2
Turnout 2,09424.9-10.7
Conservative hold Swing
East Grinstead South & Ashurst Wood
PartyCandidateVotes%±%
Conservative John O'Brien1,06643.8-0.7
UKIP Tony Armstrong56223.1N/A
Liberal Democrats Howard Evans46118.9-22.0
Green Gary Hogman1887.7-4.2
Labour David Boot1586.5-3.9
Majority50420.7+17.1
Turnout 2,43527.5-13.7
Conservative hold Swing
Hassocks & Victoria
PartyCandidateVotes%±%
Conservative Andy Petch1,46441.4-2.8
UKIP Raplh Wylam67819.1N/A
Liberal Democrats Kristian Berggreen63517.8-32.6
Labour Linda Taylor38310.8+6.0
Green Victoria Standfast2858.0N/A
Independent Scott McCarthy1133.2N/A
Majority78622.3
Turnout 3,55835.1-8.8
Conservative gain from Liberal Democrats Swing
Haywards Heath East
PartyCandidateVotes%±%
Conservative John De Mierre78933.8-5.9
UKIP Charles Burrell61726.4N/A
Labour Richard Goddard50521.6+8.1
Liberal Democrats Anne Hall42418.2-23.0
Majority1726.4N/A
Turnout 2,33529.7-9.4
Conservative gain from Liberal Democrats Swing
Haywards Heath Town
PartyCandidateVotes%±%
Conservative Sujan Wickremaratchi95135.9-6.3
UKIP Howard Burrell61423.2N/A
Liberal Democrats Richard Bates58922.2-23.8
Labour Greg Mountain49518.7+13.5
Majority33712.7
Turnout 2,64932.6-7.9
Conservative gain from Liberal Democrats Swing
Hurstpierpoint & Bolney
PartyCandidateVotes%±%
Conservative Peter Griffiths1,27549.1-9.3
UKIP Ian Holt48718.8N/A
Liberal Democrats Rodney Jackson34113.1-7.7
Green Mike Airey28511.0-4.1
Labour David Chalkley2098.0+2.3
Majority78830.3-7.3
Turnout 2,59732.9-11.7
Conservative hold Swing
Imberdown
PartyCandidateVotes%±%
Conservative Heidi Brunsdon1,06543.2+3.5
UKIP Kevin Lindsay79932.4+20.5
Liberal Democrats Bob Mainstone59924.3-19.8
Majority26610.8
Turnout 2,46329.9-12.7
Conservative hold Swing
Lindfield & High Weald
PartyCandidateVotes%±%
Conservative Christine Field1,63349.2-8.6
UKIP Lesley Montgomery66219.9N/A
Green Paul Brown50015.1-1.3
Liberal Democrats Anne-Marie Lucraft2818.5-13.6
Labour Michael Amor2457.4+3.8
Majority97129.3-6.5
Turnout 3,32135.1-11.9
Conservative hold Swing
Worth Forest
PartyCandidateVotes%±%
Conservative Bill Acraman1,20044.1-17.1
UKIP Vivienne Etherton81530.0N/A
Labour Alan Rew33812.4+6.0
Green Gillian Maher1987.3-7.5
Liberal Democrats Nicholas Dennis1686.2-11.4
Majority38514.1-29.5
Turnout 2,71929.1-8.4
Conservative hold Swing

Worthing

Broadwater
PartyCandidateVotes%±%
Conservative Bryan Turner73431.2-7.1
UKIP Colin Avis64627.5+9.9
Liberal Democrats Alan Rice60125.6-13.2
Labour John Turley36915.7+10.2
Majority883.7
Turnout 2,35023.7-9.3
Conservative gain from Liberal Democrats Swing
Cissbury
PartyCandidateVotes%±%
Conservative John Rogers1,15441.9-10.9
UKIP Robin Harper1,07239.0+14.6
Liberal Democrats Victoria Taylor2137.7-9.9
Labour Ann Saunders1706.2+1.0
Green Al Emery1435.2N/A
Majority822.9-25.5
Turnout 2,75232.0-10.6
Conservative hold Swing - 12.8%
Durrington & Salvington
PartyCandidateVotes%±%
UKIP Trixie Hall94638.4+15.2
Conservative Nicola Waight90636.8-2.7
Liberal Democrats Michael Donin35114.3-23.0
Labour Jillian Guest25810.5N/A
Majority401.6
Turnout 2,46125.3-9.1
UKIP gain from Conservative Swing
Goring
PartyCandidateVotes%±%
Conservative Steve Waight1,07942.0-12.0
UKIP Richard Bater89835.0+14.8
Labour Janet Haden2258.8+1.0
Liberal Democrats Neil Campbell1897.4-10.6
Green David Aherne1766.9N/A
Majority1817.0-26.8
Turnout 2,56731.3-8.1
Conservative hold Swing -13.4%
Northbrook
PartyCandidateVotes%±%
Liberal Democrats Robin Rogers69531.5-26.4
Conservative Daniel Humphreys69031.3-5.7
UKIP Mike Jelliss53024.1N/A
Labour Philip Dufty2119.6+4.5
Green Melanie Muir773.5N/A
Majority50.2-20.7
Turnout 2,20326.3-5.3
Liberal Democrats hold Swing
Tarring
PartyCandidateVotes%±%
Liberal Democrats Robert Smytherman85133.1-13.3
UKIP Shaune King70227.3+9.2
Conservative Sean McDonald59323.0-6.0
Labour Michael Brown2288.9+3.4
Green William Morris1997.7N/A
Majority1495.8-12.6
Turnout 2,57326.0-9.3
Liberal Democrats hold Swing
Worthing East
PartyCandidateVotes%±%
Conservative Roger Oakley67530.3-5.5
UKIP Grant Lloyd56725.5+10.5
Liberal Democrats Christine Brown54024.3-16.6
Labour Mike Barrett44319.9+11.7
Majority1084.8N/A
Turnout 2,22526.0-9.2
Conservative gain from Liberal Democrats Swing
Worthing Pier
PartyCandidateVotes%±%
Conservative Michael Cloake66029.1-8.0
Green James Doyle51422.6N/A
UKIP Christopher Woodward47520.9+8.1
Liberal Democrats Hazel Thorpe34015.0-25.1
Labour Peter Barnes28212.4+5.8
Majority1466.5
Turnout 2,27124.5-7.5
Conservative gain from Green Swing
Worthing West
PartyCandidateVotes%±%
Conservative Paul High91738.7-10.2
UKIP Rick Setford75932.1+12.4
Labour Alexandra Wagstaff26611.2+3.3
Liberal Democrats Yvonne Leonard2179.2-14.2
Green Daniel Aherne2098.8N/A
Majority1586.6-18.9
Turnout 2,36826.6-9.7
Conservative gain from UKIP Swing -11.3%

Related Research Articles

Lewes District Council in East Sussex, England is elected every four years. Since the last boundary changes in 2019, 41 councillors are elected from 21 wards.

<span class="mw-page-title-main">Politics of Cornwall</span> South West England county

Cornwall is administered as a county of South West England whose politics are influenced by a number of issues that make it distinct from the general political scene in the wider United Kingdom, and the political trends of neighbouring counties. Its position on the geographical periphery of the island of Great Britain is also a factor.

<span class="mw-page-title-main">Wiltshire Council</span> Unitary authority in South West England

Wiltshire Council, known between 1889 and 2009 as Wiltshire County Council, is a unitary authority which governs the district of Wiltshire, which covers the majority of the ceremonial county of the same name in South West England. The council has been controlled by the Conservative Party since 2000, and has its headquarters at County Hall in Trowbridge.

<span class="mw-page-title-main">2013 East Sussex County Council election</span>

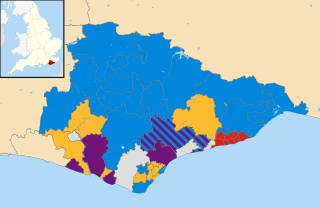
The East Sussex County Council election, 2013 took place on 2 May 2013 as part of the 2013 United Kingdom local elections. All 49 councillors of East Sussex County Council were elected from 44 electoral divisions, which return either one or two councillors each by first-past-the-post voting for a four-year term of office. The electoral divisions were the same as those used at the previous election in 2009. No elections were held in Brighton and Hove, which is a unitary authority outside the area covered by the County Council.

<span class="mw-page-title-main">2013 Cambridgeshire County Council election</span>

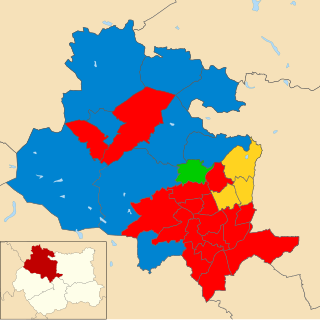
An election to Cambridgeshire County Council took place on 2 May 2013 as part of the 2013 United Kingdom local elections. 69 councillors were elected from 60 electoral divisions, which returned either one or two county councillors each by first-past-the-post voting for a four-year term of office. The electoral divisions were the same as those used at the previous election in 2009. No elections were held in Peterborough, which is a unitary authority outside the area covered by the County Council. The election saw the Conservative Party lose overall control of the council.
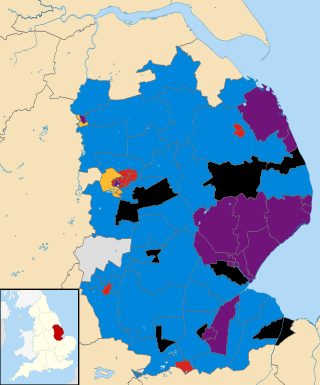
<span class="mw-page-title-main">2013 Gloucestershire County Council election</span>

Elections to Gloucestershire County Council took place on 2 May 2013 as part of the 2013 United Kingdom local elections. 53 electoral divisions elected one county councillor each by first-past-the-post voting for a four-year term of office. No elections were held in South Gloucestershire, which is a unitary authority outside the area covered by the County Council.

<span class="mw-page-title-main">2013 Essex County Council election</span>

An election to Essex County Council took place on 2 May 2013 as part of the 2013 United Kingdom local elections. 75 councillors were elected from 70 electoral divisions, which returned either one or two county councillors each by first-past-the-post voting for a four-year term of office. The electoral divisions were the same as those used at the previous election in 2009. No elections were held in Thurrock or Southend-on-Sea, which are unitary authorities outside the area covered by the County Council.

<span class="mw-page-title-main">2013 Cornwall Council election</span>

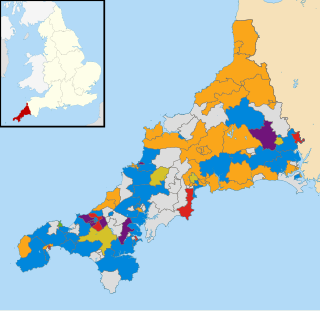
The Cornwall Council election, 2013, was an election for all 123 seats on the council. Cornwall Council is a unitary authority that covers the majority of the ceremonial county of Cornwall, with the exception of the Isles of Scilly which have an independent local authority. The elections took place concurrently with other local elections across England and Wales.

<span class="mw-page-title-main">2013 Suffolk County Council election</span>

Elections to Suffolk County Council took place on 2 May 2013 as part of the 2013 United Kingdom local elections. 75 councillors were elected from 63 electoral divisions, which returned either one or two county councillors each by first-past-the-post voting for a four-year term of office. The electoral divisions were the same as those used at the previous election in 2009.

<span class="mw-page-title-main">2013 Northamptonshire County Council election</span>

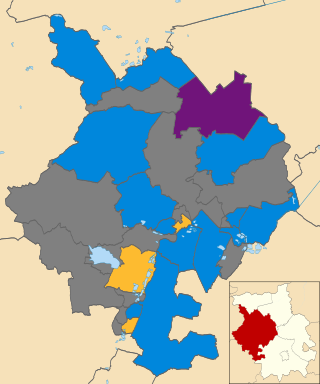
An election to Northamptonshire County Council took place on 2 May 2013 as part of the 2013 United Kingdom local elections. Following a boundary review, the number of county councillors was reduced from 73 to 57 from this election. All members were elected by first-past-the-post voting from single-member electoral divisions for a four-year term of office. The Conservative Party held on to their overall majority, having held overall control of the council since 2005.

<span class="mw-page-title-main">2010 Huntingdonshire District Council election</span>

The 2010 Huntingdonshire District Council election took place on 6 May 2010 to elect members of Huntingdonshire District Council in Cambridgeshire, England. One third of the council was up for election and the Conservative Party stayed in overall control of the council.

<span class="mw-page-title-main">2015 City of Bradford Metropolitan District Council election</span>

The 2015 City of Bradford Metropolitan District Council election took place on 7 May 2015. This was on the same day as other local elections and a general election. One councillor was elected in each ward for a four-year term so the councillors elected in 2015 last stood for election in 2011. Each ward is represented by three councillors, the election of which is staggered, so only one third of the councillors were elected in this election. Labour retained overall control of the council.

<span class="mw-page-title-main">2011 Swale Borough Council election</span>

The 2011 Swale Borough Council election took place on 5 May 2011 to elect members of Swale Borough Council in Kent, England. The whole council was up for election and the Conservative Party stayed in overall control of the council.

<span class="mw-page-title-main">2017 United Kingdom local elections</span>

The 2017 United Kingdom local elections were held on Thursday 4 May 2017. Local elections were held across Great Britain, with elections to 35 English local authorities and all councils in Scotland and Wales.

<span class="mw-page-title-main">2017 Hampshire County Council election</span>

The 2017 Hampshire County Council election took place on 4 May 2017 as part of the 2017 local elections in the United Kingdom. All councillors were elected from electoral divisions by first-past-the-post voting for a four-year term of office. The electoral divisions were somewhat changed from the previous election, with some being split, merged or with boundary changes. No elections were held in Portsmouth and Southampton, which are unitary authorities and hold their elections in other years. Similarly the districts within Hampshire did also not hold elections this year.

<span class="mw-page-title-main">2017 Norfolk County Council election</span>

The 2017 Norfolk County Council election took place on 4 May 2017 as part of the 2017 local elections in the United Kingdom.

<span class="mw-page-title-main">2017 West Sussex County Council election</span>

The 2017 West Sussex County Council election took place as part of the 2017 local elections in the UK. All councillors were elected for single-member electoral divisions for a four-year term. The voting system used was first-past-the-post.

<span class="mw-page-title-main">2017 Welsh local elections</span>

The 2017 Welsh local elections were held on 4 May 2017 to elect members of all 22 local authorities in Wales. This included the Isle of Anglesey, which was previously up for election in 2013 due to having its elections delayed for a year. Community council elections also took place on the same day. These local elections were held as part of the 2017 local elections in the United Kingdom. Apart from Anglesey, the last elections were held in 2012. Normally these elections take place every four years, but the 2017 elections were postponed for a year in order to avoid clashing with the 2016 Welsh Assembly election, which itself had been postponed by a year to avoid clashing with the 2015 general election.

<span class="mw-page-title-main">2018 Plymouth City Council election</span> 2018 local election in Plymouth

The 2018 Plymouth City Council election took place on 3 May 2018 to elect members of Plymouth City Council in England. The election was won by the Labour Party, who gained enough seats to achieve an overall majority and took control of the council.

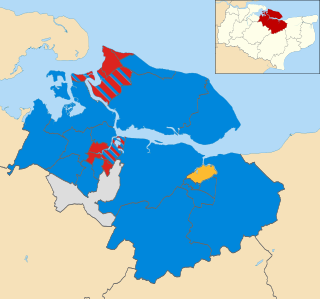
The 2019 North East Lincolnshire Council election took place on 2 May 2019 to elect members of North East Lincolnshire Council in England. This was on the same day as other local elections.

References

  1. "County Council Elections 2 May 2013". West Sussex County Council. 28 March 2013. Retrieved 28 March 2013.
  2. "The Representation of the People (Form of Canvass) (England and Wales) Regulations 2006, Schedule Part 1". Legislation.gov.uk. 13 October 2011. Retrieved 18 April 2012.
  3. "I have two homes. Can I register at both addresses?". The Electoral Commission. Archived from the original on 15 November 2008. Retrieved 5 January 2011.
  4. "(West Sussex section): Tories lose control of East Sussex County Council". BBC News. Retrieved 4 May 2013.
  5. 1 2 3 "West Sussex county councillor resigns". Worthing Herald. Retrieved 1 March 2014.
  6. "Dear Resident". electionleaflets.org. Retrieved 1 March 2014.
  7. "Conservative County councillor joins UKIP". West Sussex County Times. Retrieved 1 March 2014.
  8. "Councillor joins Labour party". Mid Sussex Times. Retrieved 1 March 2014.
  9. "Worthing councillor joins new political party". Worthing Herald. Retrieved 1 March 2014.
  10. "Racist row Tory loses Midhurst election". Midhurst and Petworth Observer. Retrieved 1 March 2014.
  11. "Tory councillor John Cherry resigns over 'openly racist language' after saying 'there are certain nationalities where they are uncertain what this hard work is all about'" . The Independent . Archived from the original on 1 May 2022. Retrieved 1 March 2014.