2013 Gloucestershire County Council election

Last updated

2013 Gloucestershire County Council election
Flag of England.svg
  2009 2 May 2013 2017  

All 53 seats to Gloucestershire County Council
27 seats needed for a majority
 First partySecond party
 
Party Conservative Liberal Democrats
Seats won2314
Seat changeDecrease2.svg13Increase2.svg4

 Third partyFourth party
 
Party Labour UKIP
Seats won93
Seat changeIncrease2.svg5Increase2.svg3

Gloucestershire UK local election 2013 map.svg
Map showing the results of the 2013 Gloucestershire County Council elections.

Council control before election

Conservative

Council control after election

No Overall Control

Elections to Gloucestershire County Council took place on 2 May 2013 as part of the 2013 United Kingdom local elections. [1] 53 electoral divisions elected one county councillor each by first-past-the-post voting for a four-year term of office. No elections were held in South Gloucestershire, which is a unitary authority outside the area covered by the County Council.

Contents

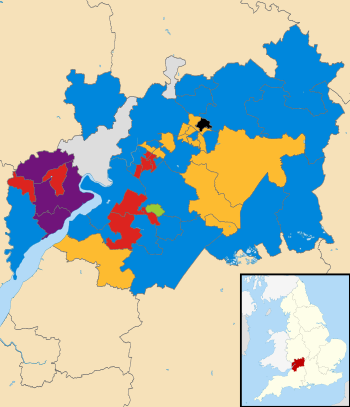
Control of the council went from the Conservative Party to no party having overall control. Turnout across the county was 32% with 151,250 votes cast. [2] The Conservatives gained most votes in four of the six parliamentary seats, the Liberal Democrats coming first in Cheltenham and UKIP in the Forest of Dean. The Conservatives were the only party to win a county council seat in every district. [n 1]

All locally registered electors (British, Irish, Commonwealth and European Union citizens) who were aged 18 or over on Thursday 2 May 2013 were entitled to vote in the local elections. Those who were temporarily away from their ordinary address (for example, away working, on holiday, in student accommodation or in hospital) were also entitled to vote in the local elections, [3] although those who had moved abroad and registered as overseas electors cannot vote in the local elections. It is possible to register to vote at more than one address (such as a university student who had a term-time address and lives at home during holidays) at the discretion of the local Electoral Register Office, but it remains an offence to vote more than once in the same local government election. [4]

County Council single-member electoral review 2012-13

Going into the elections, the Conservatives held a majority of 21 seats. Due to boundary changes and a reduction in the number of councillors from 63 to 53 [n 2] following a public consultation by the Local Government Boundary Commission for England [5] the notional results to be used for the purposes of election planning and comparison before the election were: Conservatives - 36, Liberal Democrats - 10, Labour - 4, People Against Bureaucracy - 1, Greens - 1, Independents - 1. This gave a notional Conservative majority of 17 seats.

Summary

The Conservative Party lost 13 notional seats, although the numerical loss was larger due to the reduction in the total number of councillors. The Liberal Democrats remained the second largest party by total seats and percentage vote, while the Labour Party had the largest net gain of five seats. UKIP won representation on the county council for the first time, winning three seats.

The number of Independent councillors rose to two, while both the Green Party and People Against Bureaucracy saw their only councillors re-elected.

Results

Gloucestershire County Council election, 2013 [6]
PartySeatsGainsLossesNet gain/lossSeats %Votes %Votes+/−
  Conservative 23114-1343.434.552,410-9.8%
  Liberal Democrats 1451+426.420.330,891-10.2%
  Labour 950+517.018.227,725+6.9%
  UKIP 330+35.715.223,046+13.4%
  Independent 210+13.83.55,387+0.5%
  Green 100±01.96.810,266-0.7%
  PAB 100±01.91.21,791-0.5%
  TUSC 000±000.3450+0.3%

Results by District

Within Cheltenham District
PartySeatsGainsLossesNet gain/lossSeats %Votes %Votes+/−
  Liberal Democrats 720+27038.0010,407
  Conservative 202-22028.477,797
  UKIP 000±0014.083,857
  PAB 100±0106.541,791
  Labour 000±006.491,777
  Green 000±005.781,583
  TUSC 000±000.57155n/a
  Independent 000±000.0719n/a
Within Cotswold District
PartySeatsGainsLossesNet gain/lossSeats %Votes %Votes+/−
  Conservative 503-362.541.909,954
  Liberal Democrats 330+337.526.386,268
  UKIP 000±0017.764,219n/a
  Labour 000±007.871,870
  Green 000±003.80902
  Independent 000±002.29545n/a
Within Forest of Dean District
PartySeatsGainsLossesNet gain/lossSeats %Votes %Votes+/−
  UKIP 330+337.528.346,247n/a
  Labour 210+12524.005,292
  Conservative 205-52523.855,257
  Independent 110+112.513.863,055
  Liberal Democrats 000±005.431,198
  Green 000±004.40970
  TUSC 000±000.1328n/a
Within Gloucester District
PartySeatsGainsLossesNet gain/lossSeats %Votes %Votes+/−
  Conservative 402-24034.189,142
  Labour 420+24023.855,257
  UKIP 000±0018.364,909
  Liberal Democrats 200±02017.574,699
  Green 000±003.15843
  TUSC 000±000.89237n/a
Within Stroud District
PartySeatsGainsLossesNet gain/lossSeats %Votes %Votes+/−
  Conservative 502-25034.7011,238
  Labour 320+23028.129,106
  Green 100±01017.555,683
  Liberal Democrats 100±0109.903,207
  UKIP 000±008.772,839
  Independent 000±000.87281
  TUSC 000±000.0930n/a
Within Tewkesbury District
PartySeatsGainsLossesNet gain/lossSeats %Votes %Votes+/−
  Conservative 510+171.445.929,022
  Liberal Democrats 101-114.326.025,112
  Labour 000±0014.072,764
  Independent 100±014.37.571,487
  UKIP 000±004.96975
  Green 000±001.46286

Results by Division

Cheltenham

All Saints and Oakley
PartyCandidateVotes%±%
Liberal Democrats Colin Hay 1,046 50
Conservative Steve Thomas51124
Labour Diana Hale30114
Green Adrian Becker24512
Majority53526
Liberal Democrats hold Swing
Battledown and Charlton Kings
PartyCandidateVotes%±%
Conservative Paul McLain 1,215 36
Liberal Democrats Michael Collins1,16935
UKIP Justin Dunne61518
Labour Kevin Boyle1845
Green Jon Stubbings1825
Majority461
Conservative hold Swing
Benhall and Up Hatherley
PartyCandidateVotes%±%
Liberal Democrats Simon Wheeler 1,427 41
Conservative Lewis Feilder93227
UKIP Jeff Hack82224
Labour Brian Hughes1564
Green Timothy Bonsor1384
Majority49514
Liberal Democrats hold Swing
Charlton Park and College
PartyCandidateVotes%±%
Liberal Democrats Klara Sudbury 1,533 47
Conservative Matt Babbage1,17436
UKIP Alan Stone35211
Labour Emma Clifford2076
Majority35911
Liberal Democrats gain from Conservative Swing
Hesters Way and Springbank
PartyCandidateVotes%±%
Liberal Democrats Suzanne Williams 1,007 53
Conservative Elizabeth Fox44423
Labour Clive Harriss29916
TUSC Joanna Hughes1558
Majority56330
Liberal Democrats hold Swing
Lansdown and Park
PartyCandidateVotes%±%
Conservative Tim Harman 1,280 46
Liberal Democrats Maximilian Wilkinson78628
UKIP Mark Daniel37313
Green Vanessa Angelo-Thompson1847
Labour Robert Irons1706
Independent Radek Walesa191
Majority49418
Conservative hold Swing
Leckhampton and Warden Hill
PartyCandidateVotes%±%
Liberal Democrats Iain Dobie 1,140 34
Conservative Rosemary Harvey1,11133
UKIP Christina Simmonds77923
Green Sarah Field37211
Majority291
Liberal Democrats gain from Conservative Swing
Pittville and Prestbury
PartyCandidateVotes%±%
PAB David Prince 1,791 59
Conservative Lucy Strachan49316
Liberal Democrats Robert Jones45615
UKIP Jean Bamford31510
Majority1,29843
PAB hold Swing
St Mark's and St Peter's
PartyCandidateVotes%±%
Liberal Democrats Christopher Coleman 1,015 44
UKIP Peter Bowman61427
Conservative Andrew Coffey31914
Labour Rod Gay23410
Green Demelza Jones1296
Majority40117
Liberal Democrats hold Swing
St Paul's and Swindon
PartyCandidateVotes%±%
Liberal Democrats Bernard Fisher 828 46
UKIP Ann Homer41723
Conservative Emily Croft31818
Labour Mark Hobbs22813
Majority41123
Liberal Democrats hold Swing

Cotswold

Bourton-on-the-Water and Northleach
PartyCandidateVotes%±%
Liberal Democrats Paul Hodgkinson 1,275 39
Conservative David Thorpe1,21637
UKIP Christopher Cooke59118
Labour Merilyn Hill1705
Majority592
Liberal Democrats gain from Conservative Swing
Campden-Vale
PartyCandidateVotes%±%
Conservative Lynden Stow 1,818 62
UKIP Michael Fitzgerald48116
Liberal Democrats Peter Sipthorp41914
Labour Glyn Ford2308
Majority1,33746
Conservative hold Swing
Cirencester Beeches
PartyCandidateVotes%±%
Liberal Democrats Nigel Robbins 1,156 39
Conservative John Burgess93031
UKIP Chris Harlow58820
Labour Terry Pomroy1656
Green Joy Irving1194
Majority2268
Liberal Democrats gain from Conservative Swing
Cirencester Park
PartyCandidateVotes%±%
Liberal Democrats Joe Harris 1,690 55
Conservative Tony Curry68822
UKIP Robert Stephens44214
Labour Reg Eyre1665
Green Bob Irving923
Majority1,00233
Liberal Democrats gain from Conservative Swing
Fairford and Lechlade on Thames
PartyCandidateVotes%±%
Conservative Raymond Theodoulou 1,372 48
UKIP Geoff Willis53219
Liberal Democrats Laura Watts48617
Labour Trevor Smith28410
Green Xanthe Messenger1746
Majority84029
Conservative hold Swing
South Cerney
PartyCandidateVotes%±%
Conservative Shaun Parsons 1,175 39
Liberal Democrats Mike Evemy84028
UKIP Guy Parfitt54618
Labour Jon Easterbrook2217
Green Nick Gibbs1555
Independent Sandy Steel1124
Majority33511
Conservative hold Swing
Stow-on-the-Wold
PartyCandidateVotes%±%
Conservative Nigel Moor 1,643 57
UKIP Rob Woodhouse51418
Labour Jude Walker33211
Green Andrew Maclean2198
Liberal Democrats Danny Loveridge1856
Majority1,13139
Conservative hold Swing
Tetbury
PartyCandidateVotes%±%
Conservative Anthony Hicks 1,112 41
UKIP Jenny Knight52519
Independent David Painter43316
Labour Chris Giles30211
Liberal Democrats Stephen Radford-Hancock2178
Green Brecon Quaddy1435
Majority58722
Conservative hold Swing

Forest of Dean

Blakeney and Bream
PartyCandidateVotes%±%
UKIP Richard Leppington 1,190 36
Labour Bill Evans1,09633
Conservative Diana Edwards85626
Liberal Democrats Zoe Forbes2086
Majority943
UKIP gain from Conservative Swing
Cinderford
PartyCandidateVotes%±%
Labour Graham Morgan 1,018 47
UKIP Ann Guyton60128
Conservative Neville Freeman27513
Liberal Democrats Heather Dalziel1607
Green Sid Phelps1025
TUSC Claude Mickleson281
Majority41739
Labour hold Swing
Coleford
PartyCandidateVotes%±%
Labour Paul McMahon 825 33
UKIP Alan Grant62325
Conservative Terry Hale61725
Independent Ian Whitburn31513
Liberal Democrats Heather Lusty1225
Majority2028
Labour gain from Conservative Swing
Drybrook and Lydbrook
PartyCandidateVotes%±%
UKIP Colin Guyton 824 29
Labour Bruce Hogan71325
Independent Andrew Gardiner66624
Conservative Brian Jones41615
Green Bob Rhodes1204
Liberal Democrats Melanie Hughes743
Majority1114
UKIP gain from Conservative Swing
Lydney
PartyCandidateVotes%±%
UKIP Alan Preest 1,075 42
Labour Di Martin49219
Conservative Terry Glastonbury46118
Independent David Cooksley34714
Green James Greenwood1887
Majority58323
UKIP gain from Conservative Swing
Mitcheldean
PartyCandidateVotes%±%
Independent Norman Stephens 1,152 36
Conservative Brian Robinson77224
UKIP Tim Congdon61219
Labour David Thomson32810
Liberal Democrats Sue Henchley1796
Green Ken Power1204
Majority38012
Independent gain from Conservative Swing
Newent
PartyCandidateVotes%±%
Conservative Will Windsor-Clive 988 37
UKIP John Sullivan59722
Independent Philip Burford57521
Labour Janet Royall33212
Green David Humphrey1295
Liberal Democrats David Fidgeon652
Majority39115
Conservative hold Swing
Sedbury
PartyCandidateVotes%±%
Conservative Patrick Molyneux 872 31
UKIP John McOwan72526
Labour Malcolm Sadler48818
Liberal Democrats David Wheeler39014
Green Chris McFarling31111
Majority1475
Conservative hold Swing

Gloucester

Abbey
PartyCandidateVotes%±%
Conservative Andrew Gravells 1,390 47
UKIP Danny Sparkes68723
Labour Emily Barrett53218
Liberal Democrats Mike Anderton28410
Green Charley Bircher813
Majority70324
Conservative hold Swing
Barnwood and Hucclecote
PartyCandidateVotes%±%
Liberal Democrats David Brown 1,530 41
Conservative Lise Noakes1,14331
UKIP Steve Pottage69319
Labour Shaun Shute35710
Majority38710
Liberal Democrats hold Swing
Barton and Tredworth
PartyCandidateVotes%±%
Labour Jasminder Gill 1,220 46
Conservative Sajid Patel1,09542
TUSC John Ewers1777
Liberal Democrats Tom Etheridge1466
Majority1254
Labour hold Swing
Coney Hill and Matson
PartyCandidateVotes%±%
Labour Stephen McHale 997 46
UKIP Gary Cleaver64330
Conservative Tarren Randle35316
Liberal Democrats Declan Wilson1175
TUSC Susan Powell603
Majority35416
Labour hold Swing
Grange and Kingsway
PartyCandidateVotes%±%
Labour Barry Kirby 790 36
Conservative Dave Norman69732
UKIP Rosemary Marchmont51824
Green Frances Griffiths914
Liberal Democrats Stephen Power804
Majority934
Labour gain from Conservative Swing
Hempsted and Westgate
PartyCandidateVotes%±%
Conservative Pam Tracey 902 45
Labour Gary Mills66033
Green Matthew Sidford27214
Liberal Democrats Sebastian Field1618
Majority24212
Conservative hold Swing
Kingsholm and Wotton
PartyCandidateVotes%±%
Liberal Democrats Jeremy Hilton 1,020 41
Labour David Hitchings47719
Conservative Matthew Stevens41317
UKIP Mike Smith41217
Green Jonathan Ingleby1386
Majority54322
Liberal Democrats hold Swing
Longlevens
PartyCandidateVotes%±%
Conservative Kathy Williams 1,353 41
UKIP Jack Bavin76823
Liberal Democrats Mike Whyham66720
Labour Patrick Sweeney36011
Green Chris Britton1394
Majority58518
Conservative hold Swing
Quedgeley
PartyCandidateVotes%±%
Conservative Mark Hawthorne 797 32
Liberal Democrats Anna Mozol56023
UKIP Daryl Stanbury49620
Labour Kevin Neal47920
Green Gerald Hartley1215
Majority2379
Conservative hold Swing
Tuffley
PartyCandidateVotes%±%
Labour Tracy Millard 1,044 36
Conservative Colin Morgan99935
UKIP Allen Prout69224
Liberal Democrats Isabel Brazil1345
Majority451
Labour gain from Conservative Swing

Stroud

Bisley and Painswick
PartyCandidateVotes%±%
Conservative Jason Bullingham 1,500 41
Green Anna Bonallack92825
UKIP Duncan Richardson62517
Labour Sheila McGrath45612
Liberal Democrats Daniel Murch1454
Majority57216
Conservative hold Swing
Cam Valley
PartyCandidateVotes%±%
Conservative Brian Tipper 1,479 43
Labour John Fowles1,40941
Liberal Democrats Thomas Cairns3159
Green Tony McNulty2718
Majority702
Conservative hold Swing
Dursley
PartyCandidateVotes%±%
Labour Stephen Lydon 1,003 35
Conservative Alex Stennett95233
Liberal Democrats Brian Marsh55820
Green Nicola Hillary34512
Majority512
Labour gain from Conservative Swing
Hardwicke and Severn
PartyCandidateVotes%±%
Conservative Anthony Blackburn 1,246 52
Labour Sarah Madley65827
Green Sue Hartley36715
Liberal Democrats Myles Robinson1295
Majority58825
Conservative hold Swing
Minchinhampton
PartyCandidateVotes%±%
Conservative Stan Waddington 1,243 33
Green John Williams94625
UKIP Adrian Blake74320
Labour David Taylor63717
Liberal Democrats Felicity Hornby1534
Majority2978
Conservative hold Swing
Nailsworth
PartyCandidateVotes%±%
Conservative Dorcas Binns 1,351 42
Labour Jo Smith1,12835
Green Uta Baldauf57818
Liberal Democrats Paul McCloskey1354
Majority2237
Conservative hold Swing
Rodborough
PartyCandidateVotes%±%
Labour Brian Oosthuysen 1,318 43
UKIP Richard Williams54918
Conservative Rodger Cuddingham54618
Green Philip Blomberg34011
Liberal Democrats Christine Headley29710
Majority76925
Labour gain from Conservative Swing
Stonehouse
PartyCandidateVotes%±%
Labour Lesley Williams 1,111 44
Conservative Lawrie Hall45818
UKIP Steve Parker41016
Independent Trevor Barker28111
Green Claire Sheridan1837
Liberal Democrats Roberta Crawley733
TUSC Chris Moore301
Majority65326
Labour hold Swing
Stroud Central
PartyCandidateVotes%±%
Green Sarah Lunnon 1,501 40
Labour Tosca Cabello-Watson1,04228
Conservative Debbie Young57715
UKIP Harry Carr51214
Liberal Democrats Adrian Walker-Smith1083
Majority45912
Green hold Swing
Wotton-under-Edge
PartyCandidateVotes%±%
Liberal Democrats John Cordwell 1,251 43
Conservative Lesley Reeves1,11438
Labour Laurence Cotterell34412
Green Graham Spencer2248
Majority1375
Liberal Democrats hold Swing

Tewkesbury

Bishops Cleeve
PartyCandidateVotes%±%
Conservative Robert Bird 1,486 49
Liberal Democrats Peter Richmond1,12937
Labour John Hurley39613
Majority35712
Conservative gain from Liberal Democrats Swing
Brockworth
PartyCandidateVotes%±%
Conservative Robert Vines 1,173 42
Liberal Democrats Jude Perez1,15241
Labour Edward Buxton47017
Majority211
Conservative hold Swing
Churchdown
PartyCandidateVotes%±%
Liberal Democrats Bill Whelan 1,439 49
Conservative Graham Bocking87330
Labour David Carter41414
Green Leo Fletcher2278
Majority56619
Liberal Democrats hold Swing
Highnam
PartyCandidateVotes%±%
Conservative Phil Awford 1,930 67
Labour Keir Dhillon54419
Liberal Democrats Audrey Ricks40714
Majority1,38648
Conservative hold Swing
Tewkesbury
PartyCandidateVotes%±%
Independent Mike Sztymiak 982 40
Conservative Kevin Cromwell72429
UKIP Stuart Adair49620
Labour Mike Reynolds2018
Liberal Democrats Pearl Stokes723
Majority25811
Independent hold Swing
Tewkesbury East
PartyCandidateVotes%±%
Conservative Vernon Smith 909 37
Independent Gordon Shurmer50521
UKIP Steve Cooper47920
Liberal Democrats Cindy Bexfield25010
Labour Rosemary Phillips2239
Green Robert Brookes592
Majority40416
Conservative hold Swing
Winchcombe
PartyCandidateVotes%±%
Conservative Roger Wilson 1,927 62
Liberal Democrats Sue Hillier-Richardson66321
Labour Susan Sturgeon51617
Majority1,26441
Conservative hold Swing

Changes 2013–2017

In July 2016, UKIP group leader Alan Preest defected to the Conservatives, claiming that the party lacked a purpose following the EU Referendum. [7] He was followed shortly thereafter by UKIP councillor Colin Guyton, who left UKIP to serve as an independent. [8] He later resigned from the County Council entirely, but a by-election was not held in his division due to the short length of time between then and the 2017 local elections. [9]

Mitcheldean

A by-election was held for the Mitcheldean Division on 23 October 2014 following the death of Independent councillor Norman Stephens.

Mitcheldean by-election 23 October 2014
PartyCandidateVotes%±%
Conservative Brian Robinson 959 38 +14
UKIP Malcolm Berry55022+3
Independent Ian Whitburn45518+18
Labour Jackie Fraser27811+1
Liberal Democrats Sue Henchley1505-1
Green Ken Power1064-
Turnout
Conservative gain from Independent Swing

Churchdown

A by-election was held on Thursday 5 May 2016 for the Churchdown Division due to the death of County Councillor Bill Whelan.

Churchdown by-election 5 May 2016
PartyCandidateVotes%±%
Liberal Democrats Jack Williams 1,700 54 +5
Conservative Graham Bocking1,06234+4
Labour Edward Buxton35912-2
Turnout
Liberal Democrats hold Swing

Notes and references

Notes
  1. However, note that this was an election to the county council only; elections to district councils are held in other years.
  2. Although described in the official consultation as an open proposal as to the Size of Council, this denotes the number of councillors only, not relating to budget or number of local government staff.
References
  1. "Election Timetable" . Retrieved 3 May 2013.
  2. "Gloucestershire County Council elections live coverage". This is Gloucestershire. 3 May 2013. Archived from the original on 4 May 2013. Retrieved 3 May 2013.
  3. "The Representation of the People (Form of Canvass) (England and Wales) Regulations 2006, Schedule Part 1". Legislation.gov.uk. 13 October 2011. Retrieved 18 April 2012.
  4. "I have two homes. Can I register at both addresses?". The Electoral Commission. Archived from the original on 31 December 2013. Retrieved 5 January 2011.
  5. "LGBCE - Gloucestershire County Council single member ward review". Archived from the original on 30 May 2013. Retrieved 19 May 2013.
  6. "Gloucestershire". BBC News. 3 May 2013. Retrieved 3 May 2013.
  7. "UKIP council leader defects to Tories saying party 'doesn't have a point any more' after EU Referendum". ITV News. 1 July 2016.
  8. "Councillors leave UKIP | theforestreview.co.uk". 6 July 2016.
  9. "Former UKIP councillor delays resignation to avoid by-election". Gloucester Live. 23 November 2016. Archived from the original on 24 November 2016.

4. ^ http://glostext.gloucestershire.gov.uk/mgElectionResults.aspx?ID=3&V=1&RPID=32877983 - Accessed 4-5-2013

Related Research Articles

<span class="mw-page-title-main">2009 Cambridgeshire County Council election</span>

An election to Cambridgeshire County Council took place on 4 June 2009 as part of the 2009 United Kingdom local elections. The election was delayed from 7 May to coincide with elections to the European Parliament. 69 councillors were elected from 60 electoral divisions, which returned either one or two county councillors each by first-past-the-post voting. The Conservative Party retained their majority on the council, while the Green Party and UKIP gained their first seats.

<span class="mw-page-title-main">2013 United Kingdom local elections</span>

The 2013 United Kingdom local elections took place on Thursday 2 May 2013. Elections were held in 35 English councils: all 27 non-metropolitan county councils and eight unitary authorities, and in one Welsh unitary authority. Direct mayoral elections took place in Doncaster and North Tyneside. These elections last took place on the 4 June 2009 at the same time as the 2009 European Parliament Elections, except for County Durham, Northumberland and the Anglesey where elections last took place in 2008.

<span class="mw-page-title-main">2014 United Kingdom local elections</span>

The 2014 United Kingdom local elections were held on 22 May 2014. Usually these elections are held on the first Thursday in May but were postponed to coincide with the 2014 European Parliament Elections. Direct elections were held for all 32 London boroughs, all 36 metropolitan boroughs, 74 district/borough councils, 19 unitary authorities and various mayoral posts in England and elections to the new councils in Northern Ireland.

<span class="mw-page-title-main">2013 Leicestershire County Council election</span>

An election to Leicestershire County Council took place on 2 May 2013 as part of the 2013 United Kingdom local elections. 55 councillors were elected from 52 electoral divisions, which returned either one or two county councillors each by first-past-the-post voting for a four-year term of office. The Conservatives held control of the council with a reduced majority of 5 seats. Despite a strong challenge from UKIP, the party only gained 2 seats whilst the Liberal Democrats lost one seat and Labour recouped some of their 2009 losses, gaining 6 seats.

<span class="mw-page-title-main">2013 West Sussex County Council election</span>

The West Sussex County Council election, 2013 took place on 2 May 2013, as part of the 2013 United Kingdom local elections. All 71 electoral divisions were up for election, which returned one county councillor each by first-past-the-post voting for a four-year term of office. At this election, the Conservative Party was seeking to retain overall control of the council, and the Liberal Democrats to maintain their position as the main opposition party.

<span class="mw-page-title-main">2013 East Sussex County Council election</span>

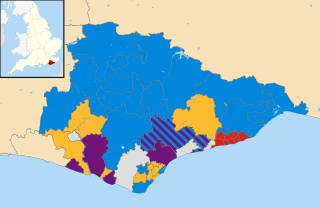
The East Sussex County Council election, 2013 took place on 2 May 2013 as part of the 2013 United Kingdom local elections. All 49 councillors of East Sussex County Council were elected from 44 electoral divisions, which return either one or two councillors each by first-past-the-post voting for a four-year term of office. The electoral divisions were the same as those used at the previous election in 2009. No elections were held in Brighton and Hove, which is a unitary authority outside the area covered by the County Council.

<span class="mw-page-title-main">2013 Hampshire County Council election</span>

An election to Hampshire County Council took place on 2 May 2013 as part of the 2013 United Kingdom local elections. 78 councillors were elected from 75 electoral divisions, which returned either one or two county councillors each by first-past-the-post voting for a four-year term of office. The electoral divisions were the same as those of the previous election in 2009. No elections were held in Portsmouth and Southampton, which are unitary authorities outside the area covered by the County Council. The election saw the Conservative Party retain overall control of the council, with a reduced majority of five councillors.

<span class="mw-page-title-main">2013 Kent County Council election</span>

The Kent County Council election, 2013 was an election to all 84 seats on Kent County Council held on Thursday 2 May as part of the 2013 United Kingdom local elections. 84 councillors were elected from 72 electoral divisions, which returned either one or two county councillors each by first-past-the-post voting for a four-year term of office. The electoral divisions were the same as those used at the previous election in 2009. No elections were held in Medway, which is a unitary authority outside the area covered by the County Council. The election saw the Conservative Party narrowly retain overall control of the council.

<span class="mw-page-title-main">2013 Lincolnshire County Council election</span>

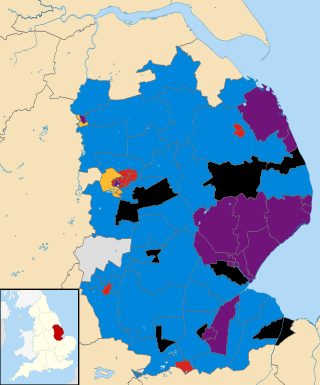
An election to Lincolnshire County Council took place on 2 May 2013 as part of the 2013 United Kingdom local elections. 77 electoral divisions returned one county councillor each by first-past-the-post voting for a four-year term of office. The electoral divisions were the same as those used at the previous election in 2009. No elections were held in North Lincolnshire or North East Lincolnshire, which are unitary authorities outside the area covered by the County Council.

<span class="mw-page-title-main">2013 Surrey County Council election</span>

The Surrey County Council election, 2013 took place on 2 May 2013 as part of the 2013 United Kingdom local elections. 81 electoral divisions returned one county councillor each by first-past-the-post voting for a four-year term of office. Following a review, new electoral division boundaries were introduced for this election, increasing the number of councillors from 80 to 81.

<span class="mw-page-title-main">2013 Essex County Council election</span>

An election to Essex County Council took place on 2 May 2013 as part of the 2013 United Kingdom local elections. 75 councillors were elected from 70 electoral divisions, which returned either one or two county councillors each by first-past-the-post voting for a four-year term of office. The electoral divisions were the same as those used at the previous election in 2009. No elections were held in Thurrock or Southend-on-Sea, which are unitary authorities outside the area covered by the County Council.

<span class="mw-page-title-main">2013 Cornwall Council election</span>

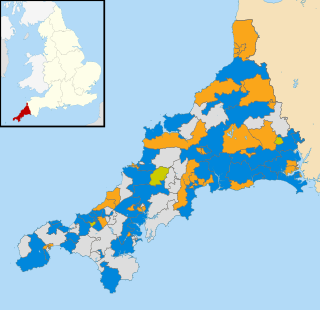
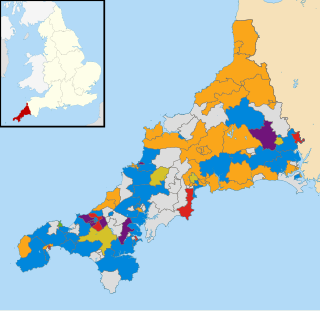
The Cornwall Council election, 2013, was an election for all 123 seats on the council. Cornwall Council is a unitary authority that covers the majority of the ceremonial county of Cornwall, with the exception of the Isles of Scilly which have an independent local authority. The elections took place concurrently with other local elections across England and Wales.

<span class="mw-page-title-main">2013 Staffordshire County Council election</span> UK local elections

An election to Staffordshire County Council took place on 2 May 2013 as part of the 2013 United Kingdom local elections. 62 electoral divisions returned one county councillor each by first-past-the-post voting for a four-year term of office. Following a boundary review, new electoral division boundaries were established for this election. No elections were held in Stoke-on-Trent, which is a unitary authority outside the area covered by the County Council. The council continues to be administered on the Leader and Cabinet model.

<span class="mw-page-title-main">2013 Dorset County Council election</span>

An election to Dorset County Council took place on 2 May 2013 as part of the United Kingdom local elections. 45 councillors were elected from 42 electoral divisions, which returned either one or two county councillors each by first-past-the-post voting for a four-year term of office. The electoral divisions were the same as those used at the previous election in 2009. No elections were held in Bournemouth or Poole, which are unitary authorities outside the area covered by the County Council. The election saw the Conservative Party maintain overall control of the council.

<span class="mw-page-title-main">2013 Suffolk County Council election</span>

Elections to Suffolk County Council took place on 2 May 2013 as part of the 2013 United Kingdom local elections. 75 councillors were elected from 63 electoral divisions, which returned either one or two county councillors each by first-past-the-post voting for a four-year term of office. The electoral divisions were the same as those used at the previous election in 2009.

<span class="mw-page-title-main">2013 Northamptonshire County Council election</span>

An election to Northamptonshire County Council took place on 2 May 2013 as part of the 2013 United Kingdom local elections. Following a boundary review, the number of county councillors was reduced from 73 to 57 from this election. All members were elected by first-past-the-post voting from single-member electoral divisions for a four-year term of office. The Conservative Party held on to their overall majority, having held overall control of the council since 2005.

<span class="mw-page-title-main">2017 United Kingdom local elections</span>

The 2017 United Kingdom local elections were held on Thursday 4 May 2017. Local elections were held across Great Britain, with elections to 35 English local authorities and all councils in Scotland and Wales.

<span class="mw-page-title-main">2017 Gloucestershire County Council election</span>

The 2017 Gloucestershire County Council election took place on 4 May 2017 as part of the 2017 local elections in the United Kingdom. All 53 councillors were elected from electoral divisions which returned one county councillor each by first-past-the-post voting for a four-year term of office. Control of the council went from a Conservative Party minority to a majority administration.

<span class="mw-page-title-main">2017 Cornwall Council election</span>

The 2017 Cornwall Council election was held on 4 May 2017 as part of the 2017 local elections in the United Kingdom. 122 councillors were elected from the 121 electoral divisions of Cornwall Council, which returned either one or two councillors each by first-past-the-post voting for a four-year term of office. Although originally scheduled to take place on the same day, the election in the Bodmin St Petroc ward was countermanded following the death of Liberal Democrat candidate Steve Rogerson and was held on 8 June.

<span class="mw-page-title-main">2017 Welsh local elections</span>

The 2017 Welsh local elections were held on 4 May 2017 to elect members of all 22 local authorities in Wales. This included the Isle of Anglesey, which was previously up for election in 2013 due to having its elections delayed for a year. Community council elections also took place on the same day. These local elections were held as part of the 2017 local elections in the United Kingdom. Apart from Anglesey, the last elections were held in 2012. Normally these elections take place every four years, but the 2017 elections were postponed for a year in order to avoid clashing with the 2016 Welsh Assembly election, which itself had been postponed by a year to avoid clashing with the 2015 general election.