District result maps
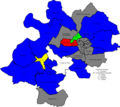 2006 results map
 2007 results map
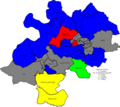 2008 results map
 2010 results map
 2016 results map
 2021 results map
 2024 results map
Stroud District Council in Gloucestershire, England is elected every four years. The all-out elections every four years began in 2016; up to and including the 2015 election one third of the council was elected each year, followed by one year without election.


| Party | Candidate | Votes | % | ±% | |
|---|---|---|---|---|---|
| Labour | 308 | 55.2 | |||
| Liberal Democrats | 250 | 44.8 | |||
| Majority | 58 | 10.4 | |||
| Turnout | 558 | ||||
| Labour gain from Liberal Democrats | Swing | ||||
| Party | Candidate | Votes | % | ±% | |
|---|---|---|---|---|---|
| Labour | 857 | 55.8 | |||
| Liberal Democrats | 272 | 17.7 | |||
| Conservative | 240 | 15.6 | |||
| Green | 167 | 10.8 | |||
| Majority | 585 | 381 | |||
| Turnout | 1,536 | ||||
| Labour hold | Swing | ||||
| Party | Candidate | Votes | % | ±% | |
|---|---|---|---|---|---|
| Conservative | 275 | 60.3 | +35.5 | ||
| Liberal Democrats | 159 | 34.9 | −19.7 | ||
| Labour | 22 | 4.8 | −15.8 | ||
| Majority | 116 | 25.4 | |||
| Turnout | 456 | 46.0 | |||
| Conservative gain from Liberal Democrats | Swing | ||||
| Party | Candidate | Votes | % | ±% | |
|---|---|---|---|---|---|
| Liberal Democrats | 1,319 | 35.4 | +9.5 | ||
| Conservative | 1,308 | 35.1 | +4.0 | ||
| Labour | 1,163 | 29.6 | +5.6 | ||
| Majority | 11 | 0.3 | |||
| Turnout | 3,790 | 67.8 | |||
| Liberal Democrats hold | Swing | ||||
| Party | Candidate | Votes | % | ±% | |
|---|---|---|---|---|---|
| Conservative | Tim Frankau | 652 | 39.7 | +3.2 | |
| Liberal Democrats | Brian Marsh | 609 | 37.1 | +8.1 | |
| Labour | Paul Denney | 382 | 23.2 | −11.3 | |
| Majority | 43 | 2.6 | |||
| Turnout | 1,643 | 35.8 | |||
| Conservative hold | Swing | ||||
| Party | Candidate | Votes | % | ±% | |
|---|---|---|---|---|---|
| Labour | Andrew Treacher | 652 | 43.4 | +4.7 | |
| Conservative | Linda Jeffreys | 425 | 28.3 | +0.0 | |
| Liberal Democrats | John Bowen | 257 | 17.1 | −4.1 | |
| Green | Helen Royall | 169 | 11.2 | −0.6 | |
| Majority | 227 | 15.1 | |||
| Turnout | 1,503 | 28.9 | |||
| Labour hold | Swing | ||||
| Party | Candidate | Votes | % | ±% | |
|---|---|---|---|---|---|
| Labour | Thomas Williams | 489 | 43.1 | +6.9 | |
| Conservative | Linda Jeffreys | 407 | 35.9 | +3.1 | |
| Liberal Democrats | Darren Jones | 238 | 21.0 | +8.5 | |
| Majority | 82 | 7.2 | |||
| Turnout | 1,134 | 22.1 | |||
| Labour hold | Swing | ||||
| Party | Candidate | Votes | % | ±% | |
|---|---|---|---|---|---|
| Conservative | Rowland Blackwell | 857 | 44.5 | +6.1 | |
| Green | Chris Harmer | 810 | 42.0 | +4.1 | |
| Labour | Jo Smith | 261 | 13.5 | +0.2 | |
| Majority | 47 | 2.5 | |||
| Turnout | 1,928 | 38.0 | |||
| Conservative hold | Swing | ||||
| Party | Candidate | Votes | % | ±% | |
|---|---|---|---|---|---|
| Conservative | Margaret Wigzell | 366 | 54.9 | +0.5 | |
| Labour | Audrey Smith | 177 | 26.5 | +10.8 | |
| Liberal Democrats | Adrian Walker-Smith | 124 | 18.6 | +6.8 | |
| Majority | 189 | 28.3 | |||
| Turnout | 667 | 38.8 | |||
| Conservative hold | Swing | ||||
| Party | Candidate | Votes | % | ±% | |
|---|---|---|---|---|---|
| Labour | Miranda Clifton | 654 | 53.2 | +6.0 | |
| Conservative | Loraine Patrick | 575 | 46.8 | −6.0 | |
| Majority | 79 | 6.4 | |||
| Turnout | 1,229 | ||||
| Labour gain from Conservative | Swing | ||||
| Party | Candidate | Votes | % | ±% | |
|---|---|---|---|---|---|
| Green | Martin Baxendale | 291 | 42.8 | −4.3 | |
| Labour | James Heslop | 230 | 33.8 | +2.3 | |
| UKIP | Stuart Love | 76 | 11.2 | +11.2 | |
| Conservative | Stephen Davies | 67 | 9.9 | −11.5 | |
| TUSC | Lucy Roberts | 16 | 2.4 | +2.4 | |
| Majority | 61 | 9.0 | |||
| Turnout | 680 | ||||
| Green hold | Swing | ||||
| Party | Candidate | Votes | % | ±% | |
|---|---|---|---|---|---|
| Conservative | Darren Loftus | 751 | 45.1 | +12.9 | |
| Labour | Karen Pitney | 427 | 25.6 | −2.0 | |
| Green | Robin Lewis | 341 | 20.5 | −7.5 | |
| Liberal Democrats | Kris Beacham | 146 | 8.8 | +8.8 | |
| Majority | 324 | 19.5 | |||
| Turnout | 1,665 | ||||
| Conservative hold | Swing | ||||
| Party | Candidate | Votes | % | ±% | |
|---|---|---|---|---|---|
| Labour | Trevor Hall | 889 | 50.5 | +13.5 | |
| Conservative | Loraine Patrick | 704 | 40.0 | +15.3 | |
| Green | Yvon Dignon | 90 | 5.1 | −9.1 | |
| Liberal Democrats | Richard Blackwell-Whitehead | 79 | 4.5 | −19.5 | |
| Majority | 185 | 10.5 | |||
| Turnout | 1,762 | ||||
| Labour hold | Swing | ||||
| Party | Candidate | Votes | % | ±% | |
|---|---|---|---|---|---|
| Conservative | Lindsay Green | 993 | 49.8 | +4.6 | |
| Labour | Liz Ashton | 686 | 34.4 | +0.8 | |
| Liberal Democrats | Mike Stayte | 231 | 11.6 | −1.5 | |
| Green | Thomas Willetts | 82 | 4.1 | −3.9 | |
| Majority | 307 | 15.4 | |||
| Turnout | 1,992 | ||||
| Conservative hold | Swing | ||||
| Party | Candidate | Votes | % | ±% | |
|---|---|---|---|---|---|
| Green | Gary Luff | 1,168 | 45.9 | +11.9 | |
| Conservative | Sue Williams | 817 | 32.1 | −10.3 | |
| Liberal Democrats | Roz Savage | 381 | 15.0 | +15.0 | |
| Labour | Ela Pathak-Sen | 180 | 7.1 | −16.5 | |
| Majority | 351 | 13.8 | |||
| Turnout | 2,546 | ||||
| Green gain from Conservative | Swing | ||||
| Party | Candidate | Votes | % | ±% | |
|---|---|---|---|---|---|
| Green | Cate James-Hodges | 416 | 56.3 | ||
| Labour | Shelley Rider | 118 | 16.0 | ||
| Reform UK | Daryl Leslie Arthur Smith | 108 | 14.6 | ||
| Conservative | Hena Mannan-Rahman | 60 | 8.1 | ||
| Liberal Democrats | Philip James Purves | 27 | 3.7 | ||
| UKIP | Lucian Aeris | 10 | 1.4 | ||
| Majority | 298 | 40.3 | |||
| Turnout | 743 | 40.9 | |||
| Green gain from Labour | |||||