2015 Forest of Dean District Council election

Last updated

2015 Forest of Dean District Council election
Flag of the United Kingdom.svg
  2011 7 May 2015 2019  

All 48 seats to Forest of Dean District Council
25 seats needed for a majority
 First partySecond partyThird party
 
Party Conservative Labour UKIP
Seats won21137
Seat changeIncrease2.svg3Decrease2.svg4Increase2.svg6
Popular vote27,25321,02213,213
Percentage34.12%26.32%16.54%
SwingDecrease2.svg5.15Decrease2.svg3.30Increase2.svg15.45

 Fourth partyFifth partySixth party
 
Party Independent Green Liberal Democrats
Seats won610
Seat changeDecrease2.svg5Increase2.svg1Decrease2.svg1
Popular vote8,1238,1762,091
Percentage10.17%10.24%2.62%
SwingDecrease2.svg9.43Increase2.svg6.64Decrease2.svg4.21

Council control before election

No Overall Control

Council control after election

No Overall Control

Elections for all seats on Forest of Dean District Council were held on 7 May 2015 as part of the 2015 United Kingdom local elections. No party gained overall control.

Contents

The Conservatives remained the largest party on the council, having increased their number of Councillors, but failing to gain an overall majority. This election saw the Green Party gain their first seats on the council, while the Liberal Democrats lost their only Councillor. [1]

2015 local election results in the Forest of Dean Forest of Dean wards 2015.svg
2015 local election results in the Forest of Dean

Ward results

Alvington, Aylburton & West Lydney

Alvington, Aylburton & West Lydney (2 seats)
PartyCandidateVotes%±%
Conservative Frankie Evans 747 44.02 -5.70
UKIP Jim Simpson 659 20.70 +20.70
Conservative Marion Murdoch Winship654
Labour Hazel Joan Brookshaw59918.82-2.46
Green Alan David Olney40512.72+12.72
Independent Claude Ronald Mickleson1193.74+3.74
Turnout
Conservative hold Swing
UKIP gain from Independent Swing

Awre

Awre (1 seat)
PartyCandidateVotes%±%
Conservative Gareth Rhys Hughes 353 37.12 -13.31
Green Andy Blake34135.86-13.71
UKIP Roger Ashley Jean Wilkinson25727.02+27.02
Turnout
Conservative hold Swing

Berry Hill

Berry Hill (1 seat)
PartyCandidateVotes%±%
Labour Tim Gwilliam 459 51.00 -4.15
Conservative Nigel John Bluett31935.44-9.40
Green Tony Clapp12213.56+13.56
Turnout
Labour hold Swing

Blaisdon and Longhope

Blaisdon and Longhope (1 seat)
PartyCandidateVotes%±%
Independent Dave East 551 47.91 -14.24
Conservative Kate Elisabeth Robinson26022.61-7.06
Labour Jan Royall14212.35+4.17
UKIP Ian Mitchell Aitken13711.91+11.91
Green Nicky Packer605.22+5.22
Turnout
Independent hold Swing

Bream

Bream (2 seats)
PartyCandidateVotes%±%
Labour Paul John Hiett 597 36.23 -12.38
UKIP Richard Nicholas Leppington 528 30.45 +30.45
Labour Bill Evans513
Conservative Brian Joseph Edwards46426.31-13.44
UKIP Averil Elizabeth Sumners405
Conservative Julia Ann Lawton342
Green Paul Tyrone Lounds2157.02+7.02
Turnout
Labour hold Swing
UKIP gain from Labour Swing

Bromsberrow & Dymock

Bromsberrow & Dymock (1 seat)
PartyCandidateVotes%±%
Conservative Roger Yeates 686 57.89 +4.64
UKIP Simon Roberts30926.08+26.08
Green Sue Clarke19016.03+16.3
Turnout
Conservative hold Swing

Christchurch and English Bicknor

Christchurch and English Bicknor (1 seat)
PartyCandidateVotes%±%
Conservative Marrilyn Jane Smart 413 42.23 -57.77
Labour Jamie Elsmore25325.87+25.87
UKIP Ralph Lawrence Wintle15015.34+15.34
Independent Eileen Marie Dyer878.90+8.90
Green Geraint Slingsby Williams757.67+7.67
Turnout
Conservative hold Swing

Note: During the 2011 elections, this ward was only contested by the Conservatives, who were elected unopposed.

Churcham and Huntley

Churcham and Huntley (1 seat)
PartyCandidateVotes%±%
Conservative Brian Anthony Jones 413 37.51 -5.90
Independent Alan Stephen Wood27224.70-17.28
UKIP Sandy Sparks23221.07+21.07
Labour Shaun Brown11510.45-4.16
Green Alan Rupert Clarke696.27+6.27
Turnout
Conservative hold Swing

Cinderford East

Cinderford East (2 seats)
PartyCandidateVotes%±%
Labour Max Coborn 749 54.80 -16.42
Labour Di Martin 689
Conservative Grace Bensted35525.19-3.59
UKIP Aodha Daithi Conall O'Carroll33612.80+12.80
Conservative Donald Leonard Ogilvie Horne306
Green Kate De Selincourt1897.20+7.20
Turnout
Labour hold Swing
Labour hold Swing

Cinderford West

Cinderford West (3 seats)
PartyCandidateVotes%±%
Labour Graham Leslie Morgan 1,064 45.62 -17.12
Labour Lynn Iris Sterry 831
Labour Roger Anthony Sterry 712
UKIP Roy Bardo67221.44+21.44
UKIP Ann Guyton553
Conservative Diana Katherine Bensted53425.90+2.64
Conservative Charles William Wray Smart476
Conservative Jonathan Burns470
Green Jill Raymond4027.04+7.04
Turnout
Labour hold Swing
Labour hold Swing
Labour hold Swing

Coleford Central

Coleford Central (2 seats)
PartyCandidateVotes%±%
Conservative Carole Ann Allaway Martin 583 33.22 -7.98
Independent Clive Terence Elsmore 487 17.84 -3.63
Labour Gray Grindle43931.21-6.11
Labour Kate Williams413
Conservative Nicholas Gordan Wright324
Liberal Democrats Heather Margaret Lusty2729.96+9.96
Green Andrew Peter Clarke2127.77+7.77
Turnout
Conservative hold Swing
Independent hold Swing

Coleford East

Coleford East (3 seats)
PartyCandidateVotes%±%
Labour Roger John James 951 41.41 +4.39
UKIP Martin Robert Hill 914 15.14 +15.14
Conservative David William Easton 866 27.04 -11.76
Labour Yazmine Zora Alimi860
Conservative Denis Riley766
Labour Malcolm Thomas Sadley688
Independent Maria Ann Edey4477.41-7.40
Green Elliot Dean Clarke4367.22+7.22
Independent Danny Faux1071.77+1.77
Turnout
Labour hold Swing
UKIP gain from Labour Swing
Conservative gain from Independent Swing

Hartpury

Hartpury (1 seat)
PartyCandidateVotes%±%
Independent Philip Howard Joseph Burford 601 55.75 -0.94
Conservative Ben Stone37835.6-8.24
Green Caroline Vieira999.18+9.18
Turnout
Independent hold Swing

Hewelsfield and Woolaston

Hewelsfield and Woolaston (1 seat)
PartyCandidateVotes%±%
Conservative Patrick Christopher John Molyneux 605 53.54 -9.69
Green Robin Charles Larkham19216.99-19.78
UKIP Sandra Hazel Leppington16714.78+14.78
Labour Jane Johnson16614.69+14.69
Turnout
Conservative hold Swing

Littledean & Ruspidge

Littledean & Ruspidge (2 seats)
PartyCandidateVotes%±%
Conservative David John Hawthorne 736 31.06 -6.41
Labour Bernie O'Neill 566 25.96 -9.33
Conservative Dawn Lucas513
Labour Rowland David Pritchard478
Green Sid Phelps46921.39+21.39
UKIP David O'Carroll44821.59+21.59
UKIP Anthony Reeve420
Green Bob Rhodes391
Turnout
Conservative hold Swing
Labour hold Swing

Lydbrook & Ruardean

Lydbrook & Ruardean (3 seats)
PartyCandidateVotes%±%
Independent Andrew Edward Gardiner 927 13.02 -10.79
Labour Bruce Alan Hogan 865 31.7 -6.41
UKIP Colin Firth Guyton 817 21.36 +7.97
Labour Karen Leigh Brown813
UKIP Jimmy Jewell704
Conservative Joanna Carolyn Markham63625.83+0.51
Conservative Sarah Cuthbert631
Green Eddie Parsons6218.72+8.72
Conservative Helen Mary Victoria McMillan572
Labour David Stewart Thomson534
Turnout
Independent hold Swing
Labour hold Swing
UKIP gain from Labour Swing

Lydney East

Lydney East (3 seats)
PartyCandidateVotes%±%
Conservative James Arthur Bevan 955 35.06 -1.24
UKIP Carol Elizabeth Harris 861 26.34 +26.34
Labour Bill Osborne 818 26.20 -0.64
Labour Val Hobman787
UKIP Claire Elizabeth Vaughan753
Conservative David Cooksley665
Conservative Steph Lord528
Green Steve Stockham4847.90-4.02
Independent Brian Pearman2764.50+4.50
Turnout
Conservative hold Swing
UKIP gain from Labour Swing
Labour hold Swing

Lydney North

Lydney North (1 seat)
PartyCandidateVotes%±%
UKIP Alan Preest 414 36.64 +36.61
Conservative Judy Davis34830.80-4.50
Labour Dave Clarke26123.10-7.27
Green Destiny Rose Blake1079.47+9.47
Turnout
UKIP gain from Conservative Swing

Mitcheldean & Drybrook

Mitcheldean & Drybrook (3 seats)
PartyCandidateVotes%±%
Labour Jackie Fraser 788 31.14 -7.99
Labour Douglas Martin Scott 689
Conservative Brian Richard Robinson 682 26.42 +1.68
Conservative Zoe Clare Boyles622
UKIP Malcolm Albert Berry59218.27+18.27
UKIP Steve Beaumont540
Independent Ian Richard Whitburn5178.35-7.35
Labour Andrew James Knight542
Liberal Democrats Sue Henchley41711.44-8.99
Conservative Syed Babar Abbas Zaidi333
Green Nigel Duncan Salter2714.37+4.37
Liberal Democrats Heather Dalziel165
Liberal Democrats Jonathan Gault127
Turnout
Labour hold Swing
Labour gain from Independent Swing
Conservative hold Swing

Newent Central

Newent Central (2 seats)
PartyCandidateVotes%±%
Independent Julia Denise Gooch 815 24.65 -7.75
Conservative Len Lawton 768 40.50 +1.92
Conservative Eli Heathfield571
Labour Justin Kneen41812.64-3.15
Green Ken Power3029.13+9.13
Liberal Democrats Gill Moseley2617.89+7.89
Independent Nick Winter1715.17+5.17
Turnout
Independent hold Swing
Conservative hold Swing

Newland and St Briavels

Newland and St Briavels (2 seats)
PartyCandidateVotes%±%
Conservative Terry Hale 791 38.47 +0.18
Green Chris McFarling 633 18.20 +18.20
Independent Arthur James Thomas58616.85-4.85
Conservative Alan Roy John Bensted547
Labour Anna Victoria Parry-Hearn48714.00-5.61
Independent David Andrew John Wheeler43412.48+12.48
Turnout
Conservative hold Swing
Green gain from Independent Swing

Newnham & Westbury

Newnham & Westbury (2 seats)
PartyCandidateVotes%±%
Conservative Richard Henry Boyles 679 36.22 +1.90
Independent Simon Charles Phelps 609 20.91 +20.91
Green Tom Marshall-Andrews44415.24+1.63
Conservative Michaela Dawn Lucas376
UKIP John Hector Cumper29310.06+10.06
Labour Glyn Ford27717.58-0.69
Labour Alessandro Aled Ford235
Turnout
Conservative hold Swing
Independent gain from Independent Swing

Oxenhall and Newent North East

Oxenhall and Newent North East (1 seat)
PartyCandidateVotes%±%
Conservative Craig Lawton 398 38.34 -39.43
Independent Martyn Raymond Thomas Vick28026.97+26.97
Independent Mary Duncan16315.70+15.70
Labour Gillian Hickling11911.46-10.76
Green Johnny Back787.51+7.51
Turnout
Conservative hold Swing

Pillowell

Pillowell (2 seats)
PartyCandidateVotes%±%
Conservative Diana Mary Edwards 686 31.51 -5.98
UKIP Alan Philip Grant 659 29.73 +29.73
Conservative John Alan Clissold573
Labour Andy Hewlett56927.70+0.43
Labour Chris Witham538
UKIP John Duncan William McOwan529
Green Andy Moore44211.06-7.81
Turnout
Conservative hold Swing
UKIP gain from Labour Swing

Redmarley

Redmarley (1 seat)
PartyCandidateVotes%±%
Conservative Clayton Dean Williams 730 62.66 -17.31
UKIP Alec Robert Tritton18415.7915.79
Labour Carolyn Hewlett12710.90-9.13
Green Brian James Greenwood12410.64+10.64
Turnout
Conservative hold Swing

Tibberton

Tibberton (1 seat)
PartyCandidateVotes%±%
Conservative Jane Henson Horne 748 66.31 -10.68
Green David Richard Humphreys16914.98+14.98
Labour Russell Hickling13812.23-10.78
Liberal Democrats Ian Iredale King736.47+6.47
Turnout
Conservative hold Swing

Tidenham

Tidenham (3 seats)
PartyCandidateVotes%±%
Conservative Gethyn Joffre Davies 1,060 50.60 -6.01
Conservative Maria Jane Edwards 897
Conservative Helen Mary Molyneux 894
Labour David John Pearce82311.33+11.33
Liberal Democrats Roy William Birch77610.69-11.22
UKIP Simon Paul Williams6809.379.37
Independent Gabriella Kirkpatrick6749.28-12.20
Green Fiona Bowie6348.738.73
Turnout
Conservative gain from Liberal Democrats Swing
Conservative hold Swing

Related Research Articles

New Forest District Council in Hampshire, England is elected every four years.

The 1999 Craven District Council election took place on 6 May 1999 to elect members of Craven District Council in North Yorkshire, England. One third of the council was up for election and the Conservative Party gained overall control of the council from no overall control.

<span class="mw-page-title-main">2008 St Albans City and District Council election</span>

The 2008 St Albans City and District Council election took place on 1 May 2008 to elect members of St Albans District Council in Hertfordshire, England. One third of the council was up for election and the Liberal Democrats gained overall control of the council from no overall control.

<span class="mw-page-title-main">2003 Wyre Forest District Council election</span>

The 2003 Wyre Forest District Council election took place on 1 May 2003 to elect members of Wyre Forest District Council in Worcestershire, England. One third of the council was up for election and the council stayed under no overall control.

<span class="mw-page-title-main">2004 Wyre Forest District Council election</span> Election in Worcestershire, England

The 2004 Wyre Forest District Council election took place on 10 June 2004 to elect members of Wyre Forest District Council in Worcestershire, England. The whole council was up for election with boundary changes since the last election in 2003. The council stayed under no overall control, but with the Conservatives taking over as the largest party on the council from the Health Concern party.

<span class="mw-page-title-main">2006 Wyre Forest District Council election</span>

The 2006 Wyre Forest District Council election took place on 4 May 2006 to elect members of Wyre Forest District Council in Worcestershire, England. One third of the council was up for election and the council stayed under no overall control.

<span class="mw-page-title-main">2007 Wyre Forest District Council election</span>

The 2007 Wyre Forest District Council election took place on 3 May 2007 to elect members of Wyre Forest District Council in Worcestershire, England. One third of the council was up for election and the council stayed under no overall control.

<span class="mw-page-title-main">2008 Wyre Forest District Council election</span>

The 2008 Wyre Forest District Council election took place on 1 May 2008 to elect members of Wyre Forest District Council in Worcestershire, England. One third of the council was up for election and the Conservative Party gained overall control of the council from no overall control.

<span class="mw-page-title-main">1979 United Kingdom local elections</span>

Local elections were held in the United Kingdom on 3 May 1979. The results provided some source of comfort to the Labour Party, who recovered some lost ground from local election reversals in previous years, despite losing the general election to the Conservative Party on the same day. The Liberals also gained councillors and a council.

<span class="mw-page-title-main">2011 Wealden District Council election</span>

The 2011 Wealden District Council election took place on 5 May 2011 to elect members of Wealden District Council in East Sussex, England. The whole council was up for election and the Conservative Party stayed in overall control of the council.

<span class="mw-page-title-main">2013 Gloucestershire County Council election</span>

Elections to Gloucestershire County Council took place on 2 May 2013 as part of the 2013 United Kingdom local elections. 53 electoral divisions elected one county councillor each by first-past-the-post voting for a four-year term of office. No elections were held in South Gloucestershire, which is a unitary authority outside the area covered by the County Council.

<span class="mw-page-title-main">2013 Suffolk County Council election</span>

Elections to Suffolk County Council took place on 2 May 2013 as part of the 2013 United Kingdom local elections. 75 councillors were elected from 63 electoral divisions, which returned either one or two county councillors each by first-past-the-post voting for a four-year term of office. The electoral divisions were the same as those used at the previous election in 2009.

<span class="mw-page-title-main">2011 Wyre Forest District Council election</span>

The 2011 Wyre Forest District Council election took place on 5 May 2011 to elect members of Wyre Forest District Council in Worcestershire, England. One third of the council was up for election and the Conservative Party stayed in overall control of the council.

<span class="mw-page-title-main">2012 Wyre Forest District Council election</span>

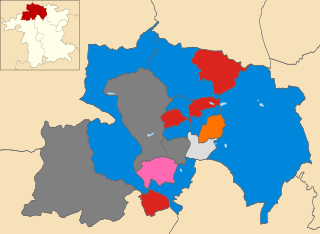
The 2012 Wyre Forest District Council election took place on 3 May 2012 to elect members of Wyre Forest District Council in Worcestershire, England. One third of the council was up for election and the Conservative Party lost overall control of the council to no overall control.

<span class="mw-page-title-main">2014 Wyre Forest District Council election</span>

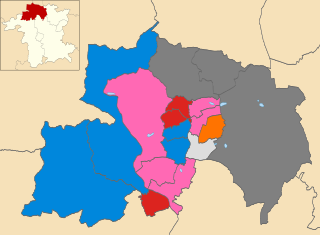
The 2014 Wyre Forest District Council election took place on 22 May 2014 to elect members of Wyre Forest District Council in Worcestershire, England. One third of the council was up for election and the council stayed under no overall control.

<span class="mw-page-title-main">2015 Wyre Forest District Council election</span>

The 2015 Wyre Forest District Council election took place on 7 May 2015 to elect members of Wyre Forest District Council in Worcestershire, England. The whole council was up for election after boundary changes reduced the number of seats by nine. The Conservative Party gained overall control of the council from no overall control.

<span class="mw-page-title-main">2007 West Oxfordshire District Council election</span>

The 2007 West Oxfordshire District Council election took place on 3 May 2007 to elect members of West Oxfordshire District Council in Oxfordshire, England. One third of the council was up for election and the Conservative Party stayed in overall control of the council.

<span class="mw-page-title-main">2014 West Oxfordshire District Council election</span>

The 2014 West Oxfordshire District Council election took place on 22 May 2014 to elect members of West Oxfordshire District Council in Oxfordshire, England. One third of the council was up for election and the Conservative Party stayed in overall control of the council.

<span class="mw-page-title-main">2019 Cannock Chase District Council election</span>

Elections to Cannock Chase District Council took place on 2 May 2019 on the same day as other local elections in England, including to several parish councils in the district. All of the council's wards were up for election, meaning a total of 15 councillors were elected.

<span class="mw-page-title-main">2019 Forest of Dean District Council election</span>

The 2019 Forest of Dean District Council election was held on 2 May 2019 as part of the 2019 United Kingdom local elections. This was the first election in the Forest of Dean following a boundary review, which reduced the total number of Councillors from 48 to 38. Due to the boundary review, party seat changes in the summary box (right) are based on notional results, not the actual 2015 results.

References

  1. "Forest of Dean election results". Forest of Dean District Council. Retrieved 28 April 2019.