2015 St Albans City and District Council election

Last updated

2015 St Albans City and District Council election
FlagOfStAlbans-PS01.svg
  2014 7 May 2015 2016  

20 of the 58 seats to St Albans City and District Council
30 seats needed for a majority
 First partySecond partyThird party
 
Party Conservative Liberal Democrats Labour
Seats after32168
Seat changeIncrease2.svg 3Decrease2.svg 1Decrease2.svg 2
Popular vote35,04718,46814,870
Percentage43.6%23.0%18.5%

 Fourth partyFifth party
 
Party Independent Green
Seats after21
Seat changeSteady2.svgSteady2.svg
Popular vote2,1835,055
Percentage2.7%6.3%

St Albans wards 2015.svg

Council control before election

Conservative

Council control after election

Conservative

The 2015 St Albans City and District Council election took place on 7 May 2015 to elect members of St Albans City and District Council in England. [1] This was on the same day as other local elections.

Contents

Summary Results

St Albans City and District Council election, 2015
PartySeatsGainsLossesNet gain/lossSeats %Votes %Votes+/−
  Conservative 3130Increase2.svg 353.4%43.6%35,047
  Liberal Democrats 1601Decrease2.svg 127.6%23.0%18,468
  Labour 802Decrease2.svg 213.8%18.5%14,870
  Independent 200Steady2.svg3.4%2.7%2,183
  Green 100Steady2.svg1.7%6.3%5,055
  UKIP 000Steady2.svg0.0%5.9%4,736
  TUSC 000Steady2.svg0.0%> 0.1%28

Ward results

[2]

Ashley

Ashley
PartyCandidateVotes%±%
Liberal Democrats Mohammad Zia 1,306 29.5 -13.0
Labour Anne Lyons1,24828.2+0.5
Conservative Emre Kaya1,19327.0+13.0
Green Robert Whitford3608.1+1.5
UKIP Charles Mason3137.0-2.2
Majority581.3-13.5
Turnout 4,42074.8+28.8
Liberal Democrats hold Swing

Batchwood

Batchwood
PartyCandidateVotes%±%
Conservative Timothy Smith 1,368 33.8 +11.5
Labour Martin Leach1,34833.3-15.9
Liberal Democrats Elizabeth Needham65416.2+6.7
UKIP Matthew Dovey3789.3-2.5
Green Lee Evans3007.4-0.3
Majority200.5-26.4
Turnout 4,04873.8+32.3
Conservative gain from Labour Swing

Clarence

Clarence
PartyCandidateVotes%±%
Liberal Democrats Samuel Rowlands 1,606 39.3 +6.8
Conservative Barry Sumpter1,37533.6+9.0
Labour Jane Cloke68316.7-3.8
Green Charis Jennings3999.8-5.8
TUSC Keith Hussey280.7+0.1
Majority2315.6-2.3
Turnout 4,09178.3+33.5
Liberal Democrats hold Swing

Colney Heath

Colney Heath
PartyCandidateVotes%±%
Liberal Democrats Christopher Brazier 1,421 43.8 +2.5
Conservative Stella Nash99430.6+11.2
Labour John Paton41712.8-2.2
UKIP Christopher Thorpe2557.9-10.7
Green Timothy Robinson1594.9-0.8
Majority42713.2
Turnout 3,24673.0
Liberal Democrats hold Swing

Cunningham

Cunningham
PartyCandidateVotes%±%
Liberal Democrats Robert Donald 1,233 35.2 +2.7
Conservative Michael Roth93626.7+6.9
Labour Co-op John Metcalf74321.2-1.3
UKIP Alan Malin37110.6-8.0
Green Rebecca Hurst2176.2-0.4
Majority297
Turnout 70.8
Liberal Democrats hold Swing

Harpenden East

Harpenden East
PartyCandidateVotes%±%
Conservative Michael Wakely 2,020 49.9 +5.9
Independent Phillipa Martyn82920.5-10.4
Labour Co-op Rosemary Ross63215.6+3.2
Liberal Democrats Paul De Kort57114.1+1.4
Majority1,191
Turnout 73.2
Conservative hold Swing

Harpenden North

Harpenden North
PartyCandidateVotes%±%
Conservative Albert Pawle 2,179 53.7 +7.8
Independent John Chambers56513.9-1.5
Labour Linda Spiri52412.9-1.1
Liberal Democrats Aileen King46711.5+0.1
Green William Day3248.0N/A
Majority1,614
Turnout 75.6
Conservative hold Swing

Harpenden South

Harpenden South
PartyCandidateVotes%±%
Conservative Brian Ellis 2,756 66.4 -6.5
Labour George Fraser60014.5+0.2
Liberal Democrats Gillian Tattersfield50312.1-0.7
Independent John Hansen2937.1N/A
Majority2,156
Turnout 77.2
Conservative hold Swing

Harpenden West

Harpenden West
PartyCandidateVotes%±%
Conservative Daniel Chichester-Miles 2,670 60.9 -6.7
Labour Co-op David Lawlor63314.4-2.6
Liberal Democrats Jeffrey Phillips58213.3-2.1
Independent Paul Howe49611.3N/A
Majority2,037
Turnout 75.5
Conservative hold Swing

London Colney

London Colney
PartyCandidateVotes%±%
Conservative Simon Calder 1,882 38.9 +7.0
Labour Jacob Quagliozzi1,73735.9-4.0
UKIP Colin Botterill58712.1-6.7
Liberal Democrats Matthew Farrell4349.0+4.3
Green Anna Kinnersley1984.1-0.5
Majority145
Turnout 67.4
Conservative gain from Labour Swing

Marshalswick North

Marshalswick North
PartyCandidateVotes%±%
Conservative Carolyn Bolton 1,443 37.5 +9.1
Liberal Democrats Geoffrey Churchard1,32634.5-1.9
Labour Richard Harris48512.6+2.0
UKIP Michael Hollins3378.8-8.4
Green James Lomas2566.7-0.6
Majority117
Turnout 75.8
Conservative gain from Liberal Democrats Swing

Marshalswick South

Marshalswick South
PartyCandidateVotes%±%
Conservative Salih Gaygusuz 1,915 44.5 +5.9
Liberal Democrats Mark Pedroz1,05524.5+5.2
Labour Vivienne Windle72116.8-5.9
Green Miriam Gilbert3919.1-1.1
UKIP David Dickson2175.0-4.2
Majority860
Turnout 80
Conservative hold Swing

Park Street

Park Street
PartyCandidateVotes%±%
Conservative Paul Wright 1,519 37.2 +10.5
Liberal Democrats Jadwiga Baillie1,20329.4-10.7
UKIP Paul Tilyard59314.5-5.8
Labour Co-op Martin McGrath58714.4+5.0
Green Lesley Baker1854.5+1.0
Majority316
Turnout 71.4
Conservative hold Swing

Redbourn

Redbourn
PartyCandidateVotes%±%
Conservative Paul Wright 2,075 58.2 -4.2
Labour Nicholas Pullinger54115.2-3.8
UKIP Daragh Cahalane40011.2N/A
Liberal Democrats Michael Morton3379.5-0.4
Green Joseph French2105.9-2.9
Majority1,534
Turnout 72.9
Conservative hold Swing

Sandridge

Sandridge
PartyCandidateVotes%±%
Conservative Frances Leonard 1,703 58.2 +12.1
Liberal Democrats Stefania Estacchini50117.1+2.2
Labour Michael Gary-Higgings41514.2+2.3
Green Paul Quinn30510.4+1.5
Majority1,202
Turnout 76.7
Conservative hold Swing

Sopwell

Sopwell
PartyCandidateVotes%±%
Labour Eileen Harris 1,347 34.7 +0.1
Liberal Democrats David Poor1,05527.2-6.1
Conservative Panagiotis Yfantoudas88022.7+10.0
UKIP Valerie Hargrave3158.1-4.5
Green Gail Jackson2827.3+0.5
Majority292
Turnout 72.3
Labour hold Swing

St Peters

St Peters
PartyCandidateVotes%±%
Conservative Alexander Campbell 1,634 35.6 +10.0
Liberal Democrats Matthew Jones1,25027.2+3.2
Labour Alexander Veitch77816.9-3.8
Green Jill Mills74116.1-7.5
UKIP Michael Douglas1914.2-1.9
Majority384
Turnout 73.0
Conservative hold Swing

St Stephen

St Stephen
PartyCandidateVotes%±%
Conservative David Winstone 2,078 50.3 +13.1
Liberal Democrats Alison Ross92022.3+2.4
UKIP Peter Whitehead52712.8-12.1
Labour Janet Blackwell44210.7+1.5
Green Lydia El-Khouri1633.9-4.0
Majority1,158
Turnout 76.7
Conservative hold Swing

Verulam

Verulam
PartyCandidateVotes%±%
Conservative Jessica Chivers 2,183 48.0 +14.0
Liberal Democrats Trisha Windsor-Williams1,29828.5-9.3
Labour Co-op Michael Bartlet53311.7+3.0
Green Mark Ewington2826.2-1.7
UKIP Colin Donald2525.5-6.1
Majority885
Turnout 82.3
Conservative hold Swing

Wheathampstead

Wheathampstead
PartyCandidateVotes%±%
Conservative Sandra Wood 2,244 60.2 +8.8
Liberal Democrats Harriet Sherlock74620.0-0.9
Labour Co-op Gavin Ross45612.2+2.7
Green Ian Troughton2837.6-7.9
Majority1,498
Turnout 75.3
Conservative hold Swing

Related Research Articles

<span class="mw-page-title-main">St Albans City and District</span> Local authority district in England

St Albans, also known as the City and District of St Albans, is a local government district with city status in Hertfordshire, England. Its council is based in St Albans, the largest settlement in the district. The district also includes the town of Harpenden and several villages. The district borders North Hertfordshire, Welwyn Hatfield, Hertsmere, Watford, Three Rivers, Dacorum, and Central Bedfordshire.

<span class="mw-page-title-main">St Albans (UK Parliament constituency)</span> Parliamentary constituency in the United Kingdom, 1801-1852 & 1885 onwards

St Albans is a constituency represented in the House of Commons of the UK Parliament since 2019 by Daisy Cooper, a Liberal Democrat.

<span class="mw-page-title-main">Hitchin and Harpenden (UK Parliament constituency)</span> Parliamentary constituency in the United Kingdom, 1997 onwards

Hitchin and Harpenden is a constituency represented in the House of Commons of the UK Parliament since 2017 by Bim Afolami, a Conservative.

St Albans City and District Council elections are held three years out of every four to elect members of St Albans City and District Council in Hertfordshire, England. Since the last boundary changes in 2022 the council has comprised 56 councillors, with the district being divided into 20 wards. Elections to Hertfordshire County Council are held in the fourth year of the cycle when there are no district council elections.

<span class="mw-page-title-main">2008 St Albans City and District Council election</span>

The 2008 St Albans City and District Council election took place on 1 May 2008 to elect members of St Albans District Council in Hertfordshire, England. One third of the council was up for election and the Liberal Democrats gained overall control of the council from no overall control.

The 1998 St Albans City and District Council election took place on 7 May 1998 to elect members of St Albans City and District Council in Hertfordshire, England. One third of the council was up for election and the Liberal Democrats stayed in overall control of the council.

<span class="mw-page-title-main">1999 St Albans City and District Council election</span>

The 1999 St Albans City and District Council election took place on 6 May 1999 to elect members of St Albans City and District Council in Hertfordshire, England. The whole council was up for election with boundary changes since the last election in 1998 increasing the number of seats by 1. The Liberal Democrats lost overall control of the council to no overall control.

<span class="mw-page-title-main">2000 St Albans City and District Council election</span>

The 2000 St Albans City and District Council election took place on 4 May 2000 to elect members of St Albans District Council in Hertfordshire, England. One third of the council was up for election and the council stayed under no overall control.

<span class="mw-page-title-main">2002 St Albans City and District Council election</span>

The 2002 St Albans City and District Council election took place on 2 May 2002 to elect members of St Albans District Council in Hertfordshire, England. One third of the council was up for election and the council stayed under no overall control.
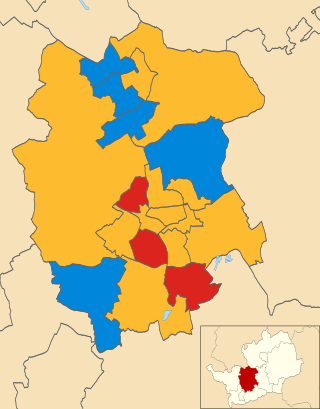
<span class="mw-page-title-main">2003 St Albans City and District Council election</span>

The 2003 St Albans City and District Council election took place on 1 May 2003 to elect members of St Albans District Council in Hertfordshire, England. One third of the council was up for election and the council stayed under no overall control.

<span class="mw-page-title-main">2004 St Albans City and District Council election</span>

The 2004 St Albans City and District Council election took place on 10 June 2004 to elect members of St Albans District Council in Hertfordshire, England. One third of the council was up for election and the council stayed under no overall control.
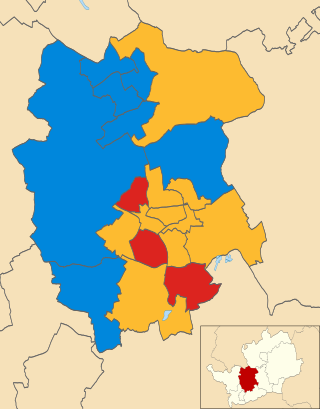
<span class="mw-page-title-main">2007 St Albans City and District Council election</span>

The 2007 St Albans City and District Council election took place on 3 May 2007 to elect members of St Albans District Council in Hertfordshire, England. One third of the council was up for election and the Liberal Democrats lost overall control of the council to no overall control.

<span class="mw-page-title-main">2010 St Albans City and District Council election</span>

The 2010 St Albans City and District Council election took place on 6 May 2010 to elect members of St Albans District Council in Hertfordshire, England. One third of the council was up for election and the Liberal Democrats stayed in overall control of the council.

<span class="mw-page-title-main">2012 St Albans City and District Council election</span> 2012 UK local government election

The 2012 St Albans City and District Council election took place on 3 May 2012 to elect members of St Albans District Council in Hertfordshire, England. One third of the council was up for election and the council stayed under no overall control.

<span class="mw-page-title-main">2011 St Albans City and District Council election</span>

The 2011 St Albans City and District Council election took place on 5 May 2011 to elect members of St Albans District Council in Hertfordshire, England. One third of the council was up for election and the Liberal Democrats lost overall control of the council to no overall control.

<span class="mw-page-title-main">2014 St Albans City and District Council election</span>

The 2014 St Albans City and District Council election took place on 22 May 2014 to elect members of St Albans District Council in Hertfordshire, England. One third of the council was up for election and the council stayed under no overall control.
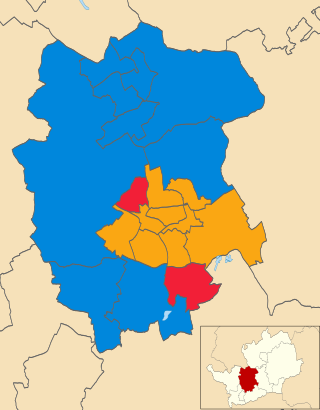
<span class="mw-page-title-main">2018 St Albans City and District Council election</span>

The 2018 St Albans City and District Council election took place on 3 May 2018 to elect members of St Albans City and District Council in England. This was on the same day as other local elections.

<span class="mw-page-title-main">2019 St Albans City and District Council election</span> Election

The 2019 St Albans City and District Council election took place on 2 May 2019 to elect members of St Albans City and District Council in England. This was on the same day as other local elections. At the elections, the Conservatives lost control of the council

<span class="mw-page-title-main">Daisy Cooper</span> Deputy Leader of the Liberal Democrats

Daisy Cooper is a British Liberal Democrat politician who has served as the Member of Parliament (MP) for St Albans since 2019. She has served as the Deputy Leader of the Liberal Democrats since 2020, and as the Liberal Democrat spokesperson for Health, Wellbeing and Social Care since 2021.

<span class="mw-page-title-main">2021 St Albans City and District Council election</span> Election

The 2021 St Albans City and District Council election took place on 6 May 2021, delayed by one year due to the COVID-19 pandemic, to elect members of St Albans City and District Council in England. This was on the same day as other local elections. At the elections, the Liberal Democrats achieved a majority for the first time since 2011 and took the council back from no overall control.

References

  1. "Upcoming elections & referendums". The Electoral Commission. Archived from the original on 15 March 2015. Retrieved 24 April 2015.
  2. "St Albans City & District Council - 07th May 2015 District Council Election Results". Archived from the original on 27 June 2015. Retrieved 22 June 2021.