| |||||||||||||||||||||||||||||||||
17 of 49 seats on North Hertfordshire District Council 25 seats needed for a majority | |||||||||||||||||||||||||||||||||
---|---|---|---|---|---|---|---|---|---|---|---|---|---|---|---|---|---|---|---|---|---|---|---|---|---|---|---|---|---|---|---|---|---|
| |||||||||||||||||||||||||||||||||
|
The 2021 North Hertfordshire District Council election took place on 6 May 2021 to elect 17 of the 49 members of North Hertfordshire District Council in England. [1] This was on the same day as other local elections around the country. This election had originally been due to take place in May 2020, but was postponed due to the COVID-19 pandemic.
The council remained under no overall control, with a Labour and Liberal Democrat coalition continuing to run the council. Martin Stears-Handscomb, leader of the Labour group and leader of the council prior to the election, lost his seat at this election; he had chosen to contest Letchworth South East rather than the Hitchin Oughton seat he had previously held, which put him directly challenging the Conservative leader, David Levett, who retained the seat. [2] Elizabeth Dennis-Harburg was appointed new leader of the Labour group and leader of the council after the election, with the Liberal Democrat leader, Paul Clark, continuing to serve as deputy leader of the council. [3]
The overall results were as follows: [4]
2021 North Hertfordshire District Council election | ||||||||||
---|---|---|---|---|---|---|---|---|---|---|
Party | This election | Full council | This election | |||||||
Seats | Net | Seats % | Other | Total | Total % | Votes | Votes % | +/− | ||
Conservative | 10 | 1 | 58.8 | 13 | 23 | 46.9 | 14,518 | 41.5 | +5.5 | |
Labour | 5 | 1 | 29.4 | 10 | 15 | 30.6 | 9,402 | 26.9 | +5.1 | |
Liberal Democrats | 2 | 11.8 | 9 | 11 | 22.4 | 6,978 | 20.0 | -8.4 | ||
Green | 0 | 0.0 | 0 | 0 | 0.0 | 3,730 | 10.7 | +0.1 | ||
Independent | 0 | 0.0 | 0 | 0 | 0.0 | 167 | 0.5 | New | ||
Reform UK | 0 | 0.0 | 0 | 0 | 0.0 | 59 | 0.2 | New | ||
CPA | 0 | 0.0 | 0 | 0 | 0.0 | 53 | 0.2 | New | ||
SDP | 0 | 0.0 | 0 | 0 | 0.0 | 39 | 0.1 | New | ||
The results for each ward were as follows. Where the previous incumbent was standing for re-election they are marked with an asterisk(*). A double dagger(‡) indicates a sitting councillor contesting a different ward. [4]
Party | Candidate | Votes | % | ±% | |
---|---|---|---|---|---|
Conservative | Juan Timothy Cowell | 495 | 42.9 | -3.0 | |
Liberal Democrats | Richard William Winter | 302 | 26.2 | -0.3 | |
Labour | Leo James Chapman | 212 | 18.4 | +6.6 | |
Green | Jane Louise Turner | 133 | 11.5 | +6.9 | |
Majority | 193 | 16.7 | |||
Turnout | 1,154 | 49.4 | +4.2 | ||
Conservative hold | Swing | -1.3 | |||
Changes from the 2016 election.
Party | Candidate | Votes | % | ±% | |
---|---|---|---|---|---|
Conservative | Michael Edwin Weeks* | 1,120 | 48.0 | -3.4 | |
Labour Co-op | Alistair Kieran Oliver Willoughby | 734 | 31.4 | +13.9 | |
Liberal Democrats | Steven Paul Thomas (Steve Thomas) | 242 | 10.4 | -8.7 | |
Green | Timothy Peter Lee (Tim Lee) | 223 | 9.6 | -1.4 | |
Majority | 386 | 16.5 | |||
Turnout | 2,335 | 40.6 | +8.6 | ||
Conservative hold | Swing | -8.7 | |||
Party | Candidate | Votes | % | ±% | |
---|---|---|---|---|---|
Liberal Democrats | Terence Clive Tyler* (Terry Tyler) | 728 | 42.3 | +18.5 | |
Conservative | Dominic John Crean Griffiths | 727 | 42.2 | +0.3 | |
Labour | Thomas Patrick Luke Hogan (Tom Hogan) | 251 | 14.6 | -1.4 | |
Majority | 1 | 0.1 | |||
Turnout | 1,721 | 32.6 | +5.2 | ||
Liberal Democrats hold | Swing | +9.1 | |||
The result was initially a tie, with Terry Tyler (Liberal Democrat) and Dominic Griffiths (Conservative) both receiving 727 votes; they drew straws for an extra tie-break vote. [5]
Party | Candidate | Votes | % | ±% | |
---|---|---|---|---|---|
Labour Co-op | Ian Clive Albert* | 1,314 | 49.0 | -4.7 | |
Conservative | Ralph Gerald Muncer | 586 | 21.9 | +6.6 | |
Green | Anni Elke Sander | 383 | 14.3 | +0.6 | |
Liberal Democrats | Jonathan Clayden | 378 | 14.1 | -2.2 | |
Majority | 728 | 27.2 | |||
Turnout | 2,681 | 41.6 | +7.2 | ||
Labour Co-op hold | Swing | -5.7 | |||
Party | Candidate | Votes | % | ±% | |
---|---|---|---|---|---|
Liberal Democrats | Paul Clark* | 1,416 | 48.1 | -14.1 | |
Conservative | Gulshan Deep Singh Mangat | 820 | 27.9 | +7.2 | |
Labour | Angela Jean Griggs | 412 | 14.0 | +4.6 | |
Green | Deolinda Maria Eltringham | 242 | 8.2 | +1.2 | |
CPA | Leigh Smith | 33 | 1.1 | New | |
Majority | 596 | 20.3 | |||
Turnout | 2,941 | 46.9 | +5.0 | ||
Liberal Democrats hold | Swing | -10.6 | |||
Party | Candidate | Votes | % | ±% | |
---|---|---|---|---|---|
Labour Co-op | Nigel David Mason | 501 | 38.6 | -15.6 | |
Conservative | Steven Patmore | 369 | 28.4 | -0.2 | |
Green | Mary Karin Marshall | 245 | 18.9 | +11.3 | |
Liberal Democrats | Thomas James Grunshaw | 101 | 7.8 | -1.4 | |
Independent | Jacqueline Mary McDonald | 65 | 5.0 | New | |
Majority | 132 | 10.2 | |||
Turnout | 1,298 | 35.0 | +3.7 | ||
Labour Co-op hold | Swing | -7.7 | |||
Changes from the 2018 election.
Party | Candidate | Votes | % | ±% | |
---|---|---|---|---|---|
Conservative | Richard Arthur Charles Thake* | 787 | 41.8 | +0.9 | |
Liberal Democrats | Rajeni Bhakar (Raj Bhakar) | 548 | 29.1 | -2.6 | |
Labour | Peter Malcolm Taylor | 286 | 15.2 | -3.9 | |
Green | Desmond Peter Stephens (Des Stephens) | 233 | 12.4 | +4.7 | |
CPA | Sidney Clifford Cordle (Sid Cordle) | 20 | 1.1 | New | |
Majority | 239 | 12.7 | |||
Turnout | 1,885 | 49.5 | +4.0 | ||
Conservative hold | Swing | +1.8 | |||
Changes from the 2018 election.
Party | Candidate | Votes | % | ±% | |
---|---|---|---|---|---|
Labour Co-op | Elizabeth Louise Dennis-Harburg* | 1,154 | 41.2 | -3.2 | |
Conservative | Charles Laing | 1,042 | 37.2 | +11.7 | |
Liberal Democrats | Elizabeth Julie Townsend (Liz Townsend) | 301 | 10.7 | -0.6 | |
Green | Samuel Rex Larsen (Sam Larsen) | 293 | 10.5 | -7.1 | |
Majority | 112 | 4.0 | |||
Turnout | 2,802 | 44.5 | +7.4 | ||
Labour Co-op hold | Swing | -7.5 | |||
Party | Candidate | Votes | % | ±% | |
---|---|---|---|---|---|
Conservative | Claire Patricia Annette Strong* | 1,436 | 52.2 | -2.5 | |
Green | Adina Claire | 787 | 28.6 | +11.5 | |
Labour | Anton Jungreuthmayer | 304 | 11.1 | -1.3 | |
Liberal Democrats | Philippa Wright | 214 | 7.8 | -6.7 | |
Majority | 649 | 23.6 | |||
Turnout | 2,751 | 46.4 | +10.3 | ||
Conservative hold | Swing | -7.0 | |||
Party | Candidate | Votes | % | ±% | |
---|---|---|---|---|---|
Conservative | Amanda Benhilda Tandi (Mandi Tandi) | 1,235 | 56.5 | +16.9 | |
Liberal Democrats | Susana Muñoz Maniega | 629 | 28.8 | -22.3 | |
Labour | Douglas Arthur Jenner (Doug Jenner) | 185 | 8.5 | +0.9 | |
Green | Davina Ruth Malcolm | 97 | 4.4 | +2.9 | |
Majority | 606 | 27.7 | |||
Turnout | 2,187 | 52.1 | +5.1 | ||
Conservative hold | Swing | +19.6 | |||
Changes from the 2018 election.
Party | Candidate | Votes | % | ±% | |
---|---|---|---|---|---|
Labour Co-op | Ian Mantle* | 711 | 44.2 | -7.2 | |
Conservative | James Durston | 467 | 29.0 | +4.2 | |
Green | David Paul Morris | 205 | 12.7 | +8.0 | |
Liberal Democrats | Mark Robert Patrick Spencer | 115 | 7.2 | -0.5 | |
Independent | Paul Ross | 102 | 6.3 | -4.4 | |
Majority | 244 | 15.2 | |||
Turnout | 1,608 | 35.9 | +1.0 | ||
Labour Co-op hold | Swing | -5.7 | |||
Changes from the 2018 election.
Party | Candidate | Votes | % | ±% | |
---|---|---|---|---|---|
Conservative | Simon Nicholas Bloxham | 1,059 | 47.7 | +9.8 | |
Labour Co-op | Sean Nolan | 733 | 33.0 | +2.8 | |
Green | Elizabeth Susan Hancock | 215 | 9.7 | +0.5 | |
Liberal Democrats | Amy Elizabeth Finch | 200 | 9.0 | -1.0 | |
Majority | 326 | 14.7 | |||
Turnout | 2,222 | 39.4 | +5.0 | ||
Conservative gain from Labour Co-op | Swing | +3.5 | |||
Party | Candidate | Votes | % | ±% | |
---|---|---|---|---|---|
Conservative | David Charles Levett* | 966 | 46.1 | +3.5 | |
Labour Co-op | Martin John Stears-Handscomb ‡ | 726 | 34.7 | -8.6 | |
Liberal Democrats | Paul Anthony James Marment | 175 | 8.4 | New | |
Green | Hazel Tracy Middleton | 155 | 7.4 | New | |
Reform UK | Garry Edward Warren | 59 | 2.8 | New | |
Majority | 240 | 11.5 | |||
Turnout | 2,094 | 39.0 | +0.1 | ||
Conservative hold | Swing | +6.1 | |||
Party | Candidate | Votes | % | ±% | |
---|---|---|---|---|---|
Conservative | Terence William Hone* (Terry Hone) | 1,276 | 45.8 | +11.2 | |
Liberal Democrats | Phillip Christopher Weeder (Phil Weeder) | 724 | 26.0 | -8.6 | |
Labour Co-op | Thomas Joseph Plater (Tom Plater) | 474 | 17.0 | +4.9 | |
Green | Alan Edmund Borgars | 245 | 8.8 | +0.1 | |
SDP | Michael McGetrick | 39 | 1.4 | New | |
Majority | 552 | 19.8 | |||
Turnout | 2,787 | 46.0 | +7.1 | ||
Conservative hold | Swing | +9.9 | |||
Party | Candidate | Votes | % | ±% | |
---|---|---|---|---|---|
Labour Co-op | Amy Dawn Allen | 771 | 53.1 | -4.9 | |
Conservative | Monica Madeline Bloxham | 536 | 36.9 | +10.2 | |
Liberal Democrats | Sally Margaret Jarvis (Sal Jarvis) | 121 | 8.3 | +3.3 | |
Majority | 235 | 16.2 | |||
Turnout | 1,452 | 36.1 | -1.6 | ||
Labour Co-op hold | Swing | -7.6 | |||
Changes from the 2018 election.
This Letchworth Wilbury seat had been previously held by Labour councillor Deepak Sangha, but had been vacant since his resignation in March 2020, but no by-election could be held due to the COVID-19 pandemic. [6]
Party | Candidate | Votes | % | ±% | |
---|---|---|---|---|---|
Conservative | Adam Compton | 889 | 49.0 | +1.7 | |
Liberal Democrats | Alexander William Prosser-Snelling (Alex Prosser-Snelling) | 579 | 31.9 | +8.9 | |
Labour | John Ivor Rees | 176 | 9.7 | -0.2 | |
Green | Hugh David Parker | 154 | 8.5 | -1.0 | |
Majority | 310 | 17.1 | |||
Turnout | 1,816 | 42.8 | +6.9 | ||
Conservative hold | Swing | -3.6 | |||
The Royston Meridian by-election was triggered by the resignation of Conservative councillor Bill Davidson.
Party | Candidate | Votes | % | ±% | |
---|---|---|---|---|---|
Conservative | Sarah Anne Dingley | 708 | 47.0 | +9.2 | |
Labour Co-op | Catherine Jayne Brownjohn (Cathy Brownjohn) | 458 | 30.4 | -2.7 | |
Liberal Democrats | Hugo John Rainey | 205 | 13.6 | -0.8 | |
Green | Steven Andrew Turner | 120 | 8.0 | -5.6 | |
Majority | 250 | 16.6 | |||
Turnout | 1,507 | 34.3 | +5.7 | ||
Conservative hold | Swing | +5.9 | |||
The Royston Palace by-election had been triggered by the resignation of Conservative councillor Ben Lewis, who had resigned in March 2020, but no by-election could be held until 2021 due to the COVID-19 pandemic. [6]
The Hitchin Highbury by-election was triggered by the death of Liberal Democrat councillor Paul Clark, who was his party's group leader and deputy leader of the council. [7] The Liberal Democrats retained the seat. Ruth Brown was appointed new leader of the Liberal Democrat group and deputy leader of the council following Paul Clark's death. [8]
Party | Candidate | Votes | % | ±% | |
---|---|---|---|---|---|
Liberal Democrats | Raj Bhakar | 1,238 | 67.0 | +18.5 | |
Conservative | Samuel Forsyth | 450 | 24.3 | -3.7 | |
Green | Deolinda Eltringham | 134 | 7.2 | -1.0 | |
CPA | Leigh Smith | 27 | 1.5 | +0.3 | |
Majority | 788 | 42.7 | |||
Turnout | 1,861 | 30.0 | |||
Liberal Democrats hold | Swing | +11.1 | |||
North Hertfordshire is one of ten local government districts in the county of Hertfordshire, England. Its council is based in Letchworth Garden City and the largest town is Hitchin. The district also includes the towns of Baldock and Royston and numerous villages and surrounding rural areas. Part of the district lies within the Chiltern Hills, a designated Area of Outstanding Natural Beauty.
Hertfordshire County Council in England is elected every four years. Since the last boundary changes took effect in 2017 there have been 78 electoral divisions electing one councillor each.
Hitchin was a parliamentary constituency in Hertfordshire which returned one Member of Parliament (MP) to the House of Commons of the Parliament of the United Kingdom from 1885 until it was abolished for the 1983 general election.
The 2012 North Hertfordshire Council election was held on 3 May 2012, at the same time as other local elections across England, Scotland and Wales. Of the 49 seats on North Hertfordshire District Council, 15 were up for election.
The 2015 North Hertfordshire Council election was held on 5 May 2016, at the same time as other local elections across England. Of the 49 seats on North Hertfordshire District Council, 15 were up for election.
The 2019 North Hertfordshire Council election was held on 2 May 2019, at the same time as other local elections across England and Northern Ireland. Of the 49 seats on North Hertfordshire District Council, 16 were up for election.
The 2018 North Hertfordshire Council election was held on 3 May 2018, at the same time as other local elections across England. Of the 49 seats on North Hertfordshire District Council, 19 were up for election, being the usual third of the council plus a by-election in Letchworth Grange ward.
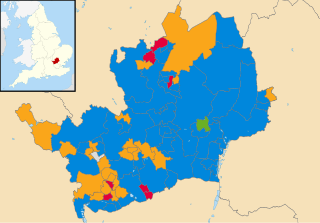
Elections to Hertfordshire County Council took place on 6 May 2021 alongside other local elections in the United Kingdom. All 78 seats to the council were elected.
The 2022 North Hertfordshire District Council election took place on 5 May 2022 to elect 18 of the 49 members of North Hertfordshire District Council in England. This was on the same day as other local elections around the country. The council remained under no overall control, with a Labour and Liberal Democrat coalition continuing to run the council. The leader of the council remained the Labour group leader, Elizabeth Dennis-Harburg, and the deputy leader of the council remained the Liberal Democrat group leader, Ruth Brown.
The 2007 North Hertfordshire District Council election was held on 3 May 2007, at the same time as other local elections across England and Scotland. All 49 seats on North Hertfordshire District Council were up for election following changes to ward boundaries. Labour and the Liberal Democrats (UK) both increased their number of seats, but the Conservatives retained their majority on the council. The Conservative leader, F. John Smith, remained leader of the council after the election.
The 2010 North Hertfordshire Council election was held on 6 May 2010, at the same time as other local elections across England and the general election. Of the 49 seats on North Hertfordshire District Council, 19 were up for election, being the usual third of seats plus a by-election in Royston Palace ward.
The 1973 North Hertfordshire District Council election was held on 7 June 1973. It was the first election to North Hertfordshire District Council, and was held at the same time as other local elections across England for the new non-metropolitan district councils that were created under the Local Government Act 1972. The elected councillors initially formed a shadow authority to oversee the transition to the new system, operating alongside the five outgoing district councils until 1 April 1974 when the new district formally came into being.
The 1976 North Hertfordshire District Council election was held on 6 May 1976, at the same time as other local elections across England and Wales. All 48 seats on North Hertfordshire District Council were up for election.
The 1984 North Hertfordshire District Council election was held on 3 May 1984, at the same time as other local elections across England and Scotland. There were 17 out of 50 seats on North Hertfordshire District Council up for election, being the usual third of the council.
The 1988 North Hertfordshire District Council election was held on 5 May 1988, at the same time as other local elections across England and Scotland. There were 18 out of 50 seats on North Hertfordshire District Council up for election, being the usual third of the council plus a by-election in Codicote ward.
The 1992 North Hertfordshire District Council election was held on 7 May 1992, at the same time as other local elections across England and Scotland. There were 17 out of 50 seats on North Hertfordshire District Council up for election, being the usual third of the council.
The 1994 North Hertfordshire District Council election was held on 5 May 1994, at the same time as other local elections across England and Scotland. There were 16 out of 50 seats on North Hertfordshire District Council up for election, being the usual third of the council.
The 1995 North Hertfordshire District Council election was held on 4 May 1995, at the same time as other local elections across England and Wales. There were 17 out of 50 seats on North Hertfordshire District Council up for election, being the usual third of the council.
The 1996 North Hertfordshire District Council election was held on 2 May 1996, at the same time as other local elections across England. There were 18 out of 50 seats on North Hertfordshire District Council up for election, being the usual third of the council plus a by-election in Hitchin Oughton ward.
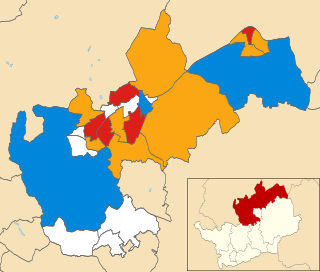
The 2023 North Hertfordshire District Council election took place on 4 May 2023 to elect members of North Hertfordshire District Council in Hertfordshire, England. This was on the same day as other local elections across England. The council remained under no overall control.