1995 St Albans City and District Council election

Last updated

The 1995 St Albans City and District Council election took place on 4 May 1995 to elect members of St Albans City and District Council in England. [1] This was on the same day as other local elections.

Contents

Election result

1995 St Albans City and District Council election
PartyThis electionFull councilThis election
SeatsNetSeats %OtherTotalTotal %VotesVotes %+/−
  Liberal Democrats 13Increase2.svg568.4213459.616,65441.8-8.0
  Conservative 2Decrease2.svg 610.5111322.810,37926.0+2.9
  Labour 4Increase2.svg 121.161017.512,45931.2+5.9
  Independent 0Steady2.svg 00.0000.02410.6-0.2
  Green 0Steady2.svg 00.0000.01240.3-0.7
  Natural Law 0Steady2.svg 00.0000.0270.1New

Ward results

Ashley

Ashley
PartyCandidateVotes%±%
Labour M. Pakenham 1,059 45.6 +10.2
Liberal Democrats C. Bradley97441.9–9.8
Conservative D. Caroline28912.4–0.5
Majority853.7N/A
Turnout 2,32246.8–5.4
Registered electors 4,965
Labour gain from Liberal Democrats Swing Increase2.svg10.0

Batchwood

Batchwood
PartyCandidateVotes%±%
Labour A. Rose* 1,284 66.5 +5.9
Liberal Democrats R. Law37119.2–5.2
Conservative R. Langham22911.9–3.0
Green A. Cripps472.4N/A
Majority91347.3+11.1
Turnout 1,93140.4–4.8
Registered electors 4,781
Labour hold Swing Increase2.svg5.6

Clarence

Clarence
PartyCandidateVotes%±%
Liberal Democrats J. Lusby 1,000 53.7 –7.8
Labour D. Pratley51527.7+9.3
Conservative J. Christie34718.6+1.8
Majority48526.0–17.1
Turnout 1,86243.0–7.4
Registered electors 4,332
Liberal Democrats hold Swing Decrease2.svg8.6

Cunningham

Cunningham
PartyCandidateVotes%±%
Liberal Democrats R. Donald* 1,142 55.0 –5.7
Labour A. Gilson65331.4+6.6
Conservative M. Elsdon28213.6–0.9
Majority48923.5–12.4
Turnout 2,07743.7–3.5
Registered electors 4,758
Liberal Democrats hold Swing Decrease2.svg6.2

Harpenden East

Harpenden East
PartyCandidateVotes%±%
Liberal Democrats P. Waddilove 1,095 50.1 –10.1
Conservative D. Fisher63028.8+2.0
Labour D. Crew46221.1+8.1
Majority46521.3–12.1
Turnout 2,18743.7–8.0
Registered electors 5,009
Liberal Democrats hold Swing Decrease2.svg6.1

Harpenden North

Harpenden North
PartyCandidateVotes%±%
Liberal Democrats T. Glenister 1,052 46.1 –6.3
Conservative A. Pawle72931.9–1.1
Labour E. Rayner47420.8+6.2
Natural Law P. Saunders271.2N/A
Majority32314.2–5.3
Turnout 2,28239.4–6.3
Registered electors 5,792
Liberal Democrats gain from Conservative Swing Increase2.svg2.6

Harpenden South

Harpenden South
PartyCandidateVotes%±%
Conservative P. Johnston* 1,058 43.7 +1.9
Liberal Democrats G. Mitchell1,01541.9–6.9
Labour K. Holmes34714.3+4.9
Majority431.8N/A
Turnout 2,42046.0–6.1
Registered electors 5,256
Conservative hold Swing Increase2.svg4.4

Harpenden West

Harpenden West
PartyCandidateVotes%±%
Conservative D. Coe* 1,116 48.6 +4.8
Liberal Democrats A. Steer87538.1–7.2
Labour J. Thompson30613.3+2.4
Majority24110.5N/A
Turnout 2,29744.9–2.0
Registered electors 5,121
Conservative hold Swing Increase2.svg6.0

London Colney

London Colney
PartyCandidateVotes%±%
Labour E. Gordon* 1,380 74.8 +6.5
Liberal Democrats K. Lambert20711.2–1.0
Conservative M. Shaw1809.8–5.8
Green M. Gibson774.2+0.3
Majority1,17363.6+10.9
Turnout 1,84432.5–8.0
Registered electors 5,667
Labour hold Swing Increase2.svg3.8

Marshallwick North

Marshallwick North
PartyCandidateVotes%±%
Liberal Democrats T. Clegg 1,220 60.5 –5.6
Conservative V. Holley42721.2+1.3
Labour W. Preston37118.4+4.4
Majority79339.3–7.0
Turnout 2,01842.6–6.0
Registered electors 4,741
Liberal Democrats hold Swing Decrease2.svg3.5

Marshallwick South

Marshallwick South
PartyCandidateVotes%±%
Liberal Democrats P. Burton* 1,240 52.3 –5.4
Conservative P. Farley62526.4+2.7
Labour M. Ewington50421.3+5.9
Majority61526.0–8.0
Turnout 2,36945.7–7.7
Registered electors 5,187
Liberal Democrats hold Swing Decrease2.svg4.1

No Green candidate as previous (3.2%).

Park Street

Park Street
PartyCandidateVotes%±%
Liberal Democrats K. Finley* 893 55.4 –5.8
Labour M. Morley42926.6+6.2
Conservative I. Gibb28917.9–0.5
Majority46428.8–12.0
Turnout 1,61136.4–4.5
Registered electors 4,420
Liberal Democrats hold Swing Decrease2.svg6.0

Redbourn

Redbourn
PartyCandidateVotes%±%
Liberal Democrats E. Humbles 776 41.8 –26.3
Conservative B. Chapman*71438.4N/A
Labour M. Brennan36719.8+6.7
Majority623.3–46.0
Turnout 1,85741.7–1.6
Registered electors 4,446
Liberal Democrats gain from Conservative Swing N/A

No Independent candidate as previous (18.8%).

Sandridge

Sandridge
PartyCandidateVotes%±%
Liberal Democrats W. Morris 641 38.6 +22.9
Conservative C. Whiteside*51430.9–15.6
Labour A. Cooper30818.5+8.6
Independent B. Filmer19912.0–13.7
Majority1277.6N/A
Turnout 1,66243.0–1.6
Registered electors 3,865
Liberal Democrats gain from Conservative Swing Increase2.svg19.3

Sopwell

Sopwell
PartyCandidateVotes%±%
Labour M. Wilson 1,498 76.0 +9.9
Liberal Democrats I. Fowler25512.9–9.9
Conservative G. Brown21711.0–0.1
Majority1,24363.1+19.8
Turnout 1,97038.8–4.4
Registered electors 5,074
Labour hold Swing Steady2.svg0.0

St. Peters

St. Peters
PartyCandidateVotes%±%
Liberal Democrats J. Gunner* 1,005 47.8 –5.9
Labour L. Warren87641.7+10.5
Conservative L. Harris22210.6–0.7
Majority1296.1–16.4
Turnout 2,10343.2–6.1
Registered electors 4,868
Liberal Democrats hold Swing Decrease2.svg8.2

No Green candidate as previous (3.8%).

St. Stephens

St. Stephens
PartyCandidateVotes%±%
Liberal Democrats J. Baillie 1,006 42.1 –3.9
Conservative A. Nowell*79833.4–0.5
Labour P. Allen58524.5+4.5
Majority2088.7–3.4
Turnout 2,38940.1–8.2
Registered electors 5,963
Liberal Democrats gain from Conservative Swing Decrease2.svg1.7

Verulam

Verulam
PartyCandidateVotes%±%
Liberal Democrats K. Morris 977 38.9 –1.4
Conservative J. Smith*95738.1+5.7
Labour J. Bellchambers53721.4–1.7
Independent A. Brown421.7N/A
Majority200.8–7.1
Turnout 2,51348.2–4.9
Registered electors 5,219
Liberal Democrats gain from Conservative Swing Decrease2.svg3.6

No Green candidate as previous (4.2%).

Wheathampstead

Wheathampstead
PartyCandidateVotes%±%
Liberal Democrats G. Webster 910 41.9 –14.7
Conservative D. Hills*75634.8+4.0
Labour P. Woodhams50423.2+10.7
Majority1547.1–18.7
Turnout 2,17045.7–8.1
Registered electors 4,744
Liberal Democrats gain from Conservative Swing Decrease2.svg9.4

Related Research Articles

<span class="mw-page-title-main">St Albans City and District</span> Local authority district in England

St Albans, commonly known as the City and District of St Albans, is a local government district with city status in Hertfordshire, England. Its council is based in St Albans, the largest settlement in the district. The district also includes the town of Harpenden and several villages. The district borders North Hertfordshire, Welwyn Hatfield, Hertsmere, Watford, Three Rivers, Dacorum, and Central Bedfordshire.

<span class="mw-page-title-main">St Albans (UK Parliament constituency)</span> Parliamentary constituency in the United Kingdom, 1801-1852 & 1885 onwards

St Albans is a constituency represented in the House of Commons of the UK Parliament since 2019 by Daisy Cooper, a Liberal Democrat.

<span class="mw-page-title-main">Hitchin and Harpenden (UK Parliament constituency)</span> Parliamentary constituency in the United Kingdom, 1997 onwards

Hitchin and Harpenden is a constituency represented in the House of Commons of the UK Parliament since 2017 by Bim Afolami, a Conservative.

Hertfordshire County Council in England is elected every four years. Since the last boundary changes took effect in 2017 there have been 78 electoral divisions electing one councillor each.

St Albans City and District Council elections are held three years out of every four to elect members of St Albans City and District Council in Hertfordshire, England. Since the last boundary changes in 2022 the council has comprised 56 councillors, with the district being divided into 20 wards. Elections to Hertfordshire County Council are held in the fourth year of the cycle when there are no district council elections.

<span class="mw-page-title-main">2008 St Albans City and District Council election</span>

The 2008 St Albans City and District Council election took place on 1 May 2008 to elect members of St Albans District Council in Hertfordshire, England. One third of the council was up for election and the Liberal Democrats gained overall control of the council from no overall control.

<span class="mw-page-title-main">2003 St Albans City and District Council election</span>

The 2003 St Albans City and District Council election took place on 1 May 2003 to elect members of St Albans District Council in Hertfordshire, England. One third of the council was up for election and the council stayed under no overall control.

<span class="mw-page-title-main">2004 St Albans City and District Council election</span>

The 2004 St Albans City and District Council election took place on 10 June 2004 to elect members of St Albans District Council in Hertfordshire, England. One third of the council was up for election and the council stayed under no overall control.

<span class="mw-page-title-main">2006 St Albans City and District Council election</span>

The 2006 St Albans City and District Council election took place on 4 May 2006 to elect members of St Albans District Council in Hertfordshire, England. One third of the council was up for election and the Liberal Democrats gained overall control of the council from no overall control.

<span class="mw-page-title-main">2007 St Albans City and District Council election</span>

The 2007 St Albans City and District Council election took place on 3 May 2007 to elect members of St Albans District Council in Hertfordshire, England. One third of the council was up for election and the Liberal Democrats lost overall control of the council to no overall control.

<span class="mw-page-title-main">2010 St Albans City and District Council election</span>

The 2010 St Albans City and District Council election took place on 6 May 2010 to elect members of St Albans District Council in Hertfordshire, England. One third of the council was up for election and the Liberal Democrats stayed in overall control of the council.

<span class="mw-page-title-main">2012 St Albans City and District Council election</span>

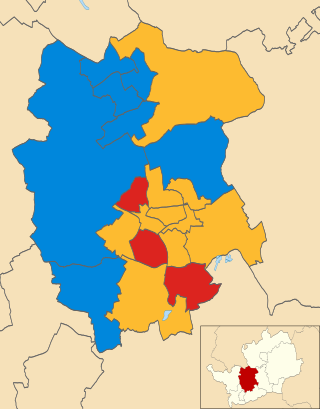
The 2012 St Albans City and District Council election took place on 3 May 2012 to elect members of St Albans District Council in Hertfordshire, England. One third of the council was up for election and the council stayed under no overall control.

<span class="mw-page-title-main">2014 St Albans City and District Council election</span>

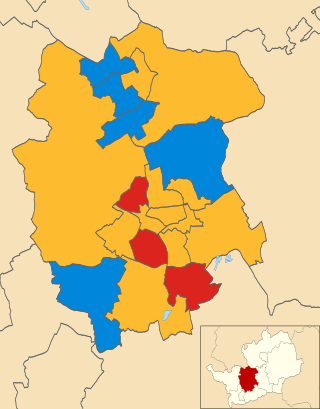
The 2014 St Albans City and District Council election took place on 22 May 2014 to elect members of St Albans District Council in Hertfordshire, England. One third of the council was up for election and the council stayed under no overall control.

<span class="mw-page-title-main">2019 St Albans City and District Council election</span> Election

The 2019 St Albans City and District Council election took place on 2 May 2019 to elect members of St Albans City and District Council in England. This was on the same day as other local elections. At the elections, the Conservatives lost control of the council

<span class="mw-page-title-main">2021 Hertfordshire County Council election</span>

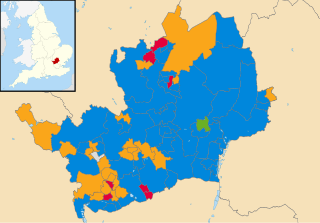
Elections to Hertfordshire County Council took place on 6 May 2021 alongside other local elections in the United Kingdom. All 78 seats to the council were elected.

The 1991 St Albans City and District Council election took place on 2 May 1991 to elect members of St Albans City and District Council in England. This was on the same day as other local elections.

The 1992 St Albans City and District Council election took place on 7 May 1992 to elect members of St Albans City and District Council in England. This was on the same day as other local elections.

The 1994 St Albans City and District Council election took place on 5 May 1994 to elect members of St Albans City and District Council in England. This was on the same day as other local elections.

The 1996 St Albans City and District Council election took place on 2 May 1996 to elect members of St Albans City and District Council in England. This was on the same day as other local elections.

The 1987 St Albans City and District Council election took place on 7 May 1987 to elect members of St Albans City and District Council in England. This was on the same day as other local elections.

References

  1. "St Albans City and District Council Election Results 1973-2012" (PDF). Colin Rallings and Michael Thrasher. Retrieved 15 November 2022.