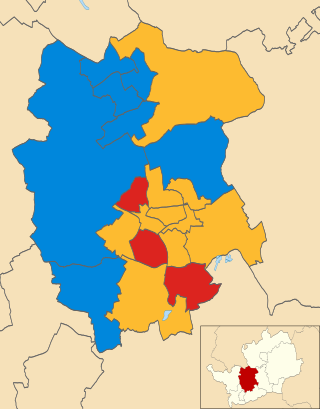
The 1983 St Albans City and District Council election took place on 5 May 1983 to elect members of St Albans City and District Council in England. [1] This was on the same day as other local elections.
1983 St Albans City and District Council election | ||||||||||
---|---|---|---|---|---|---|---|---|---|---|
Party | This election | Full council | This election | |||||||
Seats | Net | Seats % | Other | Total | Total % | Votes | Votes % | +/− | ||
Conservative | 12 | 1 | 60.0 | 18 | 30 | 52.6 | 23,786 | 47.4 | +3.2 | |
Alliance | 4 | 2 | 20.0 | 12 | 17 | 29.8 | 16,414 | 32.7 | –7.0 | |
Labour | 3 | 1 | 15.0 | 7 | 9 | 15.8 | 8,452 | 16.8 | +1.1 | |
Independent | 1 | 1 | 5.0 | 1 | 1 | 1.8 | 1,414 | 2.8 | +2.4 | |
Ecology | 0 | 0.0 | 0 | 0 | 0.0 | 127 | 0.3 | N/A | ||
Ind. Conservative | 0 | 1 | 0.0 | 0 | 0 | 0.0 | N/A | N/A | N/A | |
Party | Candidate | Votes | % | ±% | |
---|---|---|---|---|---|
Alliance | E. Aldridge | 1,403 | 52.0 | –2.6 | |
Conservative | P. Welch | 876 | 32.5 | +1.2 | |
Labour | C. Leet | 420 | 15.6 | +1.6 | |
Majority | 527 | 19.5 | –3.8 | ||
Turnout | 2,699 | 56.8 | +5.5 | ||
Registered electors | 4,783 | ||||
Alliance hold | Swing | 1.9 | |||
Party | Candidate | Votes | % | ±% | |
---|---|---|---|---|---|
Labour | P. Hiscott* | 922 | 35.6 | +1.2 | |
Alliance | S. Ward | 848 | 32.8 | –2.6 | |
Conservative | M. Dance | 819 | 31.6 | +1.5 | |
Majority | 74 | 2.9 | N/A | ||
Turnout | 2,589 | 54.9 | +7.1 | ||
Registered electors | 4,718 | ||||
Labour hold | Swing | 1.9 | |||
Party | Candidate | Votes | % | ±% | |
---|---|---|---|---|---|
Conservative | I. Stebbings* | 1,225 | 45.6 | +4.3 | |
Alliance | B. Bird | 1,180 | 43.9 | +1.1 | |
Labour | P. Harris | 280 | 10.4 | –5.5 | |
Majority | 45 | 1.7 | N/A | ||
Turnout | 2,685 | 60.5 | +4.4 | ||
Registered electors | 4,440 | ||||
Conservative hold | Swing | 1.6 | |||
Party | Candidate | Votes | % | ±% | |
---|---|---|---|---|---|
Alliance | M. Thompson | 1,248 | 46.0 | –1.0 | |
Conservative | C. Ellis | 961 | 35.4 | –1.3 | |
Labour | G. Maciver | 505 | 18.6 | +2.4 | |
Majority | 287 | 10.6 | +0.3 | ||
Turnout | 2,714 | 56.5 | +6.2 | ||
Registered electors | 4,804 | ||||
Alliance gain from Conservative | Swing | 0.2 | |||
Party | Candidate | Votes | % | ±% | |
---|---|---|---|---|---|
Conservative | G. McKenzie | 1,135 | 41.8 | –10.6 | |
Alliance | N. Osmond | 690 | 25.4 | –11.4 | |
Independent | H. Beck* | 678 | 25.0 | N/A | |
Labour | T. Morris | 214 | 7.9 | –2.8 | |
Majority | 445 | 16.4 | +0.8 | ||
Turnout | 2,717 | 52.7 | +6.6 | ||
Registered electors | 5,152 | ||||
Conservative gain from Ind. Conservative | Swing | 0.4 | |||
Party | Candidate | Votes | % | ±% | |
---|---|---|---|---|---|
Conservative | C. Curl* | 1,707 | 60.3 | +2.7 | |
Alliance | R. Thoms | 727 | 25.7 | –5.8 | |
Labour | D. Crew | 272 | 9.6 | –1.2 | |
Ecology | H. Swailes | 127 | 4.5 | N/A | |
Majority | 980 | 34.6 | +19.0 | ||
Turnout | 2,833 | 49.0 | +2.9 | ||
Registered electors | 5,778 | ||||
Conservative hold | Swing | 4.3 | |||
Party | Candidate | Votes | % | ±% | |
---|---|---|---|---|---|
Conservative | K. Nash | 1,648 | 67.1 | +9.5 | |
Alliance | P. Jones | 616 | 25.1 | –4.1 | |
Labour | C. Fryd | 191 | 7.8 | +1.9 | |
Majority | 1,032 | 42.0 | +13.6 | ||
Turnout | 2,455 | 48.5 | +2.2 | ||
Registered electors | 5,066 | ||||
Conservative hold | Swing | 6.8 | |||
No Independent candidate as previous (7.3%).
Party | Candidate | Votes | % | ±% | |
---|---|---|---|---|---|
Conservative | J. Cornforth | 1,696 | 66.0 | –0.2 | |
Alliance | J. Little | 619 | 24.1 | –2.2 | |
Labour | K. Griffin | 253 | 9.9 | +2.4 | |
Majority | 1,077 | 41.9 | +2.0 | ||
Turnout | 2,568 | 49.1 | +2.8 | ||
Registered electors | 5,196 | ||||
Conservative hold | Swing | 1.0 | |||
Party | Candidate | Votes | % | ±% | |
---|---|---|---|---|---|
Labour | L. Hayes | 1,283 | 51.8 | +0.5 | |
Conservative | J. Kalaher | 852 | 34.4 | +4.5 | |
Alliance | A. Sinagoga | 341 | 13.8 | –5.1 | |
Majority | 431 | 17.4 | –4.0 | ||
Turnout | 2,476 | 44.6 | +5.2 | ||
Registered electors | 5,546 | ||||
Labour hold | Swing | 2.0 | |||
Party | Candidate | Votes | % | ±% | |
---|---|---|---|---|---|
Conservative | K. Moody* | 1,434 | 49.4 | +11.0 | |
Alliance | P. Halpin | 1,148 | 39.6 | –1.2 | |
Labour | B. York | 318 | 11.0 | +1.9 | |
Majority | 286 | 9.9 | N/A | ||
Turnout | 2,900 | 58.0 | +6.2 | ||
Registered electors | 5,002 | ||||
Conservative hold | Swing | 6.1 | |||
No Independent candidate as previous (11.7%).
Party | Candidate | Votes | % | ±% | |
---|---|---|---|---|---|
Conservative | O. Jennings | 1,654 | 57.9 | +7.5 | |
Alliance | S. Coventry | 880 | 30.8 | –8.7 | |
Labour | A. Goodsall | 323 | 11.3 | +1.2 | |
Majority | 774 | 27.1 | +16.2 | ||
Turnout | 2,857 | 55.2 | +3.0 | ||
Registered electors | 5,176 | ||||
Conservative hold | Swing | 8.1 | |||
Party | Candidate | Votes | % | ||
---|---|---|---|---|---|
Alliance | E. Cummins | 960 | 41.9 | ||
Conservative | R. Scranage | 832 | 36.3 | ||
Alliance | G. Bliss | 821 | 35.8 | ||
Conservative | B. McArdie | 814 | 35.5 | ||
Labour | M. Rogers | 254 | 11.1 | ||
Labour | R. Fricker | 186 | 8.1 | ||
Turnout | 2,293 | 54.7 | |||
Registered electors | 4,192 | ||||
Alliance hold | |||||
Conservative hold | |||||
Party | Candidate | Votes | % | ±% | |
---|---|---|---|---|---|
Conservative | T. Biggs | 1,272 | 52.1 | +1.3 | |
Alliance | J. Bailey | 781 | 32.0 | –5.0 | |
Labour | P. Rosen | 387 | 15.9 | +3.8 | |
Majority | 491 | 20.1 | +6.3 | ||
Turnout | 2,440 | 51.1 | +4.6 | ||
Registered electors | 4,464 | ||||
Conservative hold | Swing | 3.2 | |||
Party | Candidate | Votes | % | ±% | |
---|---|---|---|---|---|
Independent | B. Filmer* | 736 | 59.4 | –2.7 | |
Conservative | D. Caroline | 414 | 33.4 | +7.5 | |
Labour | C. Newbold | 90 | 7.3 | –4.7 | |
Majority | 322 | 26.0 | –10.1 | ||
Turnout | 1,240 | 54.3 | –27.9 | ||
Registered electors | 2,284 | ||||
Independent hold | Swing | 5.1 | |||
Party | Candidate | Votes | % | ±% | |
---|---|---|---|---|---|
Labour | E. Hudson | 1,076 | 46.8 | +7.2 | |
Alliance | G. Heaton | 636 | 27.7 | –4.9 | |
Conservative | R. Anson | 587 | 25.5 | –2.3 | |
Majority | 440 | 19.1 | +12.0 | ||
Turnout | 2,299 | 49.3 | +5.0 | ||
Registered electors | 4,661 | ||||
Labour hold | Swing | 6.1 | |||
Party | Candidate | Votes | % | ±% | |
---|---|---|---|---|---|
Alliance | T. Pratt | 874 | 39.4 | –10.9 | |
Conservative | R. Smith | 775 | 34.9 | +5.4 | |
Labour | M. Fletcher | 570 | 25.7 | +5.5 | |
Majority | 99 | 4.5 | –16.3 | ||
Turnout | 2,219 | 51.1 | ±0.0 | ||
Registered electors | 4,345 | ||||
Alliance gain from Labour | Swing | 8.2 | |||
Party | Candidate | Votes | % | ±% | |
---|---|---|---|---|---|
Conservative | I. Bickerton* | 1,418 | 45.2 | –3.7 | |
Alliance | J. Kalaher | 1,356 | 43.2 | +4.6 | |
Labour | R. Humphrey | 362 | 11.5 | –1.0 | |
Majority | 62 | 2.0 | –8.4 | ||
Turnout | 3,136 | 55.9 | +5.4 | ||
Registered electors | 5,614 | ||||
Conservative hold | Swing | 4.2 | |||
Party | Candidate | Votes | % | ±% | |
---|---|---|---|---|---|
Conservative | K. Davies | 1,700 | 53.4 | +6.9 | |
Alliance | R. Baker | 1,286 | 40.4 | –7.1 | |
Labour | M. Bromberg | 198 | 6.2 | +0.2 | |
Majority | 414 | 13.0 | N/A | ||
Turnout | 3,184 | 62.7 | +5.0 | ||
Registered electors | 5,079 | ||||
Conservative hold | Swing | 7.0 | |||
Party | Candidate | Votes | % | ±% | |
---|---|---|---|---|---|
Conservative | B. Sparrow* | 1,967 | 85.0 | +36.0 | |
Labour | N. Ord | 348 | 15.0 | +6.3 | |
Majority | 1,619 | 70.0 | +63.3 | ||
Turnout | 2,315 | 49.6 | +2.7 | ||
Registered electors | 4,671 | ||||
Conservative hold | Swing | 14.9 | |||
No Alliance candidate as previous (42.3%).
St Albans is a constituency represented in the House of Commons of the UK Parliament since 2019 by Daisy Cooper, a Liberal Democrat.
Hitchin and Harpenden is a constituency represented in the House of Commons of the UK Parliament since 2017 by Bim Afolami, a Conservative.
The 2008 St Albans City and District Council election took place on 1 May 2008 to elect members of St Albans District Council in Hertfordshire, England. One third of the council was up for election and the Liberal Democrats gained overall control of the council from no overall control.
The 2002 St Albans City and District Council election took place on 2 May 2002 to elect members of St Albans District Council in Hertfordshire, England. One third of the council was up for election and the council stayed under no overall control.
The 2003 St Albans City and District Council election took place on 1 May 2003 to elect members of St Albans District Council in Hertfordshire, England. One third of the council was up for election and the council stayed under no overall control.
The 2004 St Albans City and District Council election took place on 10 June 2004 to elect members of St Albans District Council in Hertfordshire, England. One third of the council was up for election and the council stayed under no overall control.
The 2006 St Albans City and District Council election took place on 4 May 2006 to elect members of St Albans District Council in Hertfordshire, England. One third of the council was up for election and the Liberal Democrats gained overall control of the council from no overall control.
The 2007 St Albans City and District Council election took place on 3 May 2007 to elect members of St Albans District Council in Hertfordshire, England. One third of the council was up for election and the Liberal Democrats lost overall control of the council to no overall control.
The 2010 St Albans City and District Council election took place on 6 May 2010 to elect members of St Albans District Council in Hertfordshire, England. One third of the council was up for election and the Liberal Democrats stayed in overall control of the council.
The 2012 St Albans City and District Council election took place on 3 May 2012 to elect members of St Albans District Council in Hertfordshire, England. One third of the council was up for election and the council stayed under no overall control.
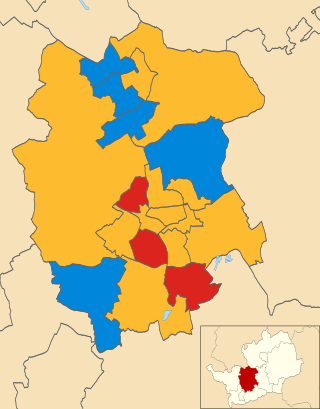
The 2011 St Albans City and District Council election took place on 5 May 2011 to elect members of St Albans District Council in Hertfordshire, England. One third of the council was up for election and the Liberal Democrats lost overall control of the council to no overall control.
The 2014 St Albans City and District Council election took place on 22 May 2014 to elect members of St Albans District Council in Hertfordshire, England. One third of the council was up for election and the council stayed under no overall control.
The 2019 St Albans City and District Council election took place on 2 May 2019 to elect members of St Albans City and District Council in England. This was on the same day as other local elections. At the elections, the Conservatives lost control of the council
Daisy Cooper is a British Liberal Democrat politician who has served as the Member of Parliament (MP) for St Albans since 2019. She has served as the Deputy Leader of the Liberal Democrats since 2020, and as the Liberal Democrat spokesperson for Health, Wellbeing and Social Care since 2021.
The 1991 St Albans City and District Council election took place on 2 May 1991 to elect members of St Albans City and District Council in England. This was on the same day as other local elections.
The 1992 St Albans City and District Council election took place on 7 May 1992 to elect members of St Albans City and District Council in England. This was on the same day as other local elections.
The 1994 St Albans City and District Council election took place on 5 May 1994 to elect members of St Albans City and District Council in England. This was on the same day as other local elections.
The 1995 St Albans City and District Council election took place on 4 May 1995 to elect members of St Albans City and District Council in England. This was on the same day as other local elections.
The 1996 St Albans City and District Council election took place on 2 May 1996 to elect members of St Albans City and District Council in England. This was on the same day as other local elections.
The 1987 St Albans City and District Council election took place on 7 May 1987 to elect members of St Albans City and District Council in England. This was on the same day as other local elections.