The 1991 St Albans City and District Council election took place on 2 May 1991 to elect members of St Albans City and District Council in England. [1] This was on the same day as other local elections.
1991 St Albans City and District Council election | ||||||||||
---|---|---|---|---|---|---|---|---|---|---|
Party | This election | Full council | This election | |||||||
Seats | Net | Seats % | Other | Total | Total % | Votes | Votes % | +/− | ||
Conservative | 8 | 4 | 42.1 | 19 | 27 | 47.4 | 17,214 | 37.0 | +3.9 | |
Liberal Democrats | 8 | 3 | 42.1 | 12 | 20 | 35.1 | 16,990 | 36.5 | +6.7 | |
Labour | 3 | 1 | 15.8 | 6 | 9 | 15.8 | 9,885 | 21.2 | -5.4 | |
Independent | 0 | 0 | 0.0 | 1 | 1 | 1.8 | 450 | 1.0 | -1.7 | |
Green | 0 | 0 | 0.0 | 0 | 0 | 0.0 | 1,981 | 4.3 | -3.5 |
Party | Candidate | Votes | % | ±% | |
---|---|---|---|---|---|
Liberal Democrats | R. Guy* | 1,131 | 43.5 | +2.9 | |
Labour | P. Murphy | 739 | 28.4 | –4.7 | |
Conservative | J. Quin | 633 | 24.3 | +3.8 | |
Green | E. Benjamin | 99 | 3.8 | –2.1 | |
Majority | 392 | 15.1 | +7.6 | ||
Turnout | 2,602 | 51.7 | –3.3 | ||
Registered electors | 5,060 | ||||
Liberal Democrats hold | Swing | 3.8 | |||
Party | Candidate | Votes | % | ±% | |
---|---|---|---|---|---|
Labour | K. White* | 1,112 | 47.0 | –7.5 | |
Conservative | J. Christie | 582 | 24.6 | +3.1 | |
Liberal Democrats | H. Smith | 537 | 22.7 | +8.3 | |
Green | S. Adamson | 135 | 5.7 | –3.9 | |
Majority | 530 | 22.4 | –10.6 | ||
Turnout | 2,366 | 50.0 | –5.2 | ||
Registered electors | 4,744 | ||||
Labour hold | Swing | 5.3 | |||
Party | Candidate | Votes | % | ±% | |
---|---|---|---|---|---|
Liberal Democrats | J. Whale* | 1,234 | 52.0 | +0.6 | |
Conservative | T. Boyle | 648 | 27.3 | +4.0 | |
Labour | B. Dearman | 381 | 16.0 | –2.5 | |
Green | D. Burningham | 112 | 4.7 | –2.1 | |
Majority | 586 | 24.7 | –3.4 | ||
Turnout | 2,375 | 55.8 | –5.6 | ||
Registered electors | 4,263 | ||||
Liberal Democrats hold | Swing | 1.7 | |||
Party | Candidate | Votes | % | ±% | |
---|---|---|---|---|---|
Liberal Democrats | R. Donald | 1,298 | 47.4 | –5.2 | |
Labour | C. Donovan | 688 | 25.1 | +7.2 | |
Conservative | M. Wragg | 679 | 24.8 | +2.1 | |
Green | E. Brown | 72 | 2.6 | –4.1 | |
Majority | 610 | 22.3 | –5.8 | ||
Turnout | 2,737 | 55.0 | –6.4 | ||
Registered electors | 4,988 | ||||
Liberal Democrats hold | Swing | 6.2 | |||
Party | Candidate | Votes | % | ±% | |
---|---|---|---|---|---|
Liberal Democrats | C. Canfield | 1,238 | 43.6 | +4.1 | |
Conservative | M. Morrell* | 1,211 | 42.7 | +5.5 | |
Labour | D. Crew | 304 | 10.7 | –4.3 | |
Green | J. Bishop | 85 | 3.0 | –5.3 | |
Majority | 27 | 1.0 | –1.3 | ||
Turnout | 2,838 | 57.0 | –4.0 | ||
Registered electors | 5,004 | ||||
Liberal Democrats gain from Conservative | Swing | 0.7 | |||
Party | Candidate | Votes | % | ±% | |
---|---|---|---|---|---|
Conservative | H. Haynes | 1,253 | 50.3 | +2.1 | |
Liberal Democrats | H. Adams | 817 | 32.8 | +10.1 | |
Labour | R. Botterill | 419 | 16.8 | –4.9 | |
Majority | 436 | 17.5 | –8.0 | ||
Turnout | 2,489 | 43.1 | –5.9 | ||
Registered electors | 5,844 | ||||
Conservative hold | Swing | 4.0 | |||
No Green candidate as previous (7.3%).
Party | Candidate | Votes | % | ±% | |
---|---|---|---|---|---|
Conservative | C. Bailey* | 1,367 | 57.4 | +2.5 | |
Liberal Democrats | K. Sutton | 645 | 27.1 | +9.4 | |
Labour | H. Holmes | 300 | 12.6 | –4.5 | |
Green | A. Pearce | 68 | 2.9 | –7.4 | |
Majority | 722 | 30.3 | –6.8 | ||
Turnout | 2,380 | 46.3 | –5.9 | ||
Registered electors | 5,174 | ||||
Conservative hold | Swing | 3.5 | |||
Party | Candidate | Votes | % | ±% | |
---|---|---|---|---|---|
Conservative | D. Coe* | 1,326 | 57.6 | +3.2 | |
Liberal Democrats | A. Steer | 676 | 29.4 | +9.5 | |
Labour | J. O'Brien | 200 | 8.7 | –5.8 | |
Green | B. Pope | 100 | 4.3 | –6.9 | |
Majority | 650 | 28.2 | –6.3 | ||
Turnout | 2,302 | 46.7 | –5.6 | ||
Registered electors | 4,964 | ||||
Conservative hold | Swing | 3.2 | |||
Party | Candidate | Votes | % | ±% | |
---|---|---|---|---|---|
Labour | E. Gordon | 1,431 | 60.8 | –0.2 | |
Conservative | P. Grimes | 717 | 30.5 | +6.9 | |
Liberal Democrats | T. Lodhi | 129 | 5.5 | –3.8 | |
Green | B. Pope | 77 | 3.3 | –2.8 | |
Majority | 714 | 30.3 | –7.1 | ||
Turnout | 2,354 | 43.2 | –4.2 | ||
Registered electors | 5,527 | ||||
Labour gain from Conservative | Swing | 3.6 | |||
Party | Candidate | Votes | % | ±% | |
---|---|---|---|---|---|
Liberal Democrats | P. Halpin | 1,354 | 53.5 | +9.3 | |
Conservative | P. Johnston | 880 | 34.8 | –0.7 | |
Labour | A. Rose | 228 | 9.0 | –5.6 | |
Green | R. Starkey | 69 | 2.7 | –3.0 | |
Majority | 474 | 18.7 | +10.0 | ||
Turnout | 2,531 | 52.5 | –2.9 | ||
Registered electors | 4,850 | ||||
Liberal Democrats gain from Conservative | Swing | 5.0 | |||
Party | Candidate | Votes | % | ±% | |
---|---|---|---|---|---|
Liberal Democrats | P. Burton | 1,392 | 47.1 | +3.1 | |
Conservative | R. Scranage | 1,070 | 36.2 | +0.6 | |
Labour | D. Allan | 384 | 13.0 | –3.0 | |
Green | A. Tindale | 110 | 3.7 | –0.7 | |
Majority | 322 | 10.9 | +2.4 | ||
Turnout | 2,956 | 57.7 | –4.4 | ||
Registered electors | 5,144 | ||||
Liberal Democrats gain from Conservative | Swing | 1.3 | |||
Party | Candidate | Votes | % | ±% | |
---|---|---|---|---|---|
Liberal Democrats | J. Finley | 932 | 52.5 | +18.5 | |
Conservative | D. Foheringham | 537 | 30.3 | –3.1 | |
Labour | L. Adams | 253 | 14.3 | –7.1 | |
Green | A. Harrison | 53 | 3.0 | –8.2 | |
Majority | 395 | 22.3 | +21.7 | ||
Turnout | 1,775 | 41.2 | –9.1 | ||
Registered electors | 4,317 | ||||
Liberal Democrats hold | Swing | 10.8 | |||
Party | Candidate | Votes | % | ±% | |
---|---|---|---|---|---|
Conservative | B. Chapman* | 971 | 43.4 | –4.5 | |
Liberal Democrats | P. Schofield | 938 | 42.0 | N/A | |
Labour | P. Robinson | 221 | 9.9 | –19.2 | |
Green | D. Cockroft | 105 | 4.7 | –18.2 | |
Majority | 33 | 1.5 | –17.3 | ||
Turnout | 2,235 | 50.8 | +0.5 | ||
Registered electors | 4,317 | ||||
Conservative hold | Swing | N/A | |||
Party | Candidate | Votes | % | ±% | |
---|---|---|---|---|---|
Labour | D. Batley | 1,419 | 60.5 | –4.7 | |
Conservative | G. Brown | 422 | 18.0 | +3.8 | |
Liberal Democrats | R. Biddle | 410 | 17.5 | +5.2 | |
Green | S. Allcock | 95 | 4.0 | –4.3 | |
Majority | 997 | 42.5 | –8.4 | ||
Turnout | 2,346 | 46.4 | –7.8 | ||
Registered electors | 5,085 | ||||
Labour hold | Swing | 4.3 | |||
Party | Candidate | Votes | % | ±% | |
---|---|---|---|---|---|
Conservative | C. Whiteside* | 816 | 46.5 | –6.8 | |
Independent | B. Filmer | 450 | 25.7 | N/A | |
Liberal Democrats | M. Lawson | 275 | 15.7 | –16.0 | |
Labour | E. Adams | 173 | 9.9 | +4.1 | |
Green | F. Ellis | 39 | 2.2 | –0.8 | |
Majority | 366 | 20.9 | –0.7 | ||
Turnout | 1,753 | 44.6 | –7.0 | ||
Registered electors | 3,928 | ||||
Conservative hold | Swing | N/A | |||
Party | Candidate | Votes | % | ±% | |
---|---|---|---|---|---|
Liberal Democrats | J. Gunner* | 1,161 | 48.6 | +5.2 | |
Labour | D. Paton | 645 | 27.0 | –4.9 | |
Conservative | R. Wakerly | 417 | 17.4 | +1.3 | |
Green | C. Simmons | 168 | 7.0 | –1.6 | |
Majority | 516 | 21.6 | +10.1 | ||
Turnout | 2,391 | 49.0 | –5.9 | ||
Registered electors | 4,880 | ||||
Liberal Democrats hold | Swing | 5.1 | |||
Party | Candidate | Votes | % | ±% | |
---|---|---|---|---|---|
Conservative | A. Nowell* | 1,261 | 44.4 | +16.2 | |
Liberal Democrats | J. Eagling | 1,099 | 38.7 | +22.0 | |
Labour | N. Williamson | 393 | 13.8 | +1.4 | |
Green | H. Clemow | 90 | 3.2 | +0.2 | |
Majority | 162 | 5.7 | N/A | ||
Turnout | 2,843 | 49.6 | –12.4 | ||
Registered electors | 5,740 | ||||
Conservative hold | Swing | 2.9 | |||
No Independent candidate as previous (39.7%).
Party | Candidate | Votes | % | ±% | |
---|---|---|---|---|---|
Conservative | J. Smith | 1,307 | 47.2 | +3.2 | |
Liberal Democrats | J. Cooper | 1,004 | 36.4 | +10.9 | |
Labour | K. Sutton | 321 | 11.6 | –7.9 | |
Green | W. Berrington | 124 | 4.5 | –6.4 | |
Majority | 303 | 11.0 | –7.7 | ||
Turnout | 2,756 | 54.1 | –3.8 | ||
Registered electors | 5,104 | ||||
Conservative hold | Swing | 3.9 | |||
Party | Candidate | Votes | % | ±% | |
---|---|---|---|---|---|
Conservative | D. Hills* | 1,117 | 44.8 | +7.7 | |
Liberal Democrats | R. Adams | 720 | 28.9 | –18.5 | |
Green | P. King | 380 | 15.3 | +11.0 | |
Labour | C. Chadney | 274 | 11.0 | –0.3 | |
Majority | 397 | 15.9 | N/A | ||
Turnout | 2,491 | 52.9 | –6.0 | ||
Registered electors | 4,774 | ||||
Conservative hold | Swing | 13.1 | |||
Hitchin and Harpenden is a constituency represented in the House of Commons of the UK Parliament since 2017 by Bim Afolami, a Conservative.
St Albans City and District Council elections are held three years out of every four to elect members of St Albans City and District Council in Hertfordshire, England. Since the last boundary changes in 2022 the council has comprised 56 councillors, with the district being divided into 20 wards. Elections to Hertfordshire County Council are held in the fourth year of the cycle when there are no district council elections.
The 2008 St Albans City and District Council election took place on 1 May 2008 to elect members of St Albans District Council in Hertfordshire, England. One third of the council was up for election and the Liberal Democrats gained overall control of the council from no overall control.
The 2002 St Albans City and District Council election took place on 2 May 2002 to elect members of St Albans District Council in Hertfordshire, England. One third of the council was up for election and the council stayed under no overall control.
The 2004 St Albans City and District Council election took place on 10 June 2004 to elect members of St Albans District Council in Hertfordshire, England. One third of the council was up for election and the council stayed under no overall control.
The 2006 St Albans City and District Council election took place on 4 May 2006 to elect members of St Albans District Council in Hertfordshire, England. One third of the council was up for election and the Liberal Democrats gained overall control of the council from no overall control.
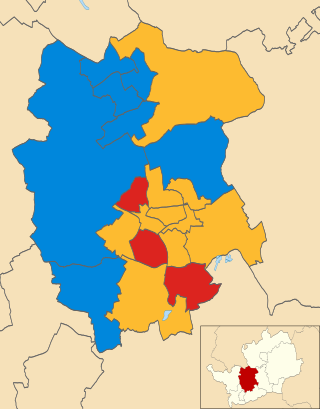
The 2007 St Albans City and District Council election took place on 3 May 2007 to elect members of St Albans District Council in Hertfordshire, England. One third of the council was up for election and the Liberal Democrats lost overall control of the council to no overall control.
The 2010 St Albans City and District Council election took place on 6 May 2010 to elect members of St Albans District Council in Hertfordshire, England. One third of the council was up for election and the Liberal Democrats stayed in overall control of the council.
The 2012 St Albans City and District Council election took place on 3 May 2012 to elect members of St Albans District Council in Hertfordshire, England. One third of the council was up for election and the council stayed under no overall control.
The 2014 St Albans City and District Council election took place on 22 May 2014 to elect members of St Albans District Council in Hertfordshire, England. One third of the council was up for election and the council stayed under no overall control.
The 2016 St Albans City and District Council election took place on 5 May 2016 to elect members of St Albans City and District Council in England. This was on the same day as other local elections.
The 2019 St Albans City and District Council election took place on 2 May 2019 to elect members of St Albans City and District Council in England. This was on the same day as other local elections. At the elections, the Conservatives lost control of the council
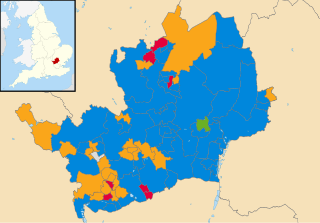
Elections to Hertfordshire County Council took place on 6 May 2021 alongside other local elections in the United Kingdom. All 78 seats to the council were elected.
The 2022 St Albans City and District Council election took place on 5 May 2022, to elect members of St Albans City and District Council in England. It was on the same day as other local elections.
The 1992 St Albans City and District Council election took place on 7 May 1992 to elect members of St Albans City and District Council in England. This was on the same day as other local elections.
The 1994 St Albans City and District Council election took place on 5 May 1994 to elect members of St Albans City and District Council in England. This was on the same day as other local elections.
The 1995 St Albans City and District Council election took place on 4 May 1995 to elect members of St Albans City and District Council in England. This was on the same day as other local elections.
The 1996 St Albans City and District Council election took place on 2 May 1996 to elect members of St Albans City and District Council in England. This was on the same day as other local elections.
The 1983 St Albans City and District Council election took place on 5 May 1983 to elect members of St Albans City and District Council in England. This was on the same day as other local elections.
The 1987 St Albans City and District Council election took place on 7 May 1987 to elect members of St Albans City and District Council in England. This was on the same day as other local elections.