2015 North Hertfordshire District Council election

Last updated

2015 North Hertfordshire District Council election
  2014 7 May 2015 (2015-05-07) 2016  

16 of 49 seats on North Hertfordshire District Council
25 seats needed for a majority
 First partySecond partyThird party
 
Con
Lab
LD
LeaderLynda NeedhamJudi BillingSteve Jarvis
Party Conservative Labour Liberal Democrats
Seats before34123
Seats after36112
Seat changeIncrease2.svg2Decrease2.svg1Decrease2.svg1
Popular vote24,55511,1915,893
Percentage47.8%21.8%11.5%

Leader before election

Lynda Needham
Conservative

Leader after election

Lynda Needham
Conservative

The 2015 North Hertfordshire Council election was held on 7 May 2015, at the same time as other local elections and the general election. Of the 49 seats on North Hertfordshire District Council, 16 were up for election. [1]

Contents

The Conservatives increased their majority on the council. They gained two seats, one from Labour and one from the Liberal Democrats. The Conservative leader, Lynda Needham, continued to serve as leader of the council. [2] Shortly after the election, Labour changed its leader from Judi Billing to Frank Radcliffe. [3]

Overall results

The overall results were as follows: [4]

2015 North Hertfordshire District Council election
PartyThis electionFull councilThis election
SeatsNetSeats %OtherTotalTotal %VotesVotes %+/−
  Conservative 14Increase2.svg 287.5223673.524,55547.8+7.7
  Labour 1Decrease2.svg 16.3101122.411,19121.8-1.6
  Liberal Democrats 1Decrease2.svg 16.3124.15,89311.5+3.5
  Green 0Steady2.svg0.0000.04,8869.5-0.3
  UKIP 0Steady2.svg0.0000.04,8659.5-9.3

Ward results

The results for each ward were as follows. Where the previous incumbent was standing for re-election they are marked with an asterisk(*). [5]

Arbury ward
PartyCandidateVotes%±%
Conservative Janine Ann Paterson 1,066 63.9% +4.4
Green Jane Louise Smith21412.8%+9.5
Liberal Democrats Michael John Lott19111.5%-18.6
Labour Rhona Ann Cameron17410.4%+3.8
Turnout 1,66880.2%
Conservative hold Swing -2.5
Baldock Town ward
PartyCandidateVotes%±%
Conservative Michael Douglas MacKenzie Muir* 2,081 54.8% +9.2
Labour Wayne Thornton76820.2%+3.1
UKIP Brian Munnery53314.0%+14.0
Green Arwen Jane Tapping40210.6%+2.1
Turnout 3,79665.0%
Conservative hold Swing +3.1
Cadwell ward
PartyCandidateVotes%±%
Conservative Harry Spencer-Smith 770 58.0% +0.8
Labour Dave Winstanley26119.7%-5.8
Green Rosamund Brigid McGuire14110.6%+4.7
Liberal Democrats John Stephen White1319.9%-0.7
Turnout 1,32873.6%
Conservative hold Swing +3.3
Chesfield ward
PartyCandidateVotes%±%
Conservative Cathryn Henry* 1,682 47.3% +13.1
Labour Simon Peter Watson64718.2%+0.3
Liberal Democrats Terry Tyler56415.9%-28.0
UKIP Colin Rafferty49714.0%+14.0
Green Felicity Power1494.2%+0.4
Turnout 3,55768.0%
Conservative hold Swing +6.4
Ermine ward
PartyCandidateVotes%±%
Conservative Gerald Edward Morris* 1,146 73.7% 0.0
Green Mark Gamon37624.2%+11.8
Turnout 1,55477.6%
Conservative hold Swing -5.9
Hitchin Bearton ward
PartyCandidateVotes%±%
Labour Judi Billing* 1,960 42.8% +3.2
Conservative Peter Saville1,36529.8%+6.6
Liberal Democrats Stuart Alder48410.6%-1.1
Green Martin Burke46510.2%-3.3
UKIP Allan Paul Newey2836.2%-5.6
Turnout 4,57770.7%
Labour hold Swing -1.7
Hitchin Highbury ward
PartyCandidateVotes%±%
Conservative Nicola Harris 1,791 39.1% +3.8
Liberal Democrats Paul Clark*1,40930.8%+2.5
Labour Araminta Birdsey68715.0%+1.3
UKIP Jeremy Groves3507.6%-7.1
Green Mark Whitby3267.1%-0.3
Turnout 4,58274.0%
Conservative gain from Liberal Democrats Swing +0.7
Hitchin Walsworth ward
PartyCandidateVotes%±%
Conservative Bernard Lovewell* 1,710 39.9% +6.2
Labour Elizabeth Louise Dennis1,33231.1%+1.4
Green Richard Alexander Cano53312.4%-2.4
UKIP Peter Croft3889.1%-5.9
Liberal Democrats Andrew Ircha3107.2%+0.7
Turnout 4,28569.9%
Conservative hold Swing +2.4
Hitchwood, Offa and Hoo ward
PartyCandidateVotes%±%
Conservative David Barnard* 2,486 58.0% -4.0
Labour Nicola Eleanor Yates55012.8%+3.0
UKIP Gary Jones54312.7%-4.5
Green Rick Cadger3538.2%+2.0
Liberal Democrats Peter Donald Johnson3438.0%3.2
Turnout 4,28776.0%
Conservative hold Swing -3.5
Letchworth Grange ward
PartyCandidateVotes%±%
Conservative Paul Anthony James Marment 1,547 40.4% +10.5
Labour David Kearns*1,27033.2%+0.5
UKIP Andrew Hamilton Scuoler47412.4%-11.5
Green Elizabeth Susan Hancock2987.8%+0.4
Liberal Democrats Martin Geoffrey Penny2245.9%+0.5
Turnout 3,82766.7%
Conservative gain from Labour Swing +5.0
Letchworth South East ward
PartyCandidateVotes%±%
Conservative Julian Michael Cunningham* 1,717 46% +6.9
Labour Martin Stears-Handscomb1,19331.9%+7.4
UKIP Sidney Arthur Start53514.3%-8.7
Green Sam Evison2707.2%+0.9
Turnout 3,73466.2%
Conservative hold Swing -0.2
Letchworth South West ward
PartyCandidateVotes%±%
Conservative Lynda Ann Needham* 2,128 48.6% +2.6
Labour Jean Andrews77417.7%+2.1
Green Mario May55712.7%+1.1
Liberal Democrats Rebecca Carole Greener45810.5%-0.4
UKIP John Finbarr Barry4319.8%-5.3
Turnout 4,37670.8%
Conservative hold Swing +0.2
Royston Heath ward
PartyCandidateVotes%±%
Conservative Peter Colin Weston Burt* 1,560 50.8% +2.9
Labour Ken Garland49916.2%+2.0
Liberal Democrats David Robert May41113.4%+4.9
UKIP Sean Ulick Howlett37012.0%-7.1
Green Katherine Marie Shann2167.0%-2.6
Turnout 3,07170.6%
Conservative hold Swing +0.5
Royston Meridian ward
PartyCandidateVotes%±%
Conservative Tony Hunter* 1,924 62.9% +18.0
Labour Robin Edward Todd44214.4%+2.7
Liberal Democrats Joe Jordan38112.5%+5.9
Green Karen Julie Harmel2859.3%+1.2
Turnout 3,06073.6%
Conservative hold Swing +7.6
Royston Palace ward
PartyCandidateVotes%±%
Conservative Jean Margaret Green* 1,155 43.1% +8.8
Labour Amy Jane Bourke63423.6%-2.5
UKIP Gemma Margaret Rosina Hughes46117.2%-8.4
Liberal Democrats Gerald Charles Denis Jackson2368.8%+1.5
Green Angela Clark1776.6%+0.3
Turnout 2,68264.7%
Conservative hold Swing +5.7
Weston and Sandon ward
PartyCandidateVotes%±%
Liberal Democrats Steve Jarvis* 751 57.5% -1.0
Conservative Leighton James Hughes42732.7%-0.7
Green Annmarie Brinsley1249.5%+6.0
Turnout 1,30778.4%
Liberal Democrats hold Swing -0.1

Related Research Articles

<span class="mw-page-title-main">Welwyn Hatfield</span> District in Hertfordshire, England

Welwyn Hatfield is a local government district with borough status in the county of Hertfordshire, England. Its council is based in Welwyn Garden City. The borough borders Hertsmere, St Albans, North Hertfordshire, East Hertfordshire, Broxbourne, and the London Borough of Enfield.

<span class="mw-page-title-main">Hertsmere</span> Non-metropolitan district & Borough in England

Hertsmere is a local government district with borough status in Hertfordshire, England. Its council is based in Borehamwood. Other settlements in the borough include Bushey, Elstree, Radlett and Potters Bar. The borough contains several film studios, including Elstree Studios and the BBC Elstree Centre at Borehamwood. The borough borders Three Rivers, Watford, St Albans, and Welwyn Hatfield in Hertfordshire and the three north London boroughs of Harrow, Barnet and Enfield. Hertsmere is located mainly within the M25 Motorway.

<span class="mw-page-title-main">Three Rivers District</span> Non-metropolitan district in England

Three Rivers is a local government district in south-west Hertfordshire, England. Its council is based in Rickmansworth. The district borders Hertsmere, Watford, St Albans, Dacorum, Buckinghamshire, and the London boroughs of Hillingdon and Harrow.

Hertfordshire County Council in England is elected every four years. Since the last boundary changes took effect in 2017 there have been 78 electoral divisions electing one councillor each.

<span class="mw-page-title-main">Stevenage Borough Council</span>

Stevenage Borough Council is the local authority for the Stevenage non-metropolitan district of England, the United Kingdom. Stevenage is located in the north-east of Hertfordshire, in the East of England region.

<span class="mw-page-title-main">2003 St Albans City and District Council election</span>

The 2003 St Albans City and District Council election took place on 1 May 2003 to elect members of St Albans District Council in Hertfordshire, England. One third of the council was up for election and the council stayed under no overall control.

<span class="mw-page-title-main">2006 St Albans City and District Council election</span>

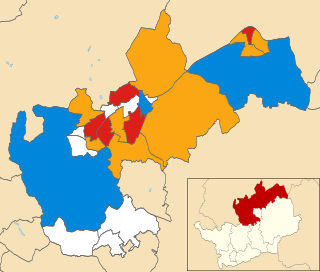
The 2006 St Albans City and District Council election took place on 4 May 2006 to elect members of St Albans District Council in Hertfordshire, England. One third of the council was up for election and the Liberal Democrats gained overall control of the council from no overall control.

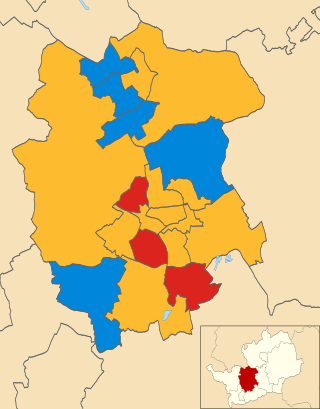
The 2012 North Hertfordshire Council election was held on 3 May 2012, at the same time as other local elections across England, Scotland and Wales. Of the 49 seats on North Hertfordshire District Council, 15 were up for election.

The 2014 North Hertfordshire Council election was held on 22 May 2014, at the same time as other local elections and the European Parliament election. Of the 49 seats on North Hertfordshire District Council, 18 were up for election.

The 2015 North Hertfordshire Council election was held on 5 May 2016, at the same time as other local elections across England. Of the 49 seats on North Hertfordshire District Council, 15 were up for election.

The 2019 North Hertfordshire Council election was held on 2 May 2019, at the same time as other local elections across England and Northern Ireland. Of the 49 seats on North Hertfordshire District Council, 16 were up for election.

The 2018 North Hertfordshire Council election was held on 3 May 2018, at the same time as other local elections across England. Of the 49 seats on North Hertfordshire District Council, 19 were up for election, being the usual third of the council plus a by-election in Letchworth Grange ward.

<span class="mw-page-title-main">2021 Hertfordshire County Council election</span>

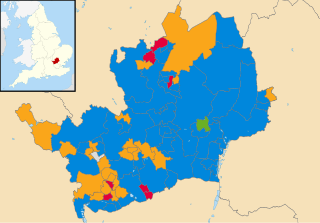
Elections to Hertfordshire County Council took place on 6 May 2021 alongside other local elections in the United Kingdom. All 78 seats to the council were elected.

<span class="mw-page-title-main">2021 North Hertfordshire District Council election</span>

The 2021 North Hertfordshire District Council election took place on 6 May 2021 to elect 17 of the 49 members of North Hertfordshire District Council in England. This was on the same day as other local elections around the country. This election had originally been due to take place in May 2020, but was postponed due to the COVID-19 pandemic.

<span class="mw-page-title-main">2022 North Hertfordshire District Council election</span>

The 2022 North Hertfordshire District Council election took place on 5 May 2022 to elect 18 of the 49 members of North Hertfordshire District Council in England. This was on the same day as other local elections around the country. The council remained under no overall control, with a Labour and Liberal Democrat coalition continuing to run the council. The leader of the council remained the Labour group leader, Elizabeth Dennis-Harburg, and the deputy leader of the council remained the Liberal Democrat group leader, Ruth Brown.

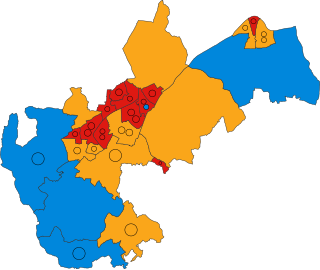
The 2007 North Hertfordshire District Council election was held on 3 May 2007, at the same time as other local elections across England and Scotland. All 49 seats on North Hertfordshire District Council were up for election following changes to ward boundaries. Labour and the Liberal Democrats (UK) both increased their number of seats, but the Conservatives retained their majority on the council. The Conservative leader, F. John Smith, remained leader of the council after the election.

The 2008 North Hertfordshire Council election was held on 1 May 2008, at the same time as other local elections across England and Wales. Of the 49 seats on North Hertfordshire District Council, 15 were up for election.

The 2010 North Hertfordshire Council election was held on 6 May 2010, at the same time as other local elections across England and the general election. Of the 49 seats on North Hertfordshire District Council, 19 were up for election, being the usual third of seats plus a by-election in Royston Palace ward.

The 2011 North Hertfordshire Council election was held on 5 May 2011, at the same time as other local elections across England and Northern Ireland. Of the 49 seats on North Hertfordshire District Council, 16 were up for election.

The 1999 North Hertfordshire District Council election was held on 6 May 1999, at the same time as other local elections across Britain. All 49 seats on North Hertfordshire District Council were up for election following changes to ward boundaries.

References

  1. "The District of North Hertfordshire (Electoral Changes) Order 2006", legislation.gov.uk , The National Archives, SI 2006/3112, retrieved 4 March 2023
  2. "Council minutes, 21 May 2015". North Hertfordshire District Council. Retrieved 8 March 2023.
  3. "Prominent politicians from Stevenage and North Herts think Yvette Cooper will be Labour's next leader". The Comet. 23 June 2015. Retrieved 8 March 2023.
  4. Andrew, Teale. "Local Election Results 2015: North Hertfordshire". Local Elections Archive Project. Retrieved 8 March 2023.
  5. "Election Results 2015". North Hertfordshire District Council. Archived from the original on 10 September 2015. Retrieved 8 March 2023.