| |||||||||||||||||||||||||||||||||
All 77 seats to Hertfordshire County Council 39 seats needed for a majority | |||||||||||||||||||||||||||||||||
---|---|---|---|---|---|---|---|---|---|---|---|---|---|---|---|---|---|---|---|---|---|---|---|---|---|---|---|---|---|---|---|---|---|
Registered | 744,952 (2.0%) | ||||||||||||||||||||||||||||||||
Turnout | 41.3% (4.0%) | ||||||||||||||||||||||||||||||||
| |||||||||||||||||||||||||||||||||
|
The 1989 Hertfordshire County Council election took place on 4 May 1989 to elect members of Hertfordshire County Council in Hertfordshire, England. This was on the same day as other local elections.
At the election, the Conservatives gained control of the council from No overall control.
1989 Hertfordshire County Council election [1] | ||||||||||
---|---|---|---|---|---|---|---|---|---|---|
Party | Candidates | Seats | Gains | Losses | Net gain/loss | Seats % | Votes % | Votes | +/− | |
Conservative | 77 | 45 | 10 | 1 | 9 | 58.4 | 44.1 | 135,764 | +6.5 | |
Labour | 77 | 27 | 2 | 2 | 35.1 | 33.1 | 101,681 | +4.1 | ||
SLD | 73 | 5 | 0 | 9 | 9 | 6.5 | 18.9 | 58,010 | –13.2 | |
SDP | 20 | 0 | 0 | 0 | 0.0 | 2.0 | 6,287 | N/A | ||
Residents | 3 | 0 | 0 | 0 | 0.0 | 1.1 | 3,265 | +0.1 | ||
Green | 7 | 0 | 0 | 0 | 0.0 | 0.7 | 2,057 | +0.4 | ||
Independent | 1 | 0 | 0 | 0 | 0.0 | 0.1 | 396 | +0.1 | ||
National Front | 1 | 0 | 0 | 0 | 0.0 | <0.1 | 77 | N/A |
Party | Seats | +/- | Votes | % | +/- | |
---|---|---|---|---|---|---|
Conservative | 6 | 10,464 | 55.5 | +8.3 | ||
Labour | 0 | 5,522 | 29.3 | +3.5 | ||
SLD | 0 | 2,613 | 13.9 | –12.9 | ||
SDP | 0 | 242 | 1.3 | N/A | ||
Total | 6 | 18,841 | 30.9 | –4.7 | ||
Registered electors | 61,030 | – | +3.6 |
Division results
Party | Candidate | Votes | % | ±% | |
---|---|---|---|---|---|
Conservative | J. Drew* | 1,698 | 53.3 | +7.7 | |
Labour | J. Draper | 1,164 | 36.5 | –0.2 | |
SLD | P. Huse | 324 | 10.2 | –7.5 | |
Majority | 534 | 16.8 | +7.8 | ||
Turnout | 3,186 | 34.4 | –2.5 | ||
Registered electors | 9,272 | ||||
Conservative hold | Swing | 4.0 |
Party | Candidate | Votes | % | ±% | |
---|---|---|---|---|---|
Conservative | B. Harlow | 1,332 | 58.6 | +9.6 | |
Labour | S. Elliott | 585 | 25.7 | –3.3 | |
SLD | C. Brown | 357 | 15.7 | –6.3 | |
Majority | 747 | 32.8 | +12.9 | ||
Turnout | 2,274 | 23.6 | –7.2 | ||
Registered electors | 9,632 | ||||
Conservative hold | Swing | 6.5 |
Party | Candidate | Votes | % | ±% | |
---|---|---|---|---|---|
Conservative | C. Tyler* | 1,984 | 63.5 | +15.0 | |
Labour | J. Atkins | 570 | 18.2 | +0.4 | |
SLD | R. Dubow | 330 | 10.6 | –23.1 | |
SDP | D. Lefley | 242 | 7.7 | N/A | |
Majority | 1,414 | 45.2 | +30.4 | ||
Turnout | 3,126 | 28.5 | –7.0 | ||
Registered electors | 10,981 | ||||
Conservative hold | Swing | 7.3 |
Party | Candidate | Votes | % | ±% | |
---|---|---|---|---|---|
Conservative | J. Rose* | 1,770 | 55.9 | +8.0 | |
Labour | J. Garrett | 928 | 29.3 | +0.9 | |
SLD | J. Gould | 470 | 14.8 | –8.9 | |
Majority | 842 | 26.6 | +7.1 | ||
Turnout | 3,168 | 33.3 | –6.5 | ||
Registered electors | 9,511 | ||||
Conservative hold | Swing | 3.6 |
Party | Candidate | Votes | % | ±% | |
---|---|---|---|---|---|
Conservative | H. Bird | 1,870 | 59.9 | +10.6 | |
SLD | T. Griffiths | 785 | 25.2 | –12.2 | |
Labour | A. Bloomfield | 466 | 14.9 | +3.2 | |
Majority | 1,085 | 34.8 | +22.9 | ||
Turnout | 3,121 | 30.3 | –7.8 | ||
Registered electors | 10,297 | ||||
Conservative hold | Swing | 6.9 |
Party | Candidate | Votes | % | ±% | |
---|---|---|---|---|---|
Conservative | R. Quint | 1,810 | 45.6 | +2.8 | |
Labour | M. Hudson | 1,809 | 45.6 | +12.6 | |
SLD | P. Seeby | 347 | 8.7 | –15.5 | |
Majority | 1 | 0.03 | –9.9 | ||
Turnout | 3,966 | 35.0 | +2.1 | ||
Registered electors | 11,337 | ||||
Conservative hold | Swing | 4.9 |
Party | Seats | +/- | Votes | % | +/- | |
---|---|---|---|---|---|---|
Conservative | 7 | 1 | 18,190 | 43.7 | +6.7 | |
Labour | 3 | 13,803 | 33.2 | +0.8 | ||
SLD | 0 | 1 | 5,645 | 13.6 | –16.4 | |
SDP | 0 | 3,289 | 7.9 | N/A | ||
Green | 0 | 623 | 1.5 | +1.2 | ||
National Front | 0 | 77 | 0.2 | N/A | ||
Total | 10 | 41,627 | 40.8 | –4.2 | ||
Registered electors | 102,000 | – | +1.8 |
Division results
Party | Candidate | Votes | % | ±% | |
---|---|---|---|---|---|
Conservative | H. Rost* | 2,127 | 46.1 | +1.3 | |
SLD | S. Sharpe | 1,236 | 26.8 | –5.7 | |
Labour | D. Freeman | 974 | 21.1 | –1.6 | |
SDP | S. Taylor | 275 | 6.0 | N/A | |
Majority | 891 | 19.3 | +7.1 | ||
Turnout | 4,612 | 38.3 | –3.8 | ||
Registered electors | 12,038 | ||||
Conservative hold | Swing | 3.5 |
Party | Candidate | Votes | % | ±% | |
---|---|---|---|---|---|
Conservative | F. Seely* | 2,034 | 65.8 | +6.7 | |
Labour | K. Short | 506 | 16.4 | +1.5 | |
SLD | I. McCalla | 369 | 11.9 | –14.1 | |
SDP | J. Taylor | 184 | 5.9 | N/A | |
Majority | 1,528 | 49.4 | +16.3 | ||
Turnout | 3,093 | 37.9 | –4.2 | ||
Registered electors | 8,156 | ||||
Conservative hold | Swing | 2.6 |
Party | Candidate | Votes | % | ±% | |
---|---|---|---|---|---|
Conservative | R. Hamilton | 2,113 | 47.7 | +12.2 | |
Labour | S. Harrison | 1,352 | 30.5 | –1.2 | |
SLD | A. Winter | 643 | 14.5 | –18.3 | |
SDP | E. Baker | 319 | 7.2 | N/A | |
Majority | 761 | 17.2 | +14.4 | ||
Turnout | 4,427 | 48.4 | –1.1 | ||
Registered electors | 9,150 | ||||
Conservative hold | Swing | 6.7 |
Party | Candidate | Votes | % | ±% | |
---|---|---|---|---|---|
Conservative | S. Sullivan | 1,215 | 34.9 | +4.4 | |
Labour | I. Laidlaw-Dickson | 1,156 | 33.2 | –1.4 | |
SDP | W. Evans* | 682 | 19.6 | N/A | |
SLD | J. Blackman | 426 | 12.2 | –22.7 | |
Majority | 59 | 1.7 | N/A | ||
Turnout | 3,479 | 32.9 | –8.2 | ||
Registered electors | 10,565 | ||||
Conservative gain from SLD | Swing | 2.9 |
Party | Candidate | Votes | % | ±% | |
---|---|---|---|---|---|
Labour | D. Moss* | 2,332 | 50.0 | +0.8 | |
Conservative | A. Williams | 1,275 | 27.4 | +5.0 | |
SDP | R. Eminson | 560 | 12.0 | N/A | |
SLD | E. Willis | 416 | 8.9 | –19.5 | |
National Front | J. McAuley | 77 | 1.7 | N/A | |
Majority | 1,057 | 22.7 | +2.0 | ||
Turnout | 4,660 | 45.3 | –3.3 | ||
Registered electors | 10,298 | ||||
Labour hold | Swing | 2.1 |
Party | Candidate | Votes | % | ±% | |
---|---|---|---|---|---|
Labour | R. Thorpe-Tracey* | 2,159 | 48.0 | +1.8 | |
Conservative | M. Griffiths | 1,667 | 37.0 | +11.0 | |
SLD | G. Lawrence | 370 | 8.2 | –19.6 | |
SDP | D. Coburn | 306 | 6.8 | N/A | |
Majority | 492 | 10.9 | –7.4 | ||
Turnout | 4,502 | 40.4 | –4.5 | ||
Registered electors | 11,133 | ||||
Labour hold | Swing | 4.6 |
Party | Candidate | Votes | % | ±% | |
---|---|---|---|---|---|
Labour | P. Doyle | 2,086 | 58.3 | +7.9 | |
Conservative | K. Birtchnell | 907 | 25.3 | +7.8 | |
SLD | R. Hollinghurst | 298 | 8.3 | –23.8 | |
SDP | D. Coburn | 288 | 8.0 | N/A | |
Majority | 1,179 | 32.9 | +14.6 | ||
Turnout | 3,579 | 41.6 | –4.5 | ||
Registered electors | 8,597 | ||||
Labour hold | Swing | 0.1 |
Party | Candidate | Votes | % | ±% | |
---|---|---|---|---|---|
Conservative | C. Everall* | 2,410 | 51.6 | +6.3 | |
Labour | R. Barson | 1,475 | 31.6 | +1.6 | |
SDP | W. Lear | 432 | 9.2 | N/A | |
SLD | C. Gudgeon | 358 | 7.7 | –15.1 | |
Majority | 935 | 20.0 | +4.7 | ||
Turnout | 4,675 | 39.6 | –4.9 | ||
Registered electors | 11,813 | ||||
Conservative hold | Swing | 2.4 |
Party | Candidate | Votes | % | ±% | |
---|---|---|---|---|---|
Conservative | A. Anderson* | 1,744 | 49.6 | +4.2 | |
Labour | S. Cox | 1,049 | 29.9 | +11.3 | |
SLD | S. Bowles | 598 | 17.0 | –19.0 | |
SDP | I. Rambotas | 123 | 3.5 | N/A | |
Majority | 695 | 19.8 | +10.5 | ||
Turnout | 3,514 | 40.1 | –7.7 | ||
Registered electors | 8,765 | ||||
Conservative hold | Swing | 3.5 |
Party | Candidate | Votes | % | ±% | |
---|---|---|---|---|---|
Conservative | H. Marwood* | 2,698 | 53.0 | +6.1 | |
SLD | E. Williams | 931 | 18.3 | –10.1 | |
Labour | M. Jenner | 714 | 14.0 | –7.5 | |
Green | A. Hunt | 623 | 12.2 | +9.0 | |
SDP | R. Muller | 120 | 2.4 | N/A | |
Majority | 1,767 | 34.7 | +16.1 | ||
Turnout | 5,086 | 44.3 | –0.5 | ||
Registered electors | 11,485 | ||||
Conservative hold | Swing | 8.1 |
Party | Seats | +/- | Votes | % | +/- | |
---|---|---|---|---|---|---|
Conservative | 8 | 2 | 18,525 | 50.0 | +9.3 | |
Labour | 1 | 7,401 | 20.0 | +2.3 | ||
SLD | 0 | 2 | 8,543 | 23.1 | –12.8 | |
Residents | 0 | 1,729 | 4.7 | +0.2 | ||
Green | 0 | 829 | 2.2 | +1.0 | ||
Total | 9 | 37,027 | 41.5 | –2.7 | ||
Registered electors | 89,141 | – | +4.9 |
Division results
Party | Candidate | Votes | % | ±% | |
---|---|---|---|---|---|
Conservative | H. Banks | 1,678 | 41.7 | +0.4 | |
SLD | E. Banks | 1,173 | 29.2 | –3.6 | |
Labour | J. Findlay | 860 | 21.4 | –2.1 | |
Green | B. Cheal | 309 | 7.7 | +5.3 | |
Majority | 505 | 12.6 | +4.2 | ||
Turnout | 4,020 | 45.9 | –1.4 | ||
Registered electors | 8,751 | ||||
Conservative hold | Swing | 2.0 |
Party | Candidate | Votes | % | ±% | |
---|---|---|---|---|---|
Conservative | D. Oldland | 1,435 | 39.6 | +17.4 | |
Residents | V. Ellison | 799 | 22.1 | –5.3 | |
SLD | A. Graham | 795 | 21.9 | –11.4 | |
Labour | E. Egginton | 593 | 16.4 | –0.6 | |
Majority | 636 | 17.6 | N/A | ||
Turnout | 3,622 | 34.3 | –4.6 | ||
Registered electors | 10,552 | ||||
Conservative gain from SLD | Swing | 11.4 |
Party | Candidate | Votes | % | ±% | |
---|---|---|---|---|---|
Conservative | J. Fielder* | 2,022 | 53.0 | +13.6 | |
Residents | J. Guntrip | 930 | 24.4 | +7.9 | |
SLD | P. Wybrew | 479 | 12.6 | –23.3 | |
Labour | T. Coldwell | 385 | 10.1 | +1.9 | |
Majority | 1,092 | 28.6 | +25.1 | ||
Turnout | 3,816 | 36.4 | –7.4 | ||
Registered electors | 10,480 | ||||
Conservative hold | Swing | 3.0 |
Party | Candidate | Votes | % | ±% | |
---|---|---|---|---|---|
Conservative | J. Pitman* | 2,474 | 64.4 | +19.0 | |
Labour | P. Shepherd | 696 | 18.1 | +5.0 | |
SLD | C. Pehrson | 674 | 17.5 | –24.0 | |
Majority | 1,778 | 46.3 | +42.5 | ||
Turnout | 3,844 | 42.2 | –1.5 | ||
Registered electors | 9,119 | ||||
Conservative hold | Swing | 7.0 |
Party | Candidate | Votes | % | ±% | |
---|---|---|---|---|---|
Conservative | R. Tucker | 2,555 | 60.1 | +5.1 | |
Labour | H. Hodgson | 855 | 20.1 | –0.3 | |
SLD | L. Wilson | 535 | 12.6 | –12.0 | |
Green | M. Whitear | 304 | 7.2 | N/A | |
Majority | 1,700 | 40.0 | +9.7 | ||
Turnout | 4,249 | 41.8 | –4.7 | ||
Registered electors | 10,159 | ||||
Conservative hold | Swing | 2.7 |
Party | Candidate | Votes | % | ±% | |
---|---|---|---|---|---|
Conservative | B. Smalley* | 2,494 | 57.1 | +8.3 | |
SLD | W. Powell | 1,217 | 27.9 | –11.8 | |
Labour | S. Peaple | 657 | 15.0 | +5.4 | |
Majority | 1,277 | 29.2 | +20.1 | ||
Turnout | 4,368 | 42.2 | +0.9 | ||
Registered electors | 10,360 | ||||
Conservative hold | Swing | 10.1 |
Party | Candidate | Votes | % | ±% | |
---|---|---|---|---|---|
Labour | G. Perrett* | 1,911 | 48.5 | +11.0 | |
Conservative | N. Edey | 1,436 | 36.4 | +2.4 | |
SLD | S. Knott | 381 | 9.7 | –17.2 | |
Green | B. Cheal | 216 | 5.5 | +4.0 | |
Majority | 475 | 12.0 | +8.5 | ||
Turnout | 3,944 | 45.2 | +0.7 | ||
Registered electors | 8,734 | ||||
Labour hold | Swing | 4.3 |
Party | Candidate | Votes | % | ±% | |
---|---|---|---|---|---|
Conservative | P. Dye | 2,287 | 44.2 | +10.7 | |
SLD | M. Coleman* | 2,194 | 42.4 | –10.3 | |
Labour | G. Page | 693 | 13.4 | +1.8 | |
Majority | 93 | 1.8 | N/A | ||
Turnout | 5,174 | 47.3 | –2.6 | ||
Registered electors | 10,936 | ||||
Conservative gain from SLD | Swing | 10.5 |
Party | Candidate | Votes | % | ±% | |
---|---|---|---|---|---|
Conservative | D. Palmer | 2,144 | 53.7 | +7.9 | |
SLD | J. Wing | 1,095 | 27.4 | –3.3 | |
Labour | M. Evans | 751 | 18.8 | –1.9 | |
Majority | 1,049 | 26.3 | +11.2 | ||
Turnout | 3,990 | 39.7 | –1.5 | ||
Registered electors | 10,050 | ||||
Conservative hold | Swing | 5.6 |
Party | Seats | +/- | Votes | % | +/- | |
---|---|---|---|---|---|---|
Conservative | 4 | 11,911 | 48.4 | +5.9 | ||
Labour | 2 | 8,155 | 33.2 | +6.8 | ||
SLD | 1 | 3,261 | 13.3 | –18.0 | ||
SDP | 0 | 870 | 3.5 | N/A | ||
Independent | 0 | 396 | 1.6 | N/A | ||
Total | 7 | 24,593 | 36.3 | –7.3 | ||
Registered electors | 67,806 | – | +3.8 |
Division results
Party | Candidate | Votes | % | ±% | |
---|---|---|---|---|---|
Conservative | J. Hudson* | 1,627 | 59.6 | +7.6 | |
SLD | M. Colne | 750 | 27.5 | –10.1 | |
Labour | D. Bearfield | 353 | 12.9 | +2.5 | |
Majority | 877 | 32.1 | +17.7 | ||
Turnout | 2,730 | 35.3 | –4.9 | ||
Registered electors | 7,733 | ||||
Conservative hold | Swing | 8.9 |
Party | Candidate | Votes | % | ±% | |
---|---|---|---|---|---|
SLD | M. Colne* | 2,359 | 57.6 | –2.0 | |
Conservative | B. Flashman | 1,369 | 33.4 | +5.9 | |
Labour | S. Mercado | 370 | 9.0 | –3.8 | |
Majority | 990 | 24.2 | –7.9 | ||
Turnout | 4,098 | 40.7 | –12.8 | ||
Registered electors | 10,068 | ||||
SLD hold | Swing | 4.0 |
Party | Candidate | Votes | % | ±% | |
---|---|---|---|---|---|
Labour | B. York* | 2,189 | 50.0 | +8.7 | |
Conservative | D. Chettleburgh | 1,782 | 40.7 | –0.2 | |
SDP | M. Kirsh | 259 | 5.9 | N/A | |
SLD | R. Kutchinsky | 152 | 3.5 | –14.4 | |
Majority | 407 | 9.3 | +8.9 | ||
Turnout | 4,382 | 41.3 | –3.7 | ||
Registered electors | 10,598 | ||||
Labour hold | Swing | 4.5 |
Party | Candidate | Votes | % | ±% | |
---|---|---|---|---|---|
Labour | K. Metcalf* | 2,125 | 66.7 | +6.1 | |
Conservative | A. Savage | 757 | 23.8 | +2.8 | |
SDP | W. Morgan | 303 | 9.5 | N/A | |
Majority | 1,368 | 43.0 | +3.4 | ||
Turnout | 3,185 | 30.1 | –5.7 | ||
Registered electors | 10,575 | ||||
Labour hold | Swing | 1.7 |
Party | Candidate | Votes | % | ±% | |
---|---|---|---|---|---|
Conservative | A. Gray | 1,894 | 72.8 | +10.4 | |
Labour | P. Bradbury | 709 | 27.2 | +12.1 | |
Majority | 1,185 | 45.5 | +5.5 | ||
Turnout | 2,603 | 30.9 | –9.1 | ||
Registered electors | 8,428 | ||||
Conservative hold | Swing | 0.9 |
Party | Candidate | Votes | % | ±% | |
---|---|---|---|---|---|
Conservative | R. Fielding* | 2,168 | 63.8 | +9.7 | |
Labour | J. Bradbury | 1,228 | 36.2 | +18.2 | |
Majority | 940 | 27.7 | +1.5 | ||
Turnout | 3,396 | 34.8 | –4.5 | ||
Registered electors | 9,751 | ||||
Conservative hold | Swing | 4.3 |
Party | Candidate | Votes | % | ±% | |
---|---|---|---|---|---|
Conservative | H. Saunders* | 2,314 | 55.1 | +8.2 | |
Labour | P. Coleman | 1,181 | 28.1 | +1.7 | |
Independent | A. Mallach | 396 | 9.4 | N/A | |
SDP | R. Brown | 308 | 7.3 | N/A | |
Majority | 1,133 | 27.0 | +6.8 | ||
Turnout | 4,199 | 39.4 | –9.7 | ||
Registered electors | 10,653 | ||||
Conservative hold | Swing | 3.3 |
Party | Seats | +/- | Votes | % | +/- | |
---|---|---|---|---|---|---|
Conservative | 6 | 3 | 17,001 | 44.6 | +7.6 | |
Labour | 3 | 1 | 12,556 | 32.9 | +4.8 | |
SLD | 0 | 2 | 5,475 | 14.4 | –16.8 | |
Residents | 0 | 1,536 | 4.0 | +0.3 | ||
SDP | 0 | 1,458 | 3.8 | N/A | ||
Green | 0 | 123 | 0.3 | N/A | ||
Total | 9 | 38,149 | 44.8 | –6.2 | ||
Registered electors | 85,100 | – | +2.7 |
Division results
Party | Candidate | Votes | % | ±% | |
---|---|---|---|---|---|
Labour | F. Peacock* | 2,107 | 43.3 | +6.3 | |
Residents | K. Logan | 1,536 | 31.6 | +3.2 | |
Conservative | W. Charlton-Wright | 771 | 15.9 | –7.3 | |
SLD | P. Clark | 229 | 4.7 | –6.7 | |
Green | C. Hanna | 123 | 2.5 | N/A | |
SDP | M. Randall | 95 | 2.0 | N/A | |
Majority | 571 | 11.7 | +3.1 | ||
Turnout | 4,861 | 46.2 | –6.4 | ||
Registered electors | 10,513 | ||||
Labour hold | Swing | 5.3 |
Party | Candidate | Votes | % | ±% | |
---|---|---|---|---|---|
Conservative | D. Ashley* | 1,875 | 55.1 | +4.6 | |
Labour | S. Tendeter | 612 | 18.0 | +6.3 | |
SLD | R. Canning | 525 | 15.4 | –22.3 | |
SDP | V. Taylor | 391 | 11.5 | N/A | |
Majority | 1,263 | 37.1 | +24.3 | ||
Turnout | 3,403 | 43.7 | –5.5 | ||
Registered electors | 7,780 | ||||
Conservative hold | Swing | 1.7 |
Party | Candidate | Votes | % | ±% | |
---|---|---|---|---|---|
Conservative | R. Ellis | 2,344 | 61.7 | +11.1 | |
Labour | C. Brindle | 877 | 23.1 | +3.0 | |
SLD | J. Heath | 581 | 15.3 | –14.0 | |
Majority | 1,467 | 38.6 | +17.2 | ||
Turnout | 3,802 | 42.5 | –2.5 | ||
Registered electors | 8,946 | ||||
Conservative hold | Swing | 4.1 |
Party | Candidate | Votes | % | ±% | |
---|---|---|---|---|---|
Conservative | V. Crellin | 2,244 | 45.4 | +15.7 | |
Labour | W. Bifield | 2,124 | 42.9 | +0.1 | |
SLD | R. Sprigge | 320 | 6.5 | –21.1 | |
SDP | G. Wellfare | 260 | 5.3 | N/A | |
Majority | 30 | 2.4 | N/A | ||
Turnout | 5,038 | 44.0 | –5.5 | ||
Registered electors | 11,253 | ||||
Conservative gain from Labour | Swing | 7.8 |
Party | Candidate | Votes | % | ±% | |
---|---|---|---|---|---|
Labour | M. Kearns* | 2,184 | 57.8 | +13.2 | |
Conservative | D. Murphy | 1,136 | 30.1 | +2.6 | |
SLD | R. Streeter | 458 | 12.1 | –15.8 | |
Majority | 1,048 | 27.7 | +11.0 | ||
Turnout | 3,778 | 41.1 | –10.0 | ||
Registered electors | 9,193 | ||||
Labour hold | Swing | 5.3 |
Party | Candidate | Votes | % | ±% | |
---|---|---|---|---|---|
Conservative | A. Burrows | 2,563 | 49.0 | +16.0 | |
Labour | N. Horwood | 1,214 | 23.2 | +3.3 | |
SLD | S. Tustin | 972 | 18.6 | –28.5 | |
SDP | R. Ashton | 483 | 9.2 | N/A | |
Majority | 1,349 | 25.8 | N/A | ||
Turnout | 5,232 | 49.7 | –9.3 | ||
Registered electors | 10,529 | ||||
Conservative gain from SLD | Swing | 6.4 |
Party | Candidate | Votes | % | ±% | |
---|---|---|---|---|---|
Conservative | B. Goble* | 2,233 | 61.3 | +4.0 | |
Labour | R. Leete | 758 | 20.8 | +3.3 | |
SLD | S. Jarvis | 651 | 17.9 | –7.3 | |
Majority | 1,475 | 40.5 | +8.3 | ||
Turnout | 3,642 | 48.3 | +0.6 | ||
Registered electors | 7,548 | ||||
Conservative hold | Swing | 0.4 |
Party | Candidate | Votes | % | ±% | |
---|---|---|---|---|---|
Labour | D. Billing* | 1,860 | 48.3 | +5.8 | |
Conservative | F. Howett | 1,445 | 37.5 | +6.8 | |
SLD | J. Sefton | 548 | 14.2 | –12.6 | |
Majority | 415 | 10.8 | –1.0 | ||
Turnout | 3,853 | 42.8 | –2.7 | ||
Registered electors | 9,004 | ||||
Labour hold | Swing | 0.5 |
Party | Candidate | Votes | % | ±% | |
---|---|---|---|---|---|
Conservative | L. Doyle | 2,390 | 51.6 | +8.5 | |
SLD | P. Kennington* | 1,191 | 25.7 | –18.4 | |
Labour | R. King | 820 | 17.7 | +4.9 | |
SDP | M. Harrison | 229 | 4.9 | N/A | |
Majority | 1,199 | 25.9 | N/A | ||
Turnout | 4,630 | 44.8 | –12.2 | ||
Registered electors | 10,334 | ||||
Conservative gain from SLD | Swing | 13.5 |
Party | Seats | +/- | Votes | % | +/- | |
---|---|---|---|---|---|---|
Conservative | 5 | 19,125 | 43.0 | +2.8 | ||
SLD | 3 | 1 | 14,339 | 32.2 | –8.0 | |
Labour | 2 | 1 | 11,026 | 24.8 | +5.9 | |
Total | 10 | 44,490 | 46.7 | –3.8 | ||
Registered electors | 95,220 | – | +1.5 |
Division results
Party | Candidate | Votes | % | ±% | |
---|---|---|---|---|---|
Conservative | J. Hudson* | 2,672 | 55.2 | +9.6 | |
SLD | C. Canfield | 1,396 | 28.8 | –12.5 | |
Labour | B. Saffery | 773 | 16.0 | +5.1 | |
Majority | 1,276 | 26.4 | +22.1 | ||
Turnout | 4,841 | 44.7 | –8.7 | ||
Registered electors | 10,824 | ||||
Conservative hold | Swing | 11.1 |
Party | Candidate | Votes | % | ±% | |
---|---|---|---|---|---|
Conservative | I. Tarry* | 2,731 | 65.8 | +8.3 | |
SLD | G. Willey | 867 | 20.9 | –12.7 | |
Labour | D. Crew | 555 | 13.4 | +6.5 | |
Majority | 1,864 | 44.9 | +21.1 | ||
Turnout | 4,153 | 41.3 | –7.1 | ||
Registered electors | 10,059 | ||||
Conservative hold | Swing | 10.5 |
Party | Candidate | Votes | % | ±% | |
---|---|---|---|---|---|
Conservative | K. Haywood | 1,723 | 45.7 | +3.4 | |
SLD | P. Halpin | 1,566 | 41.5 | –5.6 | |
Labour | J. Bellchambers | 485 | 12.9 | +3.8 | |
Majority | 157 | 4.2 | –0.6 | ||
Turnout | 3,774 | 43.6 | –4.3 | ||
Registered electors | 8,652 | ||||
Conservative gain from SLD | Swing | 4.5 |
Party | Candidate | Votes | % | ±% | |
---|---|---|---|---|---|
SLD | G. Tattersfield* | 1,696 | 40.5 | +0.5 | |
Conservative | D. Adkins | 1,328 | 31.7 | –2.7 | |
Labour | C. Donovan | 1,162 | 27.8 | +2.2 | |
Majority | 368 | 8.8 | +3.3 | ||
Turnout | 4,186 | 47.3 | –5.6 | ||
Registered electors | 8,853 | ||||
SLD hold | Swing | 1.8 |
Party | Candidate | Votes | % | ±% | |
---|---|---|---|---|---|
SLD | C. Gunner | 2,199 | 46.5 | –4.2 | |
Conservative | C. Ellis | 1,443 | 30.5 | –1.4 | |
Labour | C. Hayward | 1,088 | 23.0 | +5.7 | |
Majority | 756 | 16.0 | –2.8 | ||
Turnout | 4,730 | 47.9 | –3.8 | ||
Registered electors | 9,866 | ||||
SLD hold | Swing | 1.4 |
Party | Candidate | Votes | % | ±% | |
---|---|---|---|---|---|
Conservative | A. Hill* | 1,987 | 38.1 | –0.9 | |
Labour | D. Allan | 1,617 | 31.0 | +8.1 | |
SLD | R. Biddle | 1,607 | 30.8 | –7.3 | |
Majority | 370 | 7.1 | +6.1 | ||
Turnout | 5,211 | 53.3 | +0.2 | ||
Registered electors | 9,780 | ||||
Conservative hold | Swing | 4.5 |
Party | Candidate | Votes | % | ±% | |
---|---|---|---|---|---|
Conservative | R. Scranage* | 2,196 | 49.2 | +4.4 | |
SLD | P. King | 1,729 | 38.7 | –3.0 | |
Labour | K. Holmes | 538 | 12.1 | +0.1 | |
Majority | 467 | 10.5 | +7.4 | ||
Turnout | 4,463 | 49.2 | +0.7 | ||
Registered electors | 9,077 | ||||
Conservative hold | Swing | 3.7 |
Party | Candidate | Votes | % | ±% | |
---|---|---|---|---|---|
Labour | Kerry Pollard | 2,204 | 44.8 | +12.9 | |
Conservative | R. Durrant* | 1,918 | 39.0 | –0.1 | |
SLD | J. Allen | 793 | 16.1 | –12.9 | |
Majority | 286 | 5.8 | N/A | ||
Turnout | 4,915 | 49.8 | –2.9 | ||
Registered electors | 9,876 | ||||
Labour gain from Conservative | Swing | 6.5 |
Party | Candidate | Votes | % | ±% | |
---|---|---|---|---|---|
SLD | M. Moore* | 1,960 | 44.2 | –8.3 | |
Conservative | A. Nowell | 1,954 | 44.0 | +7.7 | |
Labour | C. Leet | 523 | 11.8 | +0.6 | |
Majority | 6 | 0.1 | –16.1 | ||
Turnout | 4,437 | 44.4 | –3.1 | ||
Registered electors | 9,995 | ||||
SLD hold | Swing | 8.0 |
Party | Candidate | Votes | % | ±% | |
---|---|---|---|---|---|
Labour | M. Macmillan* | 2,081 | 55.1 | +11.3 | |
Conservative | H. Haynes | 1,173 | 31.0 | +2.5 | |
SLD | N. Wrigley | 526 | 13.9 | –13.8 | |
Majority | 908 | 24.0 | +8.8 | ||
Turnout | 3,780 | 45.9 | –2.6 | ||
Registered electors | 8,238 | ||||
Labour hold | Swing | 8.8 |
Party | Seats | +/- | Votes | % | +/- | |
---|---|---|---|---|---|---|
Labour | 6 | 1 | 11,729 | 56.8 | +9.4 | |
Conservative | 0 | 5,511 | 26.7 | +6.5 | ||
SLD | 0 | 1 | 3,171 | 15.3 | –17.0 | |
Green | 0 | 256 | 1.2 | N/A | ||
Total | 6 | 20,667 | 36.5 | –5.4 | ||
Registered electors | 56,602 | – | +1.5 |
Division results
Party | Candidate | Votes | % | ±% | |
---|---|---|---|---|---|
Labour | B. Underwood | 2,258 | 67.5 | +7.3 | |
Conservative | C. Aylin | 741 | 22.1 | +3.3 | |
SLD | R. Baskerville | 348 | 10.4 | –10.6 | |
Majority | 1,517 | 45.3 | +6.1 | ||
Turnout | 3,347 | 37.4 | –4.5 | ||
Registered electors | 8,956 | ||||
Labour hold | Swing | 2.0 |
Party | Candidate | Votes | % | ±% | |
---|---|---|---|---|---|
Labour | M. Warren | 2,045 | 57.1 | +14.8 | |
Conservative | A. Finch | 826 | 23.1 | +5.2 | |
SLD | K. Taylor | 712 | 19.9 | –19.8 | |
Majority | 1,219 | 34.0 | +31.4 | ||
Turnout | 3,583 | 39.0 | –7.6 | ||
Registered electors | 9,181 | ||||
Labour hold | Swing | 4.8 |
Party | Candidate | Votes | % | ±% | |
---|---|---|---|---|---|
Labour | A. Campbell | 1,621 | 60.6 | +10.0 | |
Conservative | K. Murray | 589 | 22.0 | +2.7 | |
SLD | B. Clark | 466 | 17.4 | –12.7 | |
Majority | 1,032 | 38.6 | +18.1 | ||
Turnout | 2,676 | 33.8 | –4.5 | ||
Registered electors | 7,928 | ||||
Labour hold | Swing | 3.7 |
Party | Candidate | Votes | % | ±% | |
---|---|---|---|---|---|
Labour | R. Clark | 2,071 | 47.3 | +5.8 | |
Conservative | J. Halling | 1,750 | 39.9 | +7.5 | |
SLD | A. Christy | 561 | 12.8 | –13.4 | |
Majority | 321 | 7.3 | –1.8 | ||
Turnout | 4,382 | 41.5 | –2.1 | ||
Registered electors | 10,569 | ||||
Labour hold | Swing | 0.9 |
Party | Candidate | Votes | % | ±% | |
---|---|---|---|---|---|
Labour | S. Munden* | 2,132 | 68.9 | +9.5 | |
Conservative | L. Jordan | 612 | 19.8 | +4.4 | |
SLD | G. Wren | 350 | 11.3 | –13.9 | |
Majority | 1,520 | 49.1 | +14.9 | ||
Turnout | 3,094 | 32.9 | –1.8 | ||
Registered electors | 9,397 | ||||
Labour hold | Swing | 2.6 |
Party | Candidate | Votes | % | ±% | |
---|---|---|---|---|---|
Labour | P. Alexander | 1,602 | 44.7 | +7.8 | |
Conservative | S. Woods | 993 | 27.7 | +12.9 | |
SLD | C. Lewis | 734 | 20.5 | –27.8 | |
Green | M. Fowler | 256 | 7.1 | N/A | |
Majority | 609 | 17.0 | N/A | ||
Turnout | 3,585 | 33.9 | –11.2 | ||
Registered electors | 10,571 | ||||
Labour gain from SLD | Swing | 2.6 |
Party | Seats | +/- | Votes | % | +/- | |
---|---|---|---|---|---|---|
Conservative | 5 | 2 | 14,516 | 51.0 | +9.9 | |
SLD | 1 | 2 | 8,346 | 29.4 | –12.1 | |
Labour | 1 | 5,574 | 19.6 | +2.2 | ||
Total | 7 | 28,436 | 42.2 | –3.7 | ||
Registered electors | 67,331 | – | –0.7 |
Division results
Party | Candidate | Votes | % | ±% | |
---|---|---|---|---|---|
SLD | P. Goggins | 2,046 | 36.6 | –4.1 | |
Conservative | M. Parsons | 1,876 | 33.5 | +0.8 | |
Labour | D. Meek | 1,673 | 29.9 | +3.3 | |
Majority | 170 | 3.0 | –5.1 | ||
Turnout | 5,595 | 45.2 | –4.0 | ||
Registered electors | 12,385 | ||||
SLD hold | Swing | 2.5 |
Party | Candidate | Votes | % | ±% | |
---|---|---|---|---|---|
Conservative | F. Cogan* | 2,132 | 56.6 | +5.7 | |
SLD | L. Bond | 1,395 | 37.0 | –2.9 | |
Labour | M. Hilmi | 241 | 6.4 | –2.8 | |
Majority | 737 | 19.6 | +8.6 | ||
Turnout | 3,768 | 43.2 | –4.3 | ||
Registered electors | 8,715 | ||||
Conservative hold | Swing | 4.3 |
Party | Candidate | Votes | % | ±% | |
---|---|---|---|---|---|
Conservative | F. Williams | 1,755 | 43.8 | +10.2 | |
SLD | T. Ambrose | 1,731 | 43.2 | –9.6 | |
Labour | N. Crump | 519 | 13.0 | –0.7 | |
Majority | 24 | 0.6 | N/A | ||
Turnout | 4,005 | 47.4 | –0.1 | ||
Registered electors | 8,449 | ||||
Conservative gain from SLD | Swing | 9.9 |
Party | Candidate | Votes | % | ±% | |
---|---|---|---|---|---|
Conservative | R. Johnson | 2,591 | 78.4 | +9.3 | |
SLD | W. Parkinson | 426 | 12.9 | –10.1 | |
Labour | A. Tinsley | 287 | 8.7 | +0.8 | |
Majority | 2,165 | 65.5 | +19.5 | ||
Turnout | 3,304 | 39.3 | –5.6 | ||
Registered electors | 8,400 | ||||
Conservative hold | Swing | 9.7 |
Party | Candidate | Votes | % | ±% | |
---|---|---|---|---|---|
Conservative | W. Buckland | 2,661 | 67.8 | +16.4 | |
SLD | A. Bannister | 882 | 22.5 | –26.1 | |
Labour | D. Lake | 379 | 9.7 | N/A | |
Majority | 1,779 | 45.4 | +42.5 | ||
Turnout | 3,922 | 41.2 | –2.4 | ||
Registered electors | 9,529 | ||||
Conservative hold | Swing | 21.3 |
Party | Candidate | Votes | % | ±% | |
---|---|---|---|---|---|
Conservative | G. Button | 2,786 | 55.6 | +20.6 | |
SLD | E. Waller | 1,542 | 30.8 | –23.5 | |
Labour | N. Doggett | 679 | 13.6 | +2.9 | |
Majority | 1,244 | 24.8 | N/A | ||
Turnout | 5,007 | 47.6 | –1.6 | ||
Registered electors | 10,526 | ||||
Conservative gain from SLD | Swing | 22.1 |
Party | Candidate | Votes | % | ±% | |
---|---|---|---|---|---|
Labour | D. Waddington* | 1,796 | 63.4 | +3.9 | |
Conservative | N. Woodhouse | 715 | 25.2 | +7.6 | |
SLD | J. Maher | 324 | 11.4 | –11.5 | |
Majority | 1,081 | 38.1 | +1.4 | ||
Turnout | 2,835 | 30.4 | –5.6 | ||
Registered electors | 9,327 | ||||
Labour hold | Swing | 1.9 |
Party | Seats | +/- | Votes | % | +/- | |
---|---|---|---|---|---|---|
Labour | 4 | 1 | 10,978 | 48.0 | +5.3 | |
Conservative | 2 | 1 | 8,714 | 38.1 | +4.4 | |
SLD | 0 | 3,189 | 13.9 | –9.3 | ||
Total | 6 | 22,881 | 40.4 | –0.8 | ||
Registered electors | 56,633 | – | ±0.0 |
Division results
Party | Candidate | Votes | % | ±% | |
---|---|---|---|---|---|
Labour | E. McNally | 1,912 | 65.8 | +4.2 | |
Conservative | J. Pike | 702 | 24.2 | +3.9 | |
SLD | K. Waddup | 292 | 10.0 | –8.1 | |
Majority | 1,210 | 41.6 | +0.3 | ||
Turnout | 2,906 | 35.0 | –1.7 | ||
Registered electors | 8,293 | ||||
Labour hold | Swing | 0.2 |
Party | Candidate | Votes | % | ±% | |
---|---|---|---|---|---|
Conservative | J. Price | 1,695 | 41.6 | +5.5 | |
Labour | A. Ramsden* | 1,672 | 41.0 | +0.4 | |
SLD | E. Pitkin | 709 | 17.4 | –5.9 | |
Majority | 23 | 0.6 | N/A | ||
Turnout | 4,076 | 43.3 | ±0.0 | ||
Registered electors | 9,415 | ||||
Conservative gain from Labour | Swing | 2.6 |
Party | Candidate | Votes | % | ±% | |
---|---|---|---|---|---|
Labour | R. Fricker* | 2,265 | 53.7 | +7.0 | |
Conservative | I. Dunn | 1,483 | 35.2 | +7.6 | |
SLD | J. Richmond | 471 | 11.2 | –12.7 | |
Majority | 782 | 18.5 | –0.6 | ||
Turnout | 4,219 | 40.5 | –1.9 | ||
Registered electors | 10,421 | ||||
Labour hold | Swing | 0.3 |
Party | Candidate | Votes | % | ±% | |
---|---|---|---|---|---|
Conservative | R. Gordon | 2,353 | 63.3 | +6.2 | |
SLD | P. Jenkins | 793 | 21.3 | –8.8 | |
Labour | T. Meldrum | 574 | 15.4 | +2.6 | |
Majority | 1,560 | 41.9 | +14.9 | ||
Turnout | 3,720 | 40.8 | –7.9 | ||
Registered electors | 9,114 | ||||
Conservative hold | Swing | 7.5 |
Party | Candidate | Votes | % | ±% | |
---|---|---|---|---|---|
Labour | S. Meldrum* | 2,064 | 59.7 | +3.1 | |
Conservative | J. Doherty | 1,002 | 29.0 | +1.7 | |
SLD | M. Baird | 389 | 11.3 | –4.9 | |
Majority | 1,062 | 30.7 | –1.4 | ||
Turnout | 3,455 | 35.6 | +2.0 | ||
Registered electors | 9,713 | ||||
Labour hold | Swing | 0.7 |
Party | Candidate | Votes | % | ±% | |
---|---|---|---|---|---|
Labour | D. Williams | 2,491 | 55.3 | +8.6 | |
Conservative | S. Jones | 1,479 | 32.8 | +4.1 | |
SLD | D. Scudder | 535 | 11.9 | –12.7 | |
Majority | 1,012 | 22.5 | +4.4 | ||
Turnout | 4,505 | 46.6 | +3.7 | ||
Registered electors | 9,677 | ||||
Labour hold | Swing | 2.3 |
Party | Seats | +/- | Votes | % | +/- | |
---|---|---|---|---|---|---|
Labour | 5 | 14,937 | 48.5 | +2.1 | ||
Conservative | 2 | 11,807 | 38.3 | +5.5 | ||
SLD | 0 | 3,428 | 11.1 | –9.7 | ||
SDP | 0 | 428 | 1.4 | N/A | ||
Green | 0 | 226 | 0.7 | N/A | ||
Total | 7 | 30,826 | 48.1 | –0.1 | ||
Registered electors | 64,089 | – | ±0.0 |
Division results
Party | Candidate | Votes | % | ±% | |
---|---|---|---|---|---|
Labour | M. Nash | 2,519 | 57.9 | +1.3 | |
Conservative | S. Hudson | 1,212 | 27.9 | +4.3 | |
SLD | D. Cooke | 393 | 9.0 | –10.8 | |
Green | D. Ashton | 226 | 5.2 | N/A | |
Majority | 1,307 | 30.0 | –3.0 | ||
Turnout | 4,350 | 43.9 | +0.7 | ||
Registered electors | 9,907 | ||||
Labour hold | Swing | 1.5 |
Party | Candidate | Votes | % | ±% | |
---|---|---|---|---|---|
Conservative | H. Burningham | 2,061 | 54.5 | +13.2 | |
Labour | C. Longworth | 1,263 | 33.4 | –4.9 | |
SLD | J. Monro | 455 | 12.0 | –8.4 | |
Majority | 798 | 21.1 | +18.2 | ||
Turnout | 3,779 | 45.5 | +2.3 | ||
Registered electors | 8,307 | ||||
Conservative hold | Swing | 9.1 |
Party | Candidate | Votes | % | ±% | |
---|---|---|---|---|---|
Labour | S. Clark* | 2,323 | 57.3 | +8.8 | |
Conservative | M. Carse | 1,279 | 31.5 | +1.5 | |
SLD | L. Ferris | 455 | 11.2 | –10.3 | |
Majority | 1,044 | 25.7 | +7.1 | ||
Turnout | 4,057 | 46.2 | –0.3 | ||
Registered electors | 8,788 | ||||
Labour hold | Swing | 3.7 |
Party | Candidate | Votes | % | ±% | |
---|---|---|---|---|---|
Labour | G. Wenham* | 2,040 | 55.0 | +6.5 | |
Conservative | J. Scarff | 1,292 | 34.9 | +6.9 | |
SLD | M. Richardson | 374 | 10.1 | –13.4 | |
Majority | 748 | 20.2 | –0.3 | ||
Turnout | 3,706 | 47.9 | –1.7 | ||
Registered electors | 7,732 | ||||
Labour hold | Swing | 0.2 |
Party | Candidate | Votes | % | ±% | |
---|---|---|---|---|---|
Conservative | M. Hall | 2,469 | 58.4 | +9.8 | |
Labour | B. Dodge | 1,170 | 27.7 | +1.5 | |
SLD | I. Skidmore | 589 | 13.9 | –11.3 | |
Majority | 1,299 | 30.7 | +8.3 | ||
Turnout | 4,228 | 45.9 | –0.9 | ||
Registered electors | 9,203 | ||||
Conservative hold | Swing | 4.2 |
Party | Candidate | Votes | % | ±% | |
---|---|---|---|---|---|
Labour | D. Kerr | 2,853 | 62.7 | –8.6 | |
Conservative | K. Jones | 1,049 | 23.1 | –5.6 | |
SDP | J. Nichols | 428 | 9.4 | N/A | |
SLD | S. Porter | 219 | 4.8 | N/A | |
Majority | 1,804 | 39.7 | –2.9 | ||
Turnout | 4,549 | 52.6 | +8.6 | ||
Registered electors | 8,651 | ||||
Labour hold | Swing | 1.5 |
Party | Candidate | Votes | % | ±% | |
---|---|---|---|---|---|
Labour | R. Mays* | 2,769 | 45.0 | +4.4 | |
Conservative | L. Stanbury | 2,445 | 39.7 | +10.2 | |
SLD | C. Cory | 943 | 15.3 | –14.5 | |
Majority | 324 | 5.3 | –5.5 | ||
Turnout | 6,157 | 53.5 | –3.2 | ||
Registered electors | 11,501 | ||||
Labour hold | Swing | 2.9 |
East Hertfordshire is one of ten local government districts in Hertfordshire, England. Its council is based in Hertford, the county town of Hertfordshire. The largest town in the district is Bishop's Stortford, and the other main towns are Ware, Buntingford and Sawbridgeworth. At the 2011 Census, the population of the district was 137,687. By area it is the largest of the ten local government districts in Hertfordshire. The district borders North Hertfordshire, Stevenage, Welwyn Hatfield and Broxbourne in Hertfordshire, and Epping Forest, Harlow and Uttlesford in Essex.
North Hertfordshire is one of ten local government districts in the county of Hertfordshire, England. Its council is based in Letchworth Garden City and the largest town is Hitchin. The district also includes the towns of Baldock and Royston and numerous villages and surrounding rural areas. Part of the district lies within the Chiltern Hills, a designated Area of Outstanding Natural Beauty.
Three Rivers is a local government district in south-west Hertfordshire, England. Its council is based in Rickmansworth. The district borders Hertsmere, Watford, St Albans, Dacorum, Buckinghamshire, and the London boroughs of Hillingdon and Harrow.
Hertfordshire County Council is the upper-tier local authority for the non-metropolitan county of Hertfordshire, in England. The council was created in 1889. It is responsible for a wide range of public services in the county, including social care, transport, education, and the Hertfordshire Fire and Rescue Service. The Conservatives have held a majority of the seats on the council since 1999. The council is based at County Hall in Hertford.
One third of North Hertfordshire District Council in England is elected each year, followed by one year without election. A boundary review is underway to allow the council to instead be elected all at once every four years from 2024 onwards.
Hertfordshire County Council in England is elected every four years. Since the last boundary changes took effect in 2017 there have been 78 electoral divisions electing one councillor each.
Elections to Dacorum Borough Council in Hertfordshire, England were held on 3 May 2007. The whole council was up for election with boundary changes since the last election in 2003 reducing the number of seats by one. The Conservative Party remained in overall control of the council after winning 44 of the 51 seats which they partly attributed to national events, while the Liberal Democrats lost 2 seats but were pleased to become the official opposition.
The 1998 St Albans City and District Council election took place on 7 May 1998 to elect members of St Albans City and District Council in Hertfordshire, England. One third of the council was up for election and the Liberal Democrats stayed in overall control of the council.
The 1999 St Albans City and District Council election took place on 6 May 1999 to elect members of St Albans City and District Council in Hertfordshire, England. The whole council was up for election with boundary changes since the last election in 1998 increasing the number of seats by 1. The Liberal Democrats lost overall control of the council to no overall control.
The 2000 St Albans City and District Council election took place on 4 May 2000 to elect members of St Albans District Council in Hertfordshire, England. One third of the council was up for election and the council stayed under no overall control.
The 2002 St Albans City and District Council election took place on 2 May 2002 to elect members of St Albans District Council in Hertfordshire, England. One third of the council was up for election and the council stayed under no overall control.
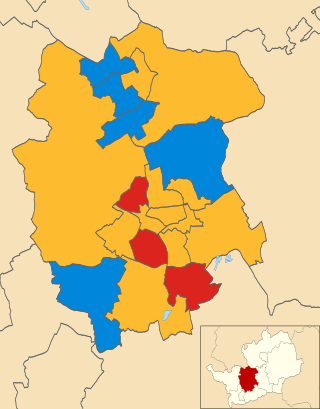
The 2003 St Albans City and District Council election took place on 1 May 2003 to elect members of St Albans District Council in Hertfordshire, England. One third of the council was up for election and the council stayed under no overall control.
The 2004 St Albans City and District Council election took place on 10 June 2004 to elect members of St Albans District Council in Hertfordshire, England. One third of the council was up for election and the council stayed under no overall control.
The 2006 St Albans City and District Council election took place on 4 May 2006 to elect members of St Albans District Council in Hertfordshire, England. One third of the council was up for election and the Liberal Democrats gained overall control of the council from no overall control.
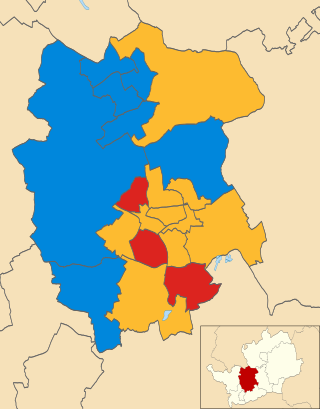
The 2007 St Albans City and District Council election took place on 3 May 2007 to elect members of St Albans District Council in Hertfordshire, England. One third of the council was up for election and the Liberal Democrats lost overall control of the council to no overall control.
Hertfordshire County Council elections was held on 1 May 1997, with all 77 seats contested. The Council remained under no overall control. The Conservatives formed the largest political group, but the Labour and Liberal Democrat groups formed a coalition to run the council.
An election to Hertfordshire County Council took place on 2 May 2013, as part of the 2013 United Kingdom local elections. 77 electoral divisions elected one county councilor each by first-past-the-post voting for a four-year term of office. The electoral divisions were the same as those used at the previous election in 2009.
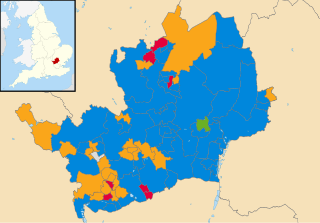
Elections to Hertfordshire County Council took place on 6 May 2021 alongside other local elections in the United Kingdom. All 78 seats to the council were elected.
Elections to Hertfordshire County Council were held on 6 May 1993, at the same time as other elections to county councils across England and Wales. All 77 seats on the county council were up for election.
The 1981 Hertfordshire County Council election took place on 7 May 1981 to elect members of Hertfordshire County Council in Hertfordshire, England. This was on the same day as other local elections.