1989 South Glamorgan County Council election

Last updated

The fifth election to South Glamorgan County Council was held in May 1989. [1] It was preceded by the 1985 election and followed by the 1993 election.

Contents

Boundary changes

There were no boundary changes at this election.

Candidates

Conservative and Labour candidates contested all seats. Following the break-up of the SDP-Liberal Alliance, most seats were contested by both the Social and Liberal Democrats and the continuing SDP. There were a smaller number of Plaid Cymru and Green Party candidates and a few Independents.

Outcome

Labour retained control with an increased majority, by capturing a number of Conservative seats. A few other seats also changed hands. The Social and Liberal Democrats held all their seats bar one, but polled poorly elsewhere. [n 1]

A by-election was held on the same day in the Vale of Glamorgan constituency. This resulted in a much higher turnout than usual for local elections in wards which lay within the constituency. Labour captured the parliamentary seat from the Conservatives.

This table summarises the result of the elections in all wards. 62 councillors were elected.

1989 South Glamorgan County Council: elected members
PartySeatsGainsLossesNet gain/lossSeats %Votes %Votes+/−
  Labour 4071+6
  Conservative 1805-5
  SLD 721+1
  SDP 102-2
  Plaid Cymru 1000

One of the Labour 'gains' was in Thornhill ward which the party had already won at a by-election.

Ward Results

Adamsdown

Adamsdown 1989
PartyCandidateVotes%±%
Labour Kenneth Hutchings* 1,522 77.0
Conservative D. Munton18019.0
Green E. Proud1346.8
SLD Nigel Howells864.4
Plaid Cymru Sian Edwards542.7
Majority
Turnout 37.2
Labour hold Swing

Baruc

Baruc 1989
PartyCandidateVotes%±%
Conservative J. Donovan 1,367 44.6
Labour F. Dobbs1,09635.8
SLD J. Tartaglia32410.6
Plaid Cymru E. Rees1645.4
SDP P. Hansen1133.7
Majority
Turnout 70.3
Conservative hold Swing

Butetown

Butetown 1989
PartyCandidateVotes%±%
Labour W. Kitson* 658 56.6
Independent Ben Foday33528.8
Conservative A. Martin14512.1
SLD M. Mader242.1
Majority
Turnout 52.7
Labour hold Swing

Buttrills

Buttrills 1989
PartyCandidateVotes%±%
Labour B. Lane* 1,907 65.5
Conservative J. Connell81528.0
SLD J. Prangley1906.5
Majority
Turnout 69.5
Labour hold Swing

Cadoc

Cadoc 1989
PartyCandidateVotes%±%
Labour S. James* 2,341 67.1
Conservative R. Barnes85524.5
SLD C. Southwell1404.0
Plaid Cymru M. Jeffries1203.4
Communist K. Stockdale330.9
Majority
Turnout 62.7
Labour hold Swing

Canton

Canton 1989
PartyCandidateVotes%±%
Labour Russell Goodway* 1,212 55.6
Conservative D. Mikelsons82738.0
SLD E. Williams1406.4
Majority
Turnout 46.0
Labour hold Swing

Castleland

Castleland 1989
PartyCandidateVotes%±%
Labour M. Sharp* 1,341 73.0
Conservative J. Bounds36418.6
SLD M. Yandall723.7
SDP A. Williams572.9
Communist M. Wallis351.8
Majority
Turnout 66.6
Labour hold Swing

Central

Central 1989
PartyCandidateVotes%±%
Labour C. Champion 643 42.3
SLD Fred Hornblow*60740.0
Conservative M. Yates18512.2
Plaid Cymru M. Williams845.5
Majority
Turnout 35.9
Labour gain from Liberal Democrats Swing

Cornerswell

Cornerswell 1989
PartyCandidateVotes%±%
Labour E. Tincknell* 1,437 45.4
Conservative J. Flanigan1,39444.1
SLD R. Morris2267.1
Plaid Cymru G. Ap Sion1073.4
Majority
Turnout 53.4
Labour hold Swing

Court

Court 1989
PartyCandidateVotes%±%
Labour S. Parsons 1,966 71.2
Conservative A. Price50518.3
Green K. Simpson1194.3
SLD S. O'Brien863.1
SDP D. Williams853.1
Majority
Turnout 71.6
Labour hold Swing

Cowbridge

Cowbridge 1989
PartyCandidateVotes%±%
Conservative R. Thomas* 2,458 55.9
Labour J. Jones1,61036.6
SLD J. Sully3287.5
Majority
Turnout 75.9
Conservative hold Swing

Cyncoed Village

Cyncoed Village 1989
PartyCandidateVotes%±%
SLD R. Holman 1,224 46.6
Conservative L.M. Harris1,13143.0
Labour A. Cox1726.5
SDP D. Thomas1023.9
Majority
Turnout 61.0
SLD hold Swing

Cyntwell

Cyntwell 1989
PartyCandidateVotes%±%
Labour B. Phillips* 947 64.5
SLD P. Gemson40427.5
Conservative A. Renwick1178.0
Majority
Turnout 39.9
Labour hold Swing

Deri

Deri 1989
PartyCandidateVotes%±%
Conservative M. Davies* 1,182 54.7
Labour S. Williams53424.7
Green G. Jones22510.4
SLD G. Hallett21910.1
Majority
Turnout 47.5
Conservative hold Swing

Dinas Powys North

Dinas Powys North 1989
PartyCandidateVotes%±%
Plaid Cymru Chris Franks* 1,599 45.0
Conservative B. McParlin1,08930.6
Labour J. Imperato60317.0
SLD M. Taylor1504.2
SDP F. Eason1163.3
Majority
Turnout 70.2
Plaid Cymru hold Swing

Dinas Powys South

Dinas Powys South 1989
PartyCandidateVotes%±%
Conservative A. Hill* 1,625 43.2
Labour R. Cox1,03427.5
Plaid Cymru E. Roberts74419.8
SDP M. James2085.5
SLD H. James1494.0
Majority
Turnout 66.7
Conservative hold Swing

Dyfan

Dyfan 1989
PartyCandidateVotes%±%
Labour C. Watkins* 1,511 53.5
Conservative J. Coombs1,00644.0
SLD C. Jones30910.9
Majority
Turnout 69.5
Labour hold Swing

Eglwys Wen

Eglwys Wen 1989
PartyCandidateVotes%±%
Labour A. Fennessy 1,372 44.0
Conservative L. Quinn*1,21839.1
Green M. Cottam2197.0
SLD A. Leavers1585.1
Plaid Cymru Alan Jobbins1504.8
Majority
Turnout 52.2
Labour gain from Conservative Swing

Fairwater

Fairwater 1989
PartyCandidateVotes%±%
Labour P. Jarvis 1,271 55.4
Conservative D. Norman55424.1
SDP R. Drake41117.9
SLD A. Wigley592.6
Majority
Turnout 43.1
Labour hold Swing

Gabalfa

Gabalfa 1989
PartyCandidateVotes%±%
Labour D. Campbell* 1,339 65.7
Conservative G. Porter42120.7
Green N. Thorne1477.2
SLD Cathy Pearcy1306.4
Majority
Turnout 44.2
Labour hold Swing

Gibbonsdown

Gibbonsdown 1989
PartyCandidateVotes%±%
Labour B. Murray* 2,006 73.1
Conservative S. Bravery52219.0
SLD J. Potter1144.2
Plaid Cymru S. Biddiscombe1023.7
Majority
Turnout 70.5
Labour hold Swing

Glan Ely

Glan Ely 1989
PartyCandidateVotes%±%
Labour Robert Morgan* 1,508 82.5
Conservative J. Bushrod21411.7
SLD H. Gemson1065.8
Majority
Turnout 32.8
Labour hold Swing

Heath Park

Heath Park 1989
PartyCandidateVotes%±%
Conservative Tony John 1,178 55.6
Labour P. Hampleton64330.3
SLD W. Monkley29814.1
Majority
Turnout 39.6
Conservative hold Swing

Highmead

Highmead 1989
PartyCandidateVotes%±%
Labour H. Gough* 1,479 77.9
Conservative D. Neale31316.5
SLD M. Rawnsley1075.6
Majority
Turnout 35.8
Labour hold Swing

Illtyd

Illtyd 1989
PartyCandidateVotes%±%
Labour Matthew Griffiths 1,825 47.0
Conservative E. Williams*1,68941.8
SLD K. Wade1964.9
Plaid Cymru S. Baker1654.1
SDP R. Lewis1624.0
Majority
Turnout 70.4
Labour gain from Conservative Swing

Lakeside

Lakeside 1989
PartyCandidateVotes%±%
SLD W. Congreve 949 37.7
Conservative J. Dickson90535.9
SDP Anthony Jeremy*45918.2
Labour D. Bevan2068.2
Majority
Turnout 54.9
SLD gain from SDP Swing

Landsdowne

Landsdowne 1989
PartyCandidateVotes%±%
Labour Cherry Short 1,623 66.2
Conservative J. Courtis63325.8
SLD P. Crees1978.0
Majority
Turnout 41.6
Labour hold Swing

Lisvane with St Mellons

Lisvane with St Mellons 1989
PartyCandidateVotes%±%
Conservative H. Campbell 1,256 77.6
Labour M. Harries28817.8
SLD V. Pearcey754.6
Majority
Turnout 34.6
Conservative hold Swing

Llandaff

Llandaff 1989
PartyCandidateVotes%±%
Conservative Julius Hermer* 1,458 48.7
Labour R. Watson77525.6
SDP D. Marshall36812.1
SLD W. Slack2548.4
Plaid Cymru S. Morgan1755.8
Majority
Turnout 45.2
Conservative hold Swing

Llandaff North

Llandaff North 1989
PartyCandidateVotes%±%
Labour A. Hearne* 1,883 71.4
Conservative D. Harris58122.0
SLD C. Pearcey1756.6
Majority
Turnout 42.8
Labour hold Swing

Llanedeyrn

Llanedeyrn 1989
PartyCandidateVotes%±%
SDP Vita Jones* 1,191 48.1
Labour R. Longsworth87035.1
Conservative W. Pursey25710.4
SLD C. Ribton1004.0
Plaid Cymru A. Morgan602.4
Majority
Turnout 37.0
SDP hold Swing

Llanrumney North

Llanrumney North 1989
PartyCandidateVotes%±%
Labour B. Lawes 1,413 83.8
Conservative R. Robinson27316.2
Majority
Turnout 36.1
Labour hold Swing

Llanrumney South

Llanrumney South 1989
PartyCandidateVotes%±%
Labour D. Francis* 1,336 74.5
Conservative M. Evans45725.5
Majority
Turnout 36.1
Labour hold Swing

Mackintosh

Mackintosh 1989
PartyCandidateVotes%±%
Labour Julie Morgan* 1,427 60.1
Conservative R. Attwell39616.7
SLD E. Atwell36415.5
Green C. Von-Ruhland1265.3
Plaid Cymru A. Fearon632.7
Majority
Turnout 44.4
Labour hold Swing

Maindy

Maindy 1989
PartyCandidateVotes%±%
SLD J. Toye 1,148 45.6
Labour Reginald Surridge1,08343.1
Conservative N. Hutton28411.3
Majority
Turnout 45.6
Alliance hold Swing

North Whitchurch with Tongwynlais

North Whitchurch with Tongwynlais 1989
PartyCandidateVotes%±%
Labour W. Salmon 1,579 53.4
Conservative R. Evans*1,14743.1
SLD H. Howell2317.8
Majority
Turnout 52.2
Labour gain from Conservative Swing

Pantllacca

Pantllacca 1989
PartyCandidateVotes%±%
SLD K. Holman 687 38.8
Labour R. Austin60634.3
Conservative E. Bainbridge31818.0
SDP D. Steele1076.0
Green G. John512.9
Majority
Turnout 34.8
Liberal Democrats hold Swing

Pantmawr

Pantmawr 1989
PartyCandidateVotes%±%
Conservative Gareth Neale* 1,298 55.2
Labour L. Jenkins60725.8
SLD J. Brent44619.0
Majority
Turnout 46.0
Conservative hold Swing

Park

Park 1989
PartyCandidateVotes%±%
Labour Sue Lent 1,067 44.5
SLD P.K. Verma58424.3
Conservative S. Evans51521.5
Green P. Ward2339.7
Majority
Turnout 35.2
Labour hold Swing

Pentre Bane

Pentre Bane 1989
PartyCandidateVotes%±%
Labour Caerwyn Roderick* 1,381 70.5
Conservative C. Ward29014.8
SDP D. Griffin23211.8
SLD I. Isaacs552.8
Majority
Turnout 38.8
Labour hold Swing

Penylan

Penylan 1989
PartyCandidateVotes%±%
Conservative G. Hughes 1,088 53.0
Labour R. Rees48123.4
SLD D. Rees34817.0
SDP S. Jeremy1366.6
Majority
Turnout 43.2
Conservative hold Swing

Plymouth

Plymouth 1989
PartyCandidateVotes%±%
Conservative D. Turner 1,181 55.6
Labour L. Smith54525.6
SLD R. Francis40018.8
Majority
Turnout 49.2
Conservative hold Swing

Pontcanna

Pontcanna 1989
PartyCandidateVotes%±%
Labour Mark Drakeford* 1,390 61.7
Conservative J. Hallinan56325.0
Plaid Cymru N. Hodges2199.7
SLD D. Mytton823,6
Majority
Turnout 46.5
Labour hold Swing

Radyr with St Fagans

Radyr with St Fagans 1989
PartyCandidateVotes%±%
SDP Marian Drake* 994 45.7
Conservative D. Philpott79236.4
Labour M. Smith34916.1
SLD Roger Burley391.8
Majority
Turnout 55.4
SDP hold Swing

Rhoose with Llancarfan

Rhoose with Llancarfan 1989
PartyCandidateVotes%±%
Conservative H. James* 1,715 60.6
Labour N. Chapman82829.3
SLD C. Arnot28710.1
Majority
Turnout 72.0
Conservative hold Swing

Riverside South

Riverside South 1989
PartyCandidateVotes%±%
Labour Jane Hutt* 1,354 79.0
Conservative P. Young25014.6
Plaid Cymru C. Ap Henri1096.4
Majority
Turnout 40.2
Labour hold Swing

Rumney

Rumney 1989
PartyCandidateVotes%±%
Labour M. Payne 1,729 58.1
Conservative J. Joslyn1,24841.9
Majority
Turnout 43.9
Labour hold Swing

Saltmead

Saltmead 1989
PartyCandidateVotes%±%
Labour D. Richards* 1,548 73.0
Conservative W. Selwood57327.0
Majority
Turnout 44.4
Labour hold Swing

Splott

Splott 1989
PartyCandidateVotes%±%
Labour Jack Brooks* 1,588 74.0
Conservative J. Kingston36617.1
SLD S. Ahmed1075.0
Plaid Cymru Barbara Anglezarke854.0
Majority56.9
Turnout 44.0
Labour hold Swing

St Athan with Boverton

St Athan with Boverton 1989
PartyCandidateVotes%±%
Labour B. Doughty 1,253 47.0
Conservative J. George*1,11641.9
SDP K. Owen1445.4
Plaid Cymru S. Stephens973.6
SLD D. Poor542.0
Majority
Turnout 54.5
Labour gain from Conservative Swing

St Augustines

St Augustines 1989
PartyCandidateVotes%±%
Labour P. Gray* 919 43.4
Conservative P. Blyth62029.3
SLD J. Sibert46521.9
Plaid Cymru M. Harries1155.4
Majority
Turnout 47.2
Labour hold Swing

Stanwell

Stanwell 1989
PartyCandidateVotes%±%
Labour I. Dewar* 1,047 59.2
Conservative R. Williams57632.6
SLD L. Beard784.4
Plaid Cymru A. Packar683.8
Majority
Turnout 58.2
Labour hold Swing

The Marl

The Marl 1989
PartyCandidateVotes%±%
Labour Peter Perkins* 941 48.9
Conservative J. Summerhayes47524.9
Independent A. Baber45723.7
SLD A. Ali522.7
Majority
Turnout 46.5
Labour hold Swing

Thornhill

The seat had been won by an Alliance (SDP) candidate in 1985 but was gained by Labour at a subsequent by-election.

Thornhill 1989
PartyCandidateVotes%±%
Labour Nicholas Butler* 1,637 37.6
Conservative H. Philpott1,16131.7
SLD V. Hallet69919.1
SDP E. Heaven1604.4
Majority
Turnout 55.2
Labour hold Swing

Ton-yr-Ywen

Ton-yr-Ywen 1989
PartyCandidateVotes%±%
Conservative B. Rees* 929 48.1
Labour L. Poole52927.4
Green M. Evans24412.6
SLD K. Bowden23011.9
Majority
Turnout 45.2
Conservative hold Swing

Trelai

Trelai 1989
PartyCandidateVotes%±%
SLD Jacqui Gasson 937 47.3
Labour Harry Ernest89945.4
Conservative E. Gillard854.3
Green J. Edwards472.4
SDP A. Evans110.6
Majority
Turnout 50.1
Liberal Democrats gain from Labour Swing

Tremorfa

Tremorfa 1989
PartyCandidateVotes%±%
Labour Gordon Houlston* 1,236 83.6
Conservative A. Fox18212.3
SLD A. Taylor604.1
Majority
Turnout 50.7
Labour hold Swing

Trowbridge

Trowbridge 1989
PartyCandidateVotes%±%
Labour W. Bowen* 2,108 79.1
Conservative A. Hollands55820.9
Majority
Turnout 35.8
Labour hold Swing

Ty Glas

Ty Glas 1989
PartyCandidateVotes%±%
Labour Christopher Bettinson 971 45.0
Conservative Greville Tatham*92642.9
SLD J. Bennet26212.1
Majority
Turnout 57.4
Labour gain from Conservative Swing

Vale of Glamorgan North East

Vale of Glamorgan North East 1989
PartyCandidateVotes%±%
Conservative M. Prior 1,639 59.6
Labour S. Gough54319.8
SLD K. Matthews42315.4
SDP D. Britton1435.2
Majority
Turnout 73.3
Conservative hold Swing

Vale of Glamorgan South West

Vale of Glamorgan South West 1989
PartyCandidateVotes%±%
Labour L. Hughes* 2,295 69.4
Conservative S. Hignall69020.9
Green S. Middleditch2648.0
SDP E. Owen321.0
SLD Peter Sain Ley Berry280.8
Majority
Turnout 70.8
Labour hold Swing

Waterloo

Waterloo 1989
PartyCandidateVotes%±%
SLD L. Kelloway* 1,123 48.7
Conservative T. Croft65528.4
Labour P. Mitchell50021.7
SDP E. Morgan271.2
Majority
Turnout 51.2
Liberal Democrats hold Swing

KEY

*existing councillor, for the same ward

By-elections between 1989 and 1993

Two by-elections were held on 2 May 1991, the same day as elections to Cardiff City Council. Both were defended by the Liberal Democrats with one of the seats being narrowly lost to Labour. [2]

Cyncoed Village

Cyncoed Village by-election, 2 May 1991
PartyCandidateVotes%±%
Liberal Democrats J. Holliday 1,444
Conservative C. Millard1,116
Labour M. Harries169
Majority
Turnout
Liberal Democrats hold Swing

Pantllacca

Pantllacca by-election, 2 May 1991
PartyCandidateVotes%±%
Labour Graham Hinchey 788
Liberal Democrats V. Lane768
Conservative D. Conquer400
Majority
Turnout
Labour gain from Liberal Democrats Swing

Notes

  1. The Social and Liberal Democrats are referred to as Liberal Democrats in the ward results

Related Research Articles

<span class="mw-page-title-main">Liberal Party (UK, 1989)</span> British political party

The Liberal Party is a liberal political party in the United Kingdom that was founded in 1989 as a continuation of the original Liberal Party by members who opposed its merger with the Social Democratic Party (SDP) to form the Liberal Democrats. The party holds five local council seats. The party promotes a hybrid of both classical and social liberal tendencies.

<span class="mw-page-title-main">Sketty (electoral ward)</span> Human settlement in Wales

Sketty is the name of an electoral ward in the City and County of Swansea, Wales, UK. The electoral ward is coterminous with the community.

Guildford Borough Council in Surrey, England is elected every four years.

The 1987 Greenwich by-election was a by-election to the British House of Commons held on 26 February 1987, shortly before the 1987 general election. The election was caused by the death of Guy Barnett, Labour Party Member of Parliament for Greenwich on 24 December 1986.

<span class="mw-page-title-main">Sunderland City Council</span> Local authority of Sunderland, England

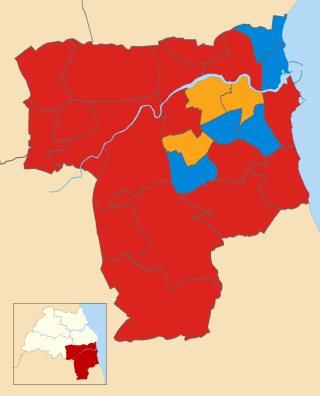
Sunderland City Council is the local authority of the City of Sunderland in Tyne and Wear, England. It is a metropolitan district council, one of five in Tyne and Wear and one of 36 in the metropolitan counties of England, and provides the majority of local government services in Sunderland.

Two Bootle by-elections were held during 1990, for the House of Commons constituency of Bootle in Merseyside.

<span class="mw-page-title-main">1984 Cynon Valley by-election</span>

The 1984 Cynon Valley by-election was a parliamentary by-election held on 3 May 1984 for the British House of Commons constituency of Cynon Valley.

<span class="mw-page-title-main">2011 Guildford Borough Council election</span>

The 2011 council elections in Guildford saw the Conservatives retain control over Guildford Borough Council with an increased majority of 20 seats. Full results for each ward can be found at Guildford Council election, full results, 2011.

The second election to the Glamorgan County Council was held on 8 March 1892. The 1889 election was the first contest and the next was the 1895 election. Glamorgan County Council had been established by the 1888 Local Government Act, and the first election held in January 1889. Glamorgan was by far the largest county in Wales in terms of population. The county of Glamorgan was at this time becoming heavily industrialised, although some areas such as the Vale of Glamorgan remained essentially rural. The rise of nonconformist liberalism, especially since the 1860s, throughout Wales, had challenged the prevailing influence of the landed gentry. However, even in 1889, the traditional forces remained influential and no working men were elected to the council. This changed in 1892 with the unopposed return of David Morgan in Aberdare and the success of Isaac Evans in Resolven.

<span class="mw-page-title-main">2014 North East Lincolnshire Council election</span>

The 2014 North East Lincolnshire Council election took place on 22 May 2014 to elect members of North East Lincolnshire Council in England. This was on the same day as other local elections. These elections saw UKIP making significant gains largely at the expense of Labour, and stripping them of their majority on the council.

The 1995 Cardiff Council election was the first election to the new unitary County Council of the City and County of Cardiff following the re-organization of local government in Wales. It was held on Thursday 4 May 1995. It was followed by the 1999 elections. On the same day there were elections to the other 21 local authorities in Wales and community councils in Wales. Labour won a majority of the seats. It was preceded in Cardiff by the 1991 elections to Cardiff City Council and the 1993 elections to South Glamorgan County Council.

<span class="mw-page-title-main">2018 Sunderland City Council election</span>

The 2018 Sunderland City Council election took place on 3 May 2018 to elect members of Sunderland City Council in England. The election took place on the same day as other local elections.

2019 Sunderland City Council election

The 2019 Sunderland City Council election took place on 2 May 2019 to elect members of Sunderland City Council in England. The election took place on the same day as other local elections.

The 1991 Cardiff City Council election was held on Thursday 2 May 1991 to the district council of Cardiff in South Glamorgan, Wales. It took place on the same day as other district council elections in Wales and England. The Labour Party regained a majority on Cardiff City Council, after sharing government for the previous four years.

The 1987 Cardiff City Council election was held on Thursday 7 May 1987 to the district council known as Cardiff City Council, in Cardiff, South Glamorgan, Wales. It took place on the same day as other district council elections in Wales and England. The Conservative Party lost control of the council, though the Labour Party were unable to regain an overall majority.

The 1983 Cardiff City Council election was held on Thursday 5 May 1983 to the district council known as Cardiff City Council, in Cardiff, South Glamorgan, Wales. It took place on the same day as other district council elections in Wales and England. The Conservative Party regained control of the council from the Labour Party.

The 1983 Vale of Glamorgan Borough Council election was held on Thursday 5 May 1983 to the Vale of Glamorgan Borough Council in South Glamorgan, Wales. It took place on the same day as other district council elections in Wales and England. The Conservative Party won a healthy majority on the council.

The fourth election to South Glamorgan County Council was held in May 1985. It was preceded by the 1981 election and followed by the 1989 election.

The sixth and last election to South Glamorgan County Council was held in May 1993. It was preceded by the 1989 election. Following local government re-organization the authority was abolished in 1996 and its powers transferred to two unitary authorities, Cardiff City Council and the Vale of Glamorgan Borough Council. Elections for the two shadow authorities were held in 1995.

The fourth election to West Glamorgan County Council was held in May 1985. It was preceded by the 1981 election and followed by the 1989 election.

References

  1. "South Glamorgan County Council Election Results 1973-1993" (PDF). The Elections Centre, Plymouth University. Retrieved 16 May 2019.
  2. "South Glam County Council By-Elections". South Wales Echo. 3 May 1989. p. 8. Retrieved 31 January 2023.