1993 South Glamorgan County Council election

Last updated

The sixth and last election to South Glamorgan County Council was held in May 1993. It was preceded by the 1989 election. Following local government re-organization the authority was abolished in 1996 and its powers transferred to two unitary authorities, Cardiff City Council and the Vale of Glamorgan Borough Council. Elections for the two shadow authorities were held in 1995.

Contents

Boundary changes

There were no boundary changes at this election.

Candidates

Conservative and Labour candidates contested all seats. Most seats were also contested by the Liberal Democrats. There were a smaller number of Plaid Cymru and Green Party candidates and a few Independents.

Outcome

Since the previous election two SDP councilors joined Labour. Labour retained control with a small number of seats changing hands.

This table summarises the result of the elections in all wards. 62 councillors were elected. [1]

1993 South Glamorgan County Council: elected members
PartySeatsGainsLossesNet gain/lossSeats %Votes %Votes+/−
  Labour 4013-2
  Conservative 1202-2
  Liberal Democrats 830+3
  Plaid Cymru 1000
  Independent Labour 110+1

Ward Results

Adamsdown

Adamsdown 1993
PartyCandidateVotes%±%
Labour Kenneth Hutchings* 1,141 60.8
Liberal Democrats John Dixon57830.8
Conservative K. Evans1115.9
Communist F. Rawling472.5
Majority
Turnout 34.3
Labour hold Swing

Baruc

Baruc 1993
PartyCandidateVotes%±%
Conservative J. Donovan* 724 34.7
Plaid Cymru Nic Hodges62630.0
Labour B. Sharp61029.3
Liberal Democrats S. O'Brien1246.0
Majority
Turnout 47.9
Conservative hold Swing

Butetown

Butetown 1993
PartyCandidateVotes%±%
Labour Ben Foday 663 76.0
Independent Manuel Dossantos11212.8
Conservative F. Arnold637.2
Liberal Democrats P. Doody343.9
Majority
Turnout 52.7
Labour hold Swing

Buttrills

Buttrills 1993
PartyCandidateVotes%±%
Labour B. Lane* 993 66.3
Conservative T. Sparks29719.8
Liberal Democrats D. Connell1379.1
Plaid Cymru G. Richards714.7
Majority
Turnout 35.7
Labour hold Swing

Cadoc

Cadoc 1993
PartyCandidateVotes%±%
Labour F. Johnson 905 68.9
Conservative C. Lambert22517.1
Plaid Cymru J. Lawrence1098.3
Green I. Gooderson755.7
Majority
Turnout 62.7
Labour hold Swing

Canton

Canton 1993
PartyCandidateVotes%±%
Labour D. Reed 1,044 55.2
Conservative A. Delamain50726.8
Liberal Democrats C. Warren33917.9
Majority
Turnout 39.9
Labour hold Swing

Castleland

Castleland 1993
PartyCandidateVotes%±%
Labour M. Sharp* 798 77.9
Conservative S. Newman18117.7
Plaid Cymru A. Dearing454.4
Majority
Turnout 36.3
Labour hold Swing

Central

Central 1993
PartyCandidateVotes%±%
Liberal Democrats Robin Rowland 704 43.1
Labour C. Champion*64239.3
Conservative C. Baker1197.3
Green N. Clark865.3
Plaid Cymru Terence O'Neill835.1
Majority62
Turnout 33.3
Liberal Democrats gain from Labour Swing

Cornerswell

Labour had won the seat four years previously but lost it to the Conservatives at a subsequent by-election.

Cornerswell 1993
PartyCandidateVotes%±%
Labour A. Rees 1,200 50.7
Conservative J. Flanigan*1,16849.3
Majority
Turnout 40.4
Labour hold Swing

Court

Court 1993
PartyCandidateVotes%±%
Labour S. Parsons* 866 75.8
Conservative C. Lambert14913.0
Liberal Democrats K. Bowden564.9
Plaid Cymru R. Hughes464.0
Green K. Simpson262.3
Majority
Turnout 31.0
Labour hold Swing

Cowbridge

Cowbridge 1993
PartyCandidateVotes%±%
Conservative R. Thomas* 1,247 47.4
Labour J. Baty88333.6
Liberal Democrats Peter Sain Ley Berry32512.4
Plaid Cymru H. Llewellyn-Morgan1746.6
Majority
Turnout 44.8
Conservative hold Swing

Cyncoed Village

Cyncoed Village 1993
PartyCandidateVotes%±%
Liberal Democrats J. Holiday* 1,290 46.6
Conservative C. Baker80735.7
Labour C. Bonnett1617.1
Majority
Turnout 54.0
Liberal Democrats hold Swing

Cyntwell

Cyntwell 1993
PartyCandidateVotes%±%
Liberal Democrats Roger Burley 593 45.9
Labour B. Phillips*53845.2
Conservative J. Courtis584.9
Majority
Turnout 32.8
Liberal Democrats gain from Labour Swing

Deri

Deri 1993
PartyCandidateVotes%±%
Conservative M. Davies* 862 47.2
Labour F. John53929.5
Liberal Democrats G. Hallett34719.0
Green G. Jones794.3
Majority
Turnout 40.9
Conservative hold Swing

Dinas Powys North

Dinas Powys North 1993
PartyCandidateVotes%±%
Plaid Cymru Chris Franks* 1,403 59.3
Conservative M. Pound50221.2
Labour J. Davies36615.5
Liberal Democrats B. Southwell964.1
Majority
Turnout 48.3
Plaid Cymru hold Swing

Dinas Powys South

Dinas Powys South 1993
PartyCandidateVotes%±%
Conservative A. Ernest 798 36.9
Labour R. Cox63629.4
Plaid Cymru David Haswell49322.8
Liberal Democrats C. Southwell23610.9
Majority
Turnout 39.4
Conservative hold Swing

Dyfan

Dyfan 1993
PartyCandidateVotes%±%
Labour C. Watkins* 933 58.0
Conservative K. Wright44127.4
Liberal Democrats K. Matthews19111.9
Plaid Cymru M. Storm452.8
Majority
Turnout 41.3
Labour hold Swing

Eglwys Wen

Eglwys Wen 1993
PartyCandidateVotes%±%
Labour A. Fennessy* 1,498 51.3
Conservative D. Porter89430.6
Liberal Democrats G. Mellem31810.9
Plaid Cymru Harri Pritchard-Jones 2117.2
Majority
Turnout 47.6
Labour hold Swing

Fairwater

Fairwater 1993
PartyCandidateVotes%±%
Labour Derek Rees 1,034 61.0
Conservative R. Trigg41924.7
Liberal Democrats P. Gemson24114.2
Majority
Turnout 31.6
Labour hold Swing

Gabalfa

Gabalfa 1993
PartyCandidateVotes%±%
Labour D. Campbell* 1,153 70.8
Conservative E. Morgan25015.4
Liberal Democrats Cathy Pearcy22513.8
Majority
Turnout 33.1
Labour hold Swing

Gibbonsdown

Gibbonsdown 1993
PartyCandidateVotes%±%
Labour B. Murray* 1,084 82.1
Conservative W. Nunn1319.9
Liberal Democrats S. Bowden614.6
Plaid Cymru O. Phillips443.3
Majority
Turnout 34.0
Labour hold Swing

Glan Ely

Glan Ely 1993
PartyCandidateVotes%±%
Labour Russell Goodwayo 1,082 78.4
Conservative N. Durbin14510.5
Liberal Democrats R. Hewlett1064.6
BNP A. Morgan473.4
Majority
Turnout 25.2
Labour hold Swing

Heath Park

Heath Park 1993
PartyCandidateVotes%±%
Conservative Tony John* 789 43.2
Labour M. Harries59432.5
Liberal Democrats W. Monkley44424.3
Majority
Turnout 34.4
Conservative hold Swing

Highmead

Highmead 1993
PartyCandidateVotes%±%
Labour B. Finn 1,020 74.2
Conservative W. Clarke21615.7
Liberal Democrats H. Gemson13810.0
Majority
Turnout 25.8
Labour hold Swing

Illtyd

Illtyd 1993
PartyCandidateVotes%±%
Labour Matthew Griffiths* 1,068 46.4
Conservative E. Williams1,00243.5
Liberal Democrats E. Maw1325.7
Plaid Cymru E. Rees1014.4
Majority
Turnout 70.4
Labour gain from Conservative Swing

Lakeside

Lakeside 1993
PartyCandidateVotes%±%
Liberal Democrats T. Pickets 1,342 67.6
Conservative K. Fisher49623.4
Labour D. Owen22110.4
Green D. Corker572.7
Majority
Turnout 47.1
Liberal Democrats hold Swing

Landsdowne

Landsdowne 1993
PartyCandidateVotes%±%
Labour Cherry Short 1,199 67.6
Conservative C. Trigg29516.6
Liberal Democrats A. Burns17910.1
Green V. Turner1015.7
Majority
Turnout 30.8
Labour hold Swing

Lisvane with St Mellons

Lisvane with St Mellons 1993
PartyCandidateVotes%±%
Conservative H. Campbell* 858 46.2
Liberal Democrats A. Holland67736.5
Labour S. Pantak27014.5
Green H. O'connor512.7
Majority
Turnout 39.5
Conservative hold Swing

Llandaff

Llandaff 1993
PartyCandidateVotes%±%
Conservative Julius Hermer* 1,217 48.0
Labour J. Sheppard76330.1
Liberal Democrats E. Williams29911.8
Plaid Cymru Eluned Bush1646.5
Green F. James933.7
Majority
Turnout 36.6
Conservative hold Swing

Llandaff North

Llandaff North 1993
PartyCandidateVotes%±%
Labour A. A'Hearne* 1,554 72.3
Conservative J. Marshall34616.1
Liberal Democrats J. Reece24811.5
Majority
Turnout 35.6
Labour hold Swing

Llanedeyrn

Vita Jones was elected as an SDP candidate in 1987 but subsequently rejoined the Labour Party.

Llanedeyrn 1993
PartyCandidateVotes%±%
Labour Vita Jones* 1,469 78.4
Liberal Democrats S. Wakefield20410.9
Conservative J. Munton20010.7
Majority
Turnout 28.8
Labour hold Swing

Llanrumney North

Llanrumney North 1993
PartyCandidateVotes%±%
Labour B. Lawes* 1,005 84.6
Conservative A. Price1129.4
Liberal Democrats A. Khan716.0
Majority
Turnout 26.4
Labour hold Swing

Llanrumney South

Llanrumney South 1993
PartyCandidateVotes%±%
Labour D. Francis* 946 70.6
Conservative S. Woods29021.6
Green L. Davey1047.8
Majority
Turnout 29.8
Labour hold Swing

Mackintosh

Mackintosh 1993
PartyCandidateVotes%±%
Labour Julie Morgan* 1,464 67.4
Conservative J. Evans27812.8
Liberal Democrats M. Morris22510.4
Plaid Cymru E. Parish1215.6
Green P. Ward843.9
Majority
Turnout 37.7
Labour hold Swing

Maindy

Maindy 1993
PartyCandidateVotes%±%
Liberal Democrats David Rees 1,106 46.4
Labour Reginald Surridge96640.5
Conservative E. Dibble1275.3
Plaid Cymru Fflur Roberts933.9
Green D. Beasely913.8
Majority
Turnout 41.7
Liberal Democrats hold Swing

North Whitchurch with Tongwynlais

North Whitchurch with Tongwynlais 1993
PartyCandidateVotes%±%
Labour W. Salmon 1,502 52.2
Conservative W. Griffiths1,16540.5
Liberal Democrats P. Brightman2107.3
Majority
Turnout 51.2
Labour hold Swing

Pantllacca

Labour had won the seat from the Liberal Democrats in a by-election

Pantllacca 1993
PartyCandidateVotes%±%
Labour Graham Hinchey* 762 52.7
Liberal Democrats G. Venning46232.0
Conservative J. Dickson19113.2
Green M. Duddy312.1
Majority
Turnout 28.6
Labour hold Swing

Pantmawr

Pantmawr 1993
PartyCandidateVotes%±%
Conservative Gareth Neale* 917 45.0
Labour S. Williams65232.0
Liberal Democrats J. Brent33816.6
Plaid Cymru F. Griffiths1316.4
Majority
Turnout 41.3
Conservative hold Swing

Park

Park 1993
PartyCandidateVotes%±%
Labour Sue Lent* 1,218 60.6
Liberal Democrats D. Powell32816.3
Conservative R. Evans25912.9
Plaid Cymru D. Jones1226.1
Green C. Von Ruhland844.2
Majority
Turnout 29.4
Labour hold Swing

Pentre Bane

Pentre Bane 1993
PartyCandidateVotes%±%
Labour Caerwyn Roderick* 970 76.7
Conservative C. Davison-Sebry16713.2
Liberal Democrats C. Ceaton12710.0
Majority
Turnout 25.6
Labour hold Swing

Penylan

Penylan 1993
PartyCandidateVotes%±%
Liberal Democrats R. Michaelis 1,192 57.7
Conservative G. Hughes*57527.8
Labour W. Matthews30014.5
Majority
Turnout 41.3
Liberal Democrats gain from Conservative Swing

Plymouth

Plymouth 1993
PartyCandidateVotes%±%
Conservative D. Turner* 977 57.0
Labour P. McGarrigle49528.9
Plaid Cymru M. Harries1317.6
Green K. Hooper1126.5
Majority
Turnout 40.3
Conservative hold Swing

Pontcanna

Pontcanna 1993
PartyCandidateVotes%±%
Labour R. Pearson 892 55.7
Conservative W. Donaldson28217.6
Plaid Cymru Penni Bestic17110.7
Liberal Democrats K. Blackburn1459.1
Green R. Wood1116.9
Majority
Turnout 32.4
Labour hold Swing

Radyr with St Fagans

Marion Drake, elected as an SDP candidate in 1987, subsequently joined Labour.

Radyr with St Fagans 1993
PartyCandidateVotes%±%
Labour Marian Drake* 1,158 59.1
Conservative P. Davison-Sebry64532.9
Liberal Democrats N. Roberts1578.0
Majority
Turnout 49.4
Labour hold Swing

Rhoose with Llancarfan

Rhoose with Llancarfan 1993
PartyCandidateVotes%±%
Conservative H. James* 1,009 61.8
Labour B. Goodway62538.2
Majority
Turnout 42.5
Conservative hold Swing

Riverside South

Riverside South 1993
PartyCandidateVotes%±%
Labour J. Singh 886 71.6
Liberal Democrats K. Hammacott12410.0
Conservative A. Walker12410.0
Plaid Cymru P. Daley1038.3
Majority
Turnout 27.5
Labour hold Swing

Rumney

Rumney 1993
PartyCandidateVotes%±%
Labour M. Payne* 1,484 67.0
Conservative S. Whiting59727.0
Plaid Cymru D. Reeves1336.0
Majority
Turnout 32.8
Labour hold Swing

Saltmead

Saltmead 1993
PartyCandidateVotes%±%
Labour D. Richards* 1,116 68.6
Conservative W. Selwood27416.8
Plaid Cymru D. Williams1469.0
Liberal Democrats M. Verma915.6
Majority
Turnout 31.7
Labour hold Swing

Splott

Splott 1993
PartyCandidateVotes%±%
Independent Labour M. Cook 1,181 54.1
Labour John Brooks* 76535.1
Conservative A. McCarthy1225.6
Liberal Democrats K. Chubb833.8
Communist D. Macaskill311.4
Majority19.0
Turnout 43.2
Independent Labour gain from Labour Swing

St Athan with Boverton

St Athan with Boverton 1993
PartyCandidateVotes%±%
Labour B. Doughty* 1,063 56.5
Conservative T. Crowther61332.6
Liberal Democrats B. Van Rooyen1266.7
Plaid Cymru S. Stephens784.1
Majority
Turnout 38.9
Labour hold Swing

St Augustines

St Augustines 1993
PartyCandidateVotes%±%
Labour P. Gray* 852 54.9
Conservative B. Chapple43127.8
Plaid Cymru D. Harries1796.7
Green P. Kinnersley915.9
Majority
Turnout 36.3
Labour hold Swing

Stanwell

Stanwell 1993
PartyCandidateVotes%±%
Labour H. Rees 660 57.1
Conservative A. Williams40234.8
Plaid Cymru S. Fford938.1
Majority
Turnout 36.6
Labour hold Swing

The Marl

The Marl 1993
PartyCandidateVotes%±%
Labour Peter Perkins* 861 74.4
Conservative J. Summerhayes21318.4
Liberal Democrats R. Pye514.4
Plaid Cymru Emyr Phillips332.8
Majority
Turnout 27.8
Labour hold Swing

Thornhill

Thornhill 1993
PartyCandidateVotes%±%
Labour Nicholas Butler* 1,791 58.4
Conservative M. Voisey75524.6
Liberal Democrats V. Hallet52017.0
Majority
Turnout 42.2
Labour hold Swing

Ton-yr-Ywen

Ton-yr-Ywen 1993
PartyCandidateVotes%±%
Conservative B. Rees* 644 39.4
Labour P. Owen58435.7
Liberal Democrats J. James31319.1
Green M. Evans945.7
Majority
Turnout 39.7
Conservative hold Swing

Trelai

Trelai 1993
PartyCandidateVotes%±%
Liberal Democrats Jacqui Gasson* 903 59.3
Labour Julie Mawn62140.7
Majority
Turnout 39.9
Liberal Democrats hold Swing

Tremorfa

Tremorfa 1993
PartyCandidateVotes%±%
Labour Gordon Houlston* 869 78.0
Plaid Cymru A. O'Neill14212.7
Conservative J. McCarthy797.1
Liberal Democrats J. Febbo242.2
Majority
Turnout 38.4
Labour hold Swing

Trowbridge

Trowbridge 1993
PartyCandidateVotes%±%
Labour W. Bowen* 1,531 74.3
Conservative R. Price33716.4
Liberal Democrats S. Sinha1205.8
Plaid Cymru S. Parry733.5
Majority
Turnout 22.9
Labour hold Swing

Ty Glas

Ty Glas 1993
PartyCandidateVotes%±%
Labour Christopher Bettinson 931 50.4
Conservative P. Tatham66235.9
Liberal Democrats D. Wright25313.7
Majority
Turnout 49.8
Labour hold Swing

Vale of Glamorgan North East

Vale of Glamorgan North East 1993
PartyCandidateVotes%±%
Conservative M. Prior* 749 50.5
Labour J. Evans33122.3
Liberal Democrats S. Campbell28719.3
Plaid Cymru N. Williams1177.9
Majority
Turnout 40.7
Conservative hold Swing

Vale of Glamorgan South West

Vale of Glamorgan South West 1993
PartyCandidateVotes%±%
Labour L. Hughes* 1,451 67.3
Conservative E. Bryant50423.4
Plaid Cymru M. Gill793.7
Liberal Democrats D. Van Rooyen793.7
Green A. Markey421.9
Majority
Turnout 46.0
Labour hold Swing

Waterloo

Waterloo 1993
PartyCandidateVotes%±%
Liberal Democrats L. Kelloway* 1,392 62.3
Labour R. Rees41218.4
Conservative A. Baker32914.7
Plaid Cymru Huw Marshall1024.6
Majority
Turnout 47.1
Liberal Democrats hold Swing

KEY

*existing councillor, for the same ward
oexisting councillor, but for a different ward

Notes

    Related Research Articles

    <span class="mw-page-title-main">Sketty (electoral ward)</span> Human settlement in Wales

    Sketty is the name of an electoral ward in the City and County of Swansea, Wales, UK. The electoral ward is coterminous with the community.

    Guildford Borough Council in Surrey, England is elected every four years.

    Elections to Slough Borough Council were held on 4 May 2006. One third of the council was up for election. This was the 121st Slough general local authority election since Slough became a local government unit in 1863.

    Elections to the Borough Council in Slough, England, were held on 3 May 2007. One third of the council was up for election. This was the 122nd Slough general local authority election since Slough became a local government unit in 1863.

    Elections to the Borough Council in Slough, England, were held on 1 May 2008. This was the 123rd Slough general local authority election since Slough became a local government unit in 1863.

    An election for the Borough Council in Slough, England, was held on 6 May 2010. This was the 124th Slough general local authority election since Slough became a local government unit in 1863.

    <span class="mw-page-title-main">2011 Guildford Borough Council election</span>

    The 2011 council elections in Guildford saw the Conservatives retain control over Guildford Borough Council with an increased majority of 20 seats. Full results for each ward can be found at Guildford Council election, full results, 2011.

    The fourth election to the City and County of Swansea Council was held in May 2008. It was preceded by the 2004 election and followed by the 2012 election.

    <span class="mw-page-title-main">2015 Guildford Borough Council election</span>

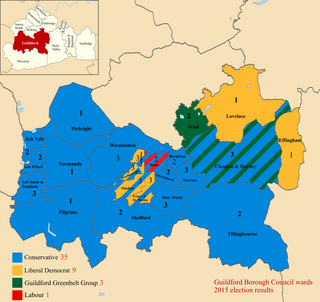
    The 2015 Guildford Borough Council election took place on 7 May 2015 to elect members of Guildford Borough Council in England as one of the 2015 local elections, held simultaneously with the General Election.

    The 1995 Cardiff Council election was the first election to the new unitary County Council of the City and County of Cardiff following the re-organization of local government in Wales. It was held on Thursday 4 May 1995. It was followed by the 1999 elections. On the same day there were elections to the other 21 local authorities in Wales and community councils in Wales. Labour won a majority of the seats. It was preceded in Cardiff by the 1991 elections to Cardiff City Council and the 1993 elections to South Glamorgan County Council.

    <span class="mw-page-title-main">2018 Sunderland City Council election</span>

    The 2018 Sunderland City Council election took place on 3 May 2018 to elect members of Sunderland City Council in England. The election took place on the same day as other local elections.

    The 1973 South Glamorgan County Council election was the first election to South Glamorgan County Council and was held in April 1973. It was followed by the 1977 election.

    The 1991 Cardiff City Council election was held on Thursday 2 May 1991 to the district council of Cardiff in South Glamorgan, Wales. It took place on the same day as other district council elections in Wales and England. The Labour Party regained a majority on Cardiff City Council, after sharing government for the previous four years.

    The 1987 Cardiff City Council election was held on Thursday 7 May 1987 to the district council known as Cardiff City Council, in Cardiff, South Glamorgan, Wales. It took place on the same day as other district council elections in Wales and England. The Conservative Party lost control of the council, though the Labour Party were unable to regain an overall majority.

    The 1983 Cardiff City Council election was held on Thursday 5 May 1983 to the district council known as Cardiff City Council, in Cardiff, South Glamorgan, Wales. It took place on the same day as other district council elections in Wales and England. The Conservative Party regained control of the council from the Labour Party.

    The 1983 Vale of Glamorgan Borough Council election was held on Thursday 5 May 1983 to the Vale of Glamorgan Borough Council in South Glamorgan, Wales. It took place on the same day as other district council elections in Wales and England. The Conservative Party won a healthy majority on the council.

    The fourth election to South Glamorgan County Council was held in May 1985. It was preceded by the 1981 election and followed by the 1989 election.

    The fifth election to South Glamorgan County Council was held in May 1989. It was preceded by the 1985 election and followed by the 1993 election.

    The 2022 Richmond upon Thames London Borough Council election took place on 5 May 2022. All 54 members of Richmond upon Thames London Borough Council were elected. The elections took place alongside local elections in the other London boroughs and elections to local authorities across the United Kingdom.

    <span class="mw-page-title-main">2022 Vale of Glamorgan Council election</span>

    The 2022 Vale of Glamorgan Council election took place as of 5 May 2022 to elect 54 members across 24 wards to Vale of Glamorgan Council. On the same day, elections were held to the other 21 local authorities and to community councils in Wales as part of the 2022 Welsh local elections. The previous Vale of Glamorgan all-council election took place in May 2017 and future elections will take place every five years.

    References

    1. "South Glamorgan County Council Election Results 1973–1993" (PDF). The Elections Centre, Plymouth University. Retrieved 16 May 2019.