1989 Essex County Council election

Last updated

1989 Essex County Council election
Flag of Essex.svg
  1985 4 May 1989 1993  

All 98 seats to Essex County Council
49 seats needed for a majority
 First partySecond party
  No image wide.svg No image wide.svg
Party Conservative Labour
Last election45 seats, 39.8%29 seats, 29.6%
Seats before4429
Seats won5726
Seat changeIncrease2.svg 12Decrease2.svg 3
Popular vote193,578128,270
Percentage44.2%29.3%
SwingIncrease2.svg 4.4%Decrease2.svg 0.3%

 Third partyFourth party
  No image wide.svg No image wide.svg
Party SLD Loughton Residents
Last election23 seats, 29.2%1 seats, 0.5%
Seats before241
Seats won141
Seat changeDecrease2.svg 9Steady2.svg
Popular vote101,3421,378
Percentage23.1%0.3%
SwingDecrease2.svg 6.1%Increase2.svg 0.2%

Essex County Council election 1989.svg
Results of the 1989 Essex County Council election.

Council control before election


No overall control

Council control after election


Conservative

The 1989 Essex County Council election took place on 4 May 1989 to elect members of Essex County Council in Essex, England. It was held on the same day as other local elections. 98 councillors were elected from various electoral divisions, which returned either one or two county councillors each by first-past-the-post voting for a four-year term of office.

Contents

Summary

Election result

1989 Essex County Council election [1] [2]
PartyCandidatesSeatsGainsLossesNet gain/lossSeats %Votes %Votes+/−
  Conservative 9857131Increase2.svg 1258.244.2193,578+4.4
  Labour 982614Decrease2.svg 326.529.3128,270–0.3
  SLD 9014110Decrease2.svg 914.323.1101,342–6.1
  Loughton Residents 1100Steady2.svg1.00.31,378–0.2
  Green 15000Steady2.svg0.01.35,654+1.2
  SDP 9000Steady2.svg0.01.25,191N/A
  Independent 4000Steady2.svg0.00.31,204+0.1
  Ind. Labour Party 1000Steady2.svg0.00.21,045N/A
  Liberal 1000Steady2.svg0.00.1265N/A
  BNP 1000Steady2.svg0.0<0.1146N/A

Division results by local authority

Basildon

Basildon District Summary
PartySeats+/-Votes%+/-
Labour 5Decrease2.svg 116,20936.8–3.5
Conservative 4Increase2.svg 117,99940.9+9.1
SLD 1Steady2.svg9,52521.6–4.5
Independent 0Steady2.svg1960.4N/A
SDP 0Steady2.svg1230.3N/A
Total10Steady2.svg44,05236.2–1.8

Division results

Basildon Crouch
PartyCandidateVotes%±%
SLD Francis Bellard * 2,220 49.1 +17.3
Conservative Donald Morris1,75638.8−6.8
Labour Margaret Davis54412.0−10.6
Majority46410.3
Turnout 4,52043.5
SLD gain from Conservative Swing Increase2.svg12.1
Basildon Fryerns
PartyCandidateVotes%±%
Labour Williams Archibald * 2,064 58.7 −12.5
SLD John Smith73620.9+7.2
Conservative Brian Archbold71920.4+5.3
Majority1,32837.7
Turnout 3,51934.2
Labour hold Swing Decrease2.svg9.9
Basildon Gloucester Park
PartyCandidateVotes%±%
Labour Madeline Costello 2,729 65.8 +0.3
Conservative Stuart Allen1,03825.0+6.5
SLD Philip Jenkins3809.2−6.7
Majority1,69140.8
Turnout 4,14734.6
Labour hold Swing Decrease2.svg3.1
Basildon Laindon
PartyCandidateVotes%±%
Labour Martin Oliver 2,229 54.6 +5.1
Conservative William Lockhart1,44035.3+15.7
SLD Stuart Saunders41610.2−20.7
Majority78919.3
Turnout 4,08536.4
Labour hold Swing Decrease2.svg5.3
Basildon Pitsea
PartyCandidateVotes%±%
Labour Angela Smith 2,631 56.9 −7.0
Conservative Paul Cleland1,61434.9+11.3
SLD Linda Williams3788.2−4.3
Majority1,01722.0
Turnout 4,62327.0
Labour hold Swing Decrease2.svg9.2
Basildon Vange
PartyCandidateVotes%±%
Labour Anthony Wright 2,413 63.5 −4.6
Conservative Simon Ryder1,05827.9+9.5
SLD David Owens3278.6−4.9
Majority1,35535.7
Turnout 3,79828.2
Labour hold Swing Decrease2.svg7.1
Basildon Westley Heights
PartyCandidateVotes%±%
Conservative Brinley Jones 2,501 46.2 +16.9
Labour Charles Bidmead1,82333.6−8.3
SLD Ian White97117.9−10.9
SDP William Shelton1232.3N/A
Majority67812.5
Turnout 5,41845.9
Conservative gain from Labour Swing Increase2.svg12.6
Billericay North
PartyCandidateVotes%±%
Conservative Lilian Greenfield * 3,261 71.3 +5.4
SLD Arthur Ferriss72415.8−9.3
Labour Harold Bruce3928.6−0.4
Independent Patricia Breadmore1964.3N/A
Majority2,53755.5
Turnout 4,57336.2
Conservative hold Swing Increase2.svg7.4
Billericay South
PartyCandidateVotes%±%
Conservative George Dighton 2,498 54.3 +11.4
SLD Janice Morley1,35729.5+2.1
Labour Irene Harlow74716.2+0.4
Majority1,14124.8
Turnout 4,60236.6
Conservative hold Swing Increase2.svg4.7
Wickford
PartyCandidateVotes%±%
Conservative Iris Pummell 2,114 44.3 +15.4
SLD Kay Battson2,01642.3−12.7
Labour Elsie Harrison63713.4−2.7
Majority982.1
Turnout 4,76739.7
Conservative gain from SLD Swing Increase2.svg14.1

Braintree

Braintree District Summary
PartySeats+/-Votes%+/-
Conservative 4Steady2.svg15,78843.9+3.1
Labour 2Steady2.svg12,26734.1+3.0
SLD 1Steady2.svg7,31520.4–7.7
Green 0Steady2.svg5601.6N/A
Total7Steady2.svg35,92039.9–2.5

Division results

Bocking
PartyCandidateVotes%±%
Labour Peter White * 2,939 53.2 +10.0
Conservative Graham Hutton2,17839.4−0.8
SLD Jayne Nicholls4117.4−9.2
Majority76113.8
Turnout 5,52845.6
Labour hold Swing Increase2.svg5.4
Braintree East
PartyCandidateVotes%±%
Conservative Robert Dixon-Smith * 2,832 52.5 +9.6
Labour Richard Keeble1,77132.8+1.7
SLD John Ross78914.6−11.5
Majority1,06119.7
Turnout 5,39239.3
Conservative hold Swing Increase2.svg4.0
Braintree West
PartyCandidateVotes%±%
SLD David Grice * 2,765 45.3 −5.1
Conservative Kenneth Brookman2,43739.9+6.4
Labour Peter Johnson89914.7−1.4
Majority3285.4
Turnout 6,10144.0
SLD hold Swing Decrease2.svg5.8
Halstead
PartyCandidateVotes%±%
Conservative Joseph Pike 2,286 44.0 −2.8
Labour Michele Jones1,71232.9+0.1
SLD Robert Bird1,20223.1+2.8
Majority57411.0
Turnout 5,20039.6
Conservative hold Swing Decrease2.svg1.5
Hedingham
PartyCandidateVotes%±%
Conservative Geoffrey Waterer * 2,636 54.5 +3.6
Labour John Kotz1,23825.6+5.1
SLD Roy Cavinder95919.8−8.8
Majority1,39828.9
Turnout 4,82340.6
Conservative hold Swing Decrease2.svg1.5
Witham Northern
PartyCandidateVotes%±%
Labour Joan Lyon * 2,228 46.8 +4.1
Conservative Roger Wacey1,57933.1+2.0
Green James Abbott56011.8N/A
SLD Terence Cane3988.4−17.8
Majority64913.6
Turnout 4,76536.0
Labour hold Swing Increase2.svg1.1
Witham Southern
PartyCandidateVotes%±%
Conservative Dennis Willetts * 1,840 44.8 +4.4
Labour John Gyford1,48036.0+4.0
SLD Alfred Slowman79119.2−8.4
Majority3608.8
Turnout 4,11134.0
Conservative hold Swing Increase2.svg0.2

Brentwood

Brentwood District Summary
PartySeats+/-Votes%+/-
Conservative 4Steady2.svg11,42450.7+4.7
SLD 1Steady2.svg6,46028.7–6.5
Labour 0Steady2.svg4,12218.3–0.5
Green 0Steady2.svg5082.3N/A
Total5Steady2.svg22,51440.4–4.4

Division results

Brentwood Central
PartyCandidateVotes%±%
Conservative Margaret Hutton * 2,070 48.5 +5.6
SLD Edgar Davis1,47134.4−8.5
Labour Cornelius Maxey44710.5−3.7
Green Roger Lankester2826.6N/A
Majority59914.0
Turnout 4,27043.4
Conservative hold Swing Increase2.svg7.1
Brentwood Hutton
PartyCandidateVotes%±%
Conservative Lee Green 2,559 62.8 +11.5
Labour Malcolm Burgess77319.0+2.7
SLD Lachlan Mackenzie74318.2−14.2
Majority1,78643.8
Turnout 4,07534.0
Conservative hold Swing Increase2.svg4.4
Brentwood North
PartyCandidateVotes%±%
Conservative Leonard Jago * 1,874 53.8 +3.2
SLD Pauline Myers1,20634.6+1.4
Labour Robert Gow40211.5−4.6
Majority66819.2
Turnout 3,48236.7
Conservative hold Swing Increase2.svg0.9
Brentwood Rural
PartyCandidateVotes%±%
SLD Derek Hardy * 3,040 53.1 +8.3
Conservative Dennis Morton2,08336.4−8.1
Labour Richard Tattersall3385.9−4.2
Green John Brindley2264.6N/A
Majority95716.7
Turnout 5,68745.8
SLD hold Swing Increase2.svg8.2
Brentwood South
PartyCandidateVotes%±%
Conservative Janet Hayward * 2,838 56.8 +14.4
Labour David Lewin2,16243.2+7.1
Majority67613.5
Turnout 5,00042.0
Conservative hold Swing Increase2.svg3.7

Castle Point

Castle Point District Summary
PartySeats+/-Votes%+/-
Conservative 6Increase2.svg 113,77759.6+9.5
Labour 0Decrease2.svg 16,79229.4–2.3
SLD 0Steady2.svg2,0408.8–9.5
Green 0Steady2.svg5112.2N/A
Total6Steady2.svg23,12036.5+2.2

Division results

Benfleet
PartyCandidateVotes%±%
Conservative Jillian Reeves * 2,098 61.2 +5.3
Labour Brian Wilson89726.2+2.4
SLD Timothy Atkins43412.7−7.6
Majority1,20135.0
Turnout 3,42934.7
Conservative hold Swing Increase2.svg1.5
Canvey Island East
PartyCandidateVotes%±%
Conservative Harold King 2,802 57.6 +17.1
Labour John Payne1,55231.9−8.9
Green Derek Easton51110.5N/A
Majority1,25025.7
Turnout 4,86533.7
Conservative gain from Labour Swing Increase2.svg13.0
Canvey Island West
PartyCandidateVotes%±%
Conservative Raymond Howard * 2,662 57.2 +11.9
Labour Dorothy Shaw1,61734.7−7.9
SLD David Ford3778.1−3.9
Majority1,04522.4
Turnout 4,65634.5
Conservative hold Swing Increase2.svg9.9
Great Tarpots
PartyCandidateVotes%±%
Conservative William Brum * 1,827 54.1 +10.2
Labour Ashley Final1,12533.3−4.4
SLD Kenneth Miller42612.6−5.9
Majority70220.8
Turnout 5,03930.6
Conservative hold Swing Increase2.svg7.3
Hadleigh
PartyCandidateVotes%±%
Conservative Ronald Williams * 2,355 66.5 +2.7
Labour Joy Nisbet77321.8+5.1
SLD Carole Newton41611.7−7.8
Majority1,58244.6
Turnout 3,54438.5
Conservative hold Swing Decrease2.svg1.2
Thundersley
PartyCandidateVotes%±%
Conservative Joseph Gazzard * 2,033 62.6 +10.1
Labour June Turner82825.5−0.1
SLD Robert Patman38711.9−10.1
Majority1,20537.1
Turnout 3,24833.0
Conservative hold Swing Increase2.svg5.1

Chelmsford

Chelmsford District Summary
PartySeats+/-Votes%+/-
Conservative 8Increase2.svg 421,69545.5+4.5
SLD 1Decrease2.svg 415,08131.6–12.0
Labour 0Steady2.svg7,34015.4±0.0
Green 0Steady2.svg3,3747.1N/A
SDP 0Steady2.svg1930.4N/A
Total9Steady2.svg47,68340.9±0.0

Division results

Broomfield & Writtle
PartyCandidateVotes%±%
Conservative Michael Rose * 2,111 55.8 +3.1
Labour Douglas Shinn75319.9−0.1
SLD Madeline Sinclair51213.5−13.9
Green James Ritchie40910.8N/A
Majority1,35835.9
Turnout 3,78537.8
Conservative hold Swing Increase2.svg1.6
Chelmsford East
PartyCandidateVotes%±%
Conservative David Kimberlin 2,725 46.5 +5.1
SLD Wilfred Davey2,07535.4−9.2
Labour Guy Shearwood62010.6−3.4
Green Nigel Bedrock4377.5N/A
Majority65011.1
Turnout 5,85748.2
Conservative gain from SLD Swing Increase2.svg7.2
Chelmsford North
PartyCandidateVotes%±%
Conservative Kathleen Pauley 1,858 34.6 +8.0
SLD Thomas Smith-Hughes *1,65730.8−19.2
Labour Roy Chad1,61330.0+6.6
Green Judith Ritchie2474.6N/A
Majority2013.7
Turnout 5,37545.9
Conservative gain from SLD Swing Increase2.svg13.6
Chelmsford South
PartyCandidateVotes%±%
Conservative Vernon Makin 1,813 40.0 +3.5
SLD Robert Harmer *1,78339.3−12.3
Labour Antony Scammell52111.5−0.4
Green Carol Mills4169.2N/A
Majority300.7
Turnout 4,53340.3
Conservative gain from SLD Swing Increase2.svg7.9
Chelmsford West
PartyCandidateVotes%±%
Conservative David Lee 1,415 31.4 +2.9
Labour Bill Wright1,41331.4+5.4
SLD George Allen *1,19326.5−19.0
Green Andrew Simms2936.5N/A
SDP Betty Perry1934.3N/A
Majority20.0
Turnout 4,50745.6
Conservative gain from SLD Swing Decrease2.svg1.3
Great Baddow
PartyCandidateVotes%±%
SLD Joan Beard * 2,556 47.8 −7.5
Conservative John Flack 2,05338.4+4.2
Labour Keith Day4568.5−2.0
Green Angela Thomson2865.3N/A
Majority5039.4
Turnout 5,35149.2
SLD hold Swing Decrease2.svg5.9
Springfield
PartyCandidateVotes%±%
Conservative Peter Martin 3,510 51.4 +4.4
SLD Richard Derrick2,13031.2−12.4
Labour Edmund Cawston70910.4+1.0
Green Jennifer Scholfield4857.1N/A
Majority1,38020.2
Turnout 6,83438.7
Conservative hold Swing Increase2.svg8.4
Stock
PartyCandidateVotes%±%
Conservative Paul White * 3,209 59.5 +8.6
SLD Marie Wolfe1,01318.8−12.9
Labour Richard Elliott78814.6−2.7
Green Nicholas Wallbank3857.1N/A
Majority2,19640.7
Turnout 5,39537.4
Conservative hold Swing Increase2.svg10.8
Woodham Ferrers & Danbury
PartyCandidateVotes%±%
Conservative Eileen Mickleborough 3,001 49.6 +2.4
SLD Patricia Hughes2,16235.8−6.5
Labour Dennis Perkins4677.7−2.8
Green Brian Littlechild4166.9N/A
Majority83913.9
Turnout 6,04632.2
Conservative hold Swing Increase2.svg4.5

Colchester

District Summary
PartySeats+/-Votes%+/-
Conservative 6Increase2.svg 117,87144.1+4.3
Labour 2Increase2.svg 110,32025.5–0.8
SLD 1Decrease2.svg 29,96024.6–9.3
SDP 0Steady2.svg1,6754.1N/A
Green 0Steady2.svg3690.9N/A
Liberal 0Steady2.svg2650.7N/A
Independent 0Steady2.svg540.1N/A
Total9Steady2.svg40,51436.6–1.7

Division results

Constable
PartyCandidateVotes%±%
Conservative Anthony Clover * 2,812 63.2 +2.7
SLD Julie Brice1,06423.9−1.4
Labour Lucy Wood57212.9−2.3
Majority1,74839.3
Turnout 4,44841.9
Conservative hold Swing Increase2.svg2.1
Drury
PartyCandidateVotes%±%
Conservative Derek Lamberth * 2,837 48.2 +3.1
SLD Cyril Williamson2,29439.0−3.4
Labour Maureen Lee 75612.8+0.3
Majority5439.2
Turnout 5,88745.6
Conservative hold Swing Increase2.svg3.3
Maypole
PartyCandidateVotes%±%
SLD Patricia Pascoe * 1,676 41.3 −2.1
Labour Donald Quinn1,43135.2−4.4
Conservative John Parsons95423.5+6.5
Majority2456.1
Turnout 4,06132.5
SLD hold Swing Increase2.svg1.2
Mersea and Stanway
PartyCandidateVotes%±%
Conservative Richard Fairhead * 3,408 61.2 +1.6
SLD Angela Fielder1,37224.6+0.5
Labour Tim Young79114.2−2.0
Majority2,03636.6
Turnout 5,57138.7
Conservative hold Swing Increase2.svg0.6
Old Heath
PartyCandidateVotes%±%
Labour Michael Macneil 1,683 35.9 +0.9
SLD Ann Stevens *1,67435.7−9.2
Conservative Sandra Rae90719.4−0.2
Green Charles Bush3697.9N/A
Independent David Smith541.2N/A
Majority90.2
Turnout 4,68740.1
Labour gain from SLD Swing Increase2.svg5.1
Park
PartyCandidateVotes%±%
Conservative Jeremy Lucas 1,823 44.8 +5.1
Labour Roger Turp1,00824.8−2.1
SLD Phillip Holden97123.9−9.5
Liberal Richard Wilson2656.5N/A
Majority81520.0
Turnout 4,06738.2
Conservative hold Swing Increase2.svg3.6
Parsons Heath
PartyCandidateVotes%±%
Conservative Roger Lord 1,760 37.8 +5.0
SDP Alan Hayman *1,67536.0N/A
Labour Robert Newman1,21926.2−5.4
Majority851.8
Turnout 4,65434.5
Conservative gain from SLD
Tiptree
PartyCandidateVotes%±%
Conservative Edmund Peel * 1,909 60.8 +11.5
Labour David Brede70522.4+4.2
SLD Irene Brady52716.8−16.0
Majority1,20438.4
Turnout 3,14126.6
Conservative hold Swing Increase2.svg3.7
Wivenhoe St Andrew
PartyCandidateVotes%±%
Labour Brian Stapleton * 2,155 53.9 +6.5
Conservative Christopher Thompson1,46136.5+1.1
SLD Raymond Gamble3829.6−7.6
Majority69417.4
Turnout 3,99833.0
Labour hold Swing Increase2.svg2.7

Epping Forest

Epping Forest District Summary
PartySeats+/-Votes%+/-
Conservative 5Steady2.svg15,52847.8+3.8
Labour 2Steady2.svg8,88527.3–0.3
Loughton Residents 1Steady2.svg1,3784.2–2.8
SLD 0Steady2.svg4,73214.6–6.0
SDP 0Steady2.svg1,8385.7N/A
BNP 0Steady2.svg1460.4N/A
Total8Steady2.svg32,50732.6–4.7

Division results

Buckhurst Hill
PartyCandidateVotes%±%
Conservative Bernard Cox * 1,649 42.6 −2.3
SDP Stephen Robinson1,05427.2N/A
SLD Janice Lowe73719.0−18.7
Labour Angela Ayre43111.1−6.2
Majority59515.4
Turnout 3,87136.1
Conservative hold Swing Decrease2.svg14.8
Chigwell
PartyCandidateVotes%±%
Conservative Anthony Twynham 1,781 58.4 +10.1
SLD Sandra Anderson91029.8−13.9
Labour Alistair Alexander2126.9−1.1
SDP Michael Austin1484.9N/A
Majority87128.5
Turnout 3,05132.3
Conservative hold Swing Increase2.svg12.0
Epping
PartyCandidateVotes%±%
Conservative Dennis Ramshaw 1,785 46.1 −1.7
SLD Susan Mann1,24032.0+4.1
Labour Ian Standfast58815.2−9.0
SDP George Dunseath2616.7N/A
Majority54514.1
Turnout 3,87432.1
Conservative hold Swing Decrease2.svg2.9
Loughton St. Johns
PartyCandidateVotes%±%
Labour Frank Davis * 1,537 46.7 +5.8
Conservative John Pledge1,20836.7+8.0
SLD Gary Anderson2587.8+0.7
BNP Robert Jarvis1464.4N/A
SDP Simon Bone1444.4N/A
Majority32910.0
Turnout 3,29333.2
Labour hold Swing Increase2.svg1.1
Loughton St. Marys
PartyCandidateVotes%±%
Loughton Residents Sidney Webb * 1,378 34.2 −4.5
Labour Joan Ormston1,33433.2+0.6
Conservative John Martin1,31232.6+3.9
Majority441.1
Turnout 3,29338.4
Loughton Residents hold Swing Decrease2.svg2.6
North Weald & Nazeing
PartyCandidateVotes%±%
Conservative Ian Abbey * 2,612 70.7 +12.9
Labour David Mills66017.9+1.2
SLD Stanley Ward42311.4−9.9
Majority1,95252.8
Turnout 3,69534.8
Conservative hold Swing Increase2.svg5.9
Ongar
PartyCandidateVotes%±%
Conservative Gerard McEwan 2,931 51.1 +2.3
Labour Ronald Barnes1,84832.2+12.7
SLD Douglas Kelly95416.6−14.2
Majority1,08318.9
Turnout 5,73343.2
Conservative hold Swing Decrease2.svg5.2
Waltham Abbey
PartyCandidateVotes%±%
Labour Cyril Hewins * 2,275 45.8 −9.7
Conservative Elizabeth Webster2,25045.3+0.8
SDP Christine Barrett2314.7N/A
SLD Christine Bartrip2104.2N/A
Majority250.5
Turnout 4,96634.9
Labour hold Swing Decrease2.svg5.3

Harlow

Harlow District Summary
PartySeats+/-Votes%+/-
Labour 4Decrease2.svg 113,42659.2+0.2
Conservative 1Increase2.svg 16,43328.4+10.2
SLD 0Steady2.svg2,82912.5–10.3
Total5Steady2.svg22,68839.2+1.0

Division results

Great Parndon
PartyCandidateVotes%±%
Conservative David Messer 2,404 47.7 +15.5
Labour Sidney Warner *2,16142.9−7.4
SLD Peter Barton4749.4−8.2
Majority2434.8
Turnout 5,03939.1
Conservative gain from Labour Swing Increase2.svg11.5
Harlow & Mark Hall
PartyCandidateVotes%±%
Labour Sonia Anderson * 2,958 62.8 +5.5
Conservative Simon Carter1,44030.6+5.9
SLD Douglas Collins3106.6−11.3
Majority1,51832.2
Turnout 4,70843.9
Labour hold Swing Decrease2.svg0.2
Harlow Common
PartyCandidateVotes%±%
Labour William Gibson * 2,401 55.0 +1.5
SLD Ian Myers1,17626.9−19.6
Conservative Guy Mitchinson78918.1N/A
Majority1,22528.1
Turnout 4,36639.3
Labour hold Swing Increase2.svg10.6
Little Parndon & Town Centre
PartyCandidateVotes%±%
Labour Edith Morris * 2,638 65.4 ±0.0
Conservative Leslie Atkins94523.4+6.0
SLD Lorna Spenceley45111.2−6.1
Majority1,69342.0
Turnout 4,03437.1
Labour hold Swing Decrease2.svg3.0
Netteswellbury
PartyCandidateVotes%±%
Labour Robert Guy * 3,268 72.0 +2.2
Conservative Sylvia Cross85518.8+3.0
SLD Valerie Scott4189.2−5.3
Majority2,41353.1
Turnout 4,54137.1
Labour hold Swing Decrease2.svg0.4

Maldon

Maldon District Summary
PartySeats+/-Votes%+/-
Conservative 3Increase2.svg 17,90957.1+10.5
SLD 0Decrease2.svg 13,59025.9–10.8
Labour 0Steady2.svg2,35717.0+0.3
Total3Steady2.svg13,85634.0–0.9

Division results

Maldon
PartyCandidateVotes%±%
Conservative Kathleen Nolan * 2,649 56.9 +9.6
SLD Richard Hornett1,02622.0−9.1
Labour David Hutson98421.1−0.4
Majority1,62334.8
Turnout 4,65937.4
Conservative hold Swing Increase2.svg9.4
Southminster
PartyCandidateVotes%±%
Conservative David Fisher * 2,418 57.4 +7.2
SLD Peter Barker1,14427.2−6.2
Labour Gary Prior65015.4−1.0
Majority1,27430.2
Turnout 4,21229.0
Conservative hold Swing Increase2.svg6.7
Tollesbury
PartyCandidateVotes%±%
Conservative Elizabeth Dines 2,842 57.0 +13.8
SLD Merilyn Fraser1,42028.5−16.4
Labour William Dobson72314.5+2.6
Majority1,42228.5
Turnout 4,98536.4
Conservative gain from SLD Swing Increase2.svg15.1

Rochford

Rochford District Summary
PartySeats+/-Votes%+/-
Conservative 2Steady2.svg9,08043.4+0.9
SLD 2Steady2.svg6,57831.5+4.8
Labour 1Steady2.svg6,57821.6–5.9
Independent 0Steady2.svg7283.5N/A
Total5Steady2.svg20,90435.3–1.3

Division results

Rayleigh North
PartyCandidateVotes%±%
SLD Richard Boyd * 2,577 62.7 +5.6
Conservative Pamela Hawke1,30731.8−0.7
Labour Loraine Rossati2295.6−4.8
Majority1,27030.9
Turnout 4,11337.3
SLD hold Swing Increase2.svg3.2
Rayleigh South
PartyCandidateVotes%±%
SLD James Gordon * 1,954 41.0 +4.1
Conservative John Gibson1,69535.5+7.6
Independent Stanley Silva72815.3−0.1
Labour Peter Ballard3918.2−11.6
Majority2595.4
Turnout 4,76839.8
SLD hold Swing Decrease2.svg1.8
Rochford North
PartyCandidateVotes%±%
Conservative Terry Fawell 1,704 46.0 +3.2
SLD Bernard Crick1,52441.1+3.4
Labour Jeremiah Keohane47912.9−6.5
Majority1804.9
Turnout 3,70729.4
Conservative hold Swing Decrease2.svg0.1
Rochford South
PartyCandidateVotes%±%
Labour David Flack 2,204 50.8 +0.8
Conservative John Sheaf2,13649.2−0.8
Majority681.6
Turnout 4,34040.3
Labour hold Swing Increase2.svg0.8
Rochford West
PartyCandidateVotes%±%
Conservative Anthony Stockley 2,238 56.3 −5.1
Labour Christopher Morgan1,21530.6−8.0
SLD Clive Wren52313.2N/A
Majority1,02325.7
Turnout 3,97630.9
Conservative hold Swing Increase2.svg1.5

Southend

Southend District Summary
PartySeats+/-Votes%+/-
Conservative 5Increase2.svg 219,86745.3+6.2
SLD 5Decrease2.svg 214,31832.6–9.0
Labour 1Steady2.svg8,31219.0+1.1
SDP 0Steady2.svg1,3623.1N/A
Total11Steady2.svg43,85936.2–1.8

Division results

Belfairs & Blenheim
PartyCandidateVotes%±%
SLD Albert Smulian * 1,996 49.8 −3.5
Conservative Jeanette Rowswell1,61740.4+4.4
Labour Barry Thurston3949.8±0.0
Majority3799.5
Turnout 4,00739.3
SLD hold Swing Decrease2.svg4.0
Chalkwell
PartyCandidateVotes%±%
Conservative Bertam Trevelyan 1,909 46.9 +1.8
SLD Edna Bunclark1,83745.1−2.8
Labour Joyce Mapp3258.0+1.0
Majority721.8
Turnout 4,07138.3
Conservative gain from SLD Swing Increase2.svg2.3
Eastwood
PartyCandidateVotes%±%
SLD Nora Goodman * 1,996 46.4 −6.1
Conservative Gwendoline Horrigan1,99146.3+6.7
Labour Trevor Pyne3147.3−0.6
Majority50.1
Turnout 4,30139.8
SLD hold Swing Decrease2.svg6.4
Leigh
PartyCandidateVotes%±%
SLD Joyce Robinson * 2,553 49.4 −1.1
Conservative Henry Stennett2,28944.3+3.6
Labour Lily Davidson3256.3−0.6
Majority2645.1
Turnout 5,16748.3
SLD hold Swing Decrease2.svg2.4
Milton
PartyCandidateVotes%±%
Conservative Elizabeth Sullivan 1,682 40.3 +11.3
SDP Colin George *1,36232.6N/A
Labour Kevin Lee1,12927.1−0.7
Majority3207.7
Turnout 4,17337.4
Conservative gain from SDP Swing Decrease2.svg10.7
Prittlewell
PartyCandidateVotes%±%
SLD Nigel Baker 2,041 50.4 −9.1
Conservative Estrellita Stanley1,38234.1+7.6
Labour Denis Garne62815.5+1.5
Majority65916.3
Turnout 4,05134.5
SLD hold Swing Decrease2.svg8.4
Shoebury
PartyCandidateVotes%±%
Conservative David Cotgrove * 2,400 65.0 +16.1
Labour Nigel Boorman90024.4−2.7
SLD Granville Stride39410.7−5.2
Majority1,50040.6
Turnout 3,69429.1
Conservative hold Swing Increase2.svg9.4
Southchurch
PartyCandidateVotes%±%
Conservative Brian Kelly * 1,948 56.5 +10.4
Labour Robert Brown1,02529.7+8.5
SLD Alistair Miller47313.7−19.0
Majority92326.8
Turnout 3,44632.3
Conservative hold Swing Increase2.svg1.0
Thorpe
PartyCandidateVotes%±%
Conservative Kay Twitchen 2,280 65.8 +7.6
Labour Kevin Ryan59217.1−1.2
SLD Robin Moore59217.1−4.4
Majority1,68848.7
Turnout 3,46432.1
Conservative hold Swing Increase2.svg4.4
Victoria
PartyCandidateVotes%±%
Labour Ronald Kennedy 2,112 57.6 +6.9
Conservative Richard Higgs1,19432.6+5.2
SLD Robert McMullan3599.8−12.0
Majority91825.0
Turnout 3,66534.8
Labour hold Swing Increase2.svg1.7
Westborough
PartyCandidateVotes%±%
SLD Mary Lubel * 2,077 54.4 +7.4
Conservative Richard Brown1,17530.8−4.9
Labour Keith Stone56814.9−2.4
Majority90223.6
Turnout 3,82034.4
SLD hold Swing Increase2.svg6.2

Tendring

Tendring District Summary
PartySeats+/-Votes%+/-
Conservative 4Steady2.svg15,92540.4–1.1
Labour 2Steady2.svg11,96130.3+2.6
SLD 2Steady2.svg11,32928.7–1.7
Independent 0Steady2.svg2260.6+0.2
Total8Steady2.svg39,41139.3–0.4

Division results

Brightlingsea
PartyCandidateVotes%±%
SLD Thomas Dale * 1,969 39.3 −10.4
Conservative Ronald Marshall1,86937.3+1.3
Labour Cornelius Olivier1,17523.4+9.1
Majority1002.0
Turnout 5,01342.2
SLD hold Swing Decrease2.svg5.9
Clacton East
PartyCandidateVotes%±%
Conservative John Story * 2,206 44.0 −7.0
SLD Jean Duke2,12642.4+9.9
Labour Irene Jefferson67913.6−3.0
Majority801.6
Turnout 5,01140.0
Conservative hold Swing Decrease2.svg8.5
Clacton North
PartyCandidateVotes%±%
SLD Pauline Bevan 3,553 62.9 +7.4
Conservative Martin Amos1,32223.4−3.7
Labour Geoffrey Aldous77213.7−3.7
Majority2,23139.5
Turnout 5,64741.1
SLD hold Swing Increase2.svg5.6
Clacton West
PartyCandidateVotes%±%
Labour Roy Smith * 2,738 57.7 +11.0
Conservative Jill Winer1,54932.7−0.4
SLD Peter Miller4559.6−9.6
Majority1,18925.1
Turnout 4,74235.6
Labour hold Swing Increase2.svg5.7
Frinton & Walton
PartyCandidateVotes%±%
Conservative David Rex * 3,655 65.0 +6.9
Labour Peter Lawes1,18521.1+8.1
SLD Robert Hamilton77913.9−15.0
Majority2,47044.0
Turnout 5,61938.5
Conservative hold Swing Decrease2.svg0.6
Harwich
PartyCandidateVotes%±%
Labour Ralph Knight * 2,786 57.2 −1.9
Conservative Frederick Lucas1,34727.6−13.3
SLD Michael Sears73915.2N/A
Majority1,43929.5
Turnout 4,87241.1
Labour hold Swing Increase2.svg5.7
Tendring Rural East
PartyCandidateVotes%±%
Conservative Charles Lumber * 1,875 51.5 +9.7
Labour Kenneth Rose1,20733.1+0.7
SLD Alan Wallis56215.4−10.4
Majority66818.3
Turnout 3,64434.0
Conservative hold Swing Increase2.svg4.5
Tendring Rural West
PartyCandidateVotes%±%
Conservative Douglas Pallett * 2,102 43.0 −0.4
Labour Lionel Randall1,41929.0+4.4
SLD Rosemary Smith1,14623.4−5.9
Independent Peter Bates2264.6N/A
Majority68314.0
Turnout 4,89341.7
Conservative hold Swing Decrease2.svg2.4

Thurrock

Thurrock District Summary
PartySeats+/-Votes%+/-
Labour 7Decrease2.svg 115,76254.9–11.9
Conservative 1Increase2.svg 110,40636.2+3.3
SLD 0Steady2.svg1,5075.2N/A
Ind. Labour Party 0Steady2.svg1,0453.6N/A
Total8Steady2.svg28,72030.3+3.6

Division results

Chadwell
PartyCandidateVotes%±%
Labour Gerard Rice 2,589 70.4 −0.8
Conservative Paul Ciechomski89724.4−4.4
SLD Joan Overy1915.2N/A
Majority1,69246.0
Turnout 3,67730.6
Labour hold Swing Increase2.svg1.8
Corringham
PartyCandidateVotes%±%
Labour George Miles 1,435 47.9 −18.2
Conservative Robert Hunter1,27142.5+8.6
SLD Sidney Senior2889.6N/A
Majority1645.5
Turnout 2,99428.0
Labour hold Swing Decrease2.svg13.4
Grays Thurrock
PartyCandidateVotes%±%
Labour Beverly Barton * 2,251 49.2 −6.0
Conservative Douglas Sutton2,01243.9−0.9
SLD Tony Scott3156.9N/A
Majority2395.2
Turnout 4,57833.8
Labour hold Swing Decrease2.svg2.6
Orsett & Stifford
PartyCandidateVotes%±%
Conservative Peter Revell 2,513 52.4 +9.0
Labour John Pollard *1,98741.4−15.2
SLD Alan Banton3006.3N/A
Majority52611.0
Turnout 4,80043.4
Conservative gain from Labour Swing Increase2.svg12.1
South Ockendon
PartyCandidateVotes%±%
Labour Margaret Jones 2,188 72.3 −9.0
Conservative Susan Dalton83827.7+9.0
Majority1,35044.6
Turnout 3,02628.2
Labour hold Swing Decrease2.svg9.0
Stanford-le-Hope
PartyCandidateVotes%±%
Labour Julian Norris * 1,869 54.8 −9.1
Conservative William Lea1,27837.5+1.4
SLD Michael Birch2647.7N/A
Majority59117.3
Turnout 3,41126.8
Labour hold Swing Decrease2.svg5.3
Tilbury
PartyCandidateVotes%±%
Labour Patrick Bolger * 1,892 75.2 −6.9
Conservative Marie Bamford-Burst47518.9+3.9
SLD Vixien Howard1495.9N/A
Majority1,41756.3
Turnout 2,51621.2
Labour hold Swing Decrease2.svg5.4
West Thurrock & Aveley
PartyCandidateVotes%±%
Labour Reginald Lee 1,551 41.7 −29.3
Conservative Henry Cook1,12230.2+1.2
Ind. Labour Party Edward Vellacott1,04528.1N/A
Majority42911.5
Turnout 3,71830.8
Labour hold Swing Decrease2.svg15.3

Uttlesford

Uttlesford District Summary
PartySeats+/-Votes%+/-
Conservative 4Steady2.svg9,87648.8+0.6
SLD 0Steady2.svg6,07830.1–0.7
Labour 0Steady2.svg3,93919.5–0.9
Green 0Steady2.svg3321.6N/A
Total4Steady2.svg20,22540.5–1.9

Division results

Dunmow
PartyCandidateVotes%±%
Conservative Michael Stephen * 2,686 62.1 +9.2
SLD Nicholas Patterson87220.2−11.8
Labour Jennifer Oliveira76717.7+5.2
Majority1,81441.9
Turnout 4,32537.4
Conservative hold Swing Increase2.svg10.5
Saffron Walden
PartyCandidateVotes%±%
Conservative Stephen Neville * 2,373 37.3 −4.3
Labour Russell Green1,95830.8−3.3
SLD Donald Benson1,69926.7+2.3
Green Kevin Saunders3325.2N/A
Majority4156.5
Turnout 6,36243.3
Conservative hold Swing Decrease2.svg0.5
Stansted
PartyCandidateVotes%±%
Conservative Philip Duly 2,494 48.4 −0.8
SLD Raymond Clifford2,14041.5+5.7
Labour Robin Shaw52010.1−2.5
Majority3546.9
Turnout 5,15441.5
Conservative hold Swing Decrease2.svg3.3
Thaxted
PartyCandidateVotes%±%
Conservative John Whitehead 2,423 54.0 +1.8
SLD John Gibb1,36730.5−3.1
Labour Katherine Donovan69415.5+1.3
Majority1,05623.6
Turnout 4,48439.6
Conservative hold Swing Increase2.svg2.5

By-elections

Old Heath

Old Heath: May 1990
PartyCandidateVotes%±%
Labour Christopher Pearson 2,384 40.1 +4.2
Liberal Democrats Vincent Edkins2,10335.4–0.3
Conservative Edward Winney1,03917.5–1.9
SDP John Parrick4167.0N/A
Majority2814.7
Turnout 5,94248.1
Registered electors 12,350
Labour hold Swing Increase2.svg2.3


Brentwood Central

Brentwood Central: June 1990
PartyCandidateVotes%±%
Liberal Democrats Edgar Davis 2,210 56.0 +21.6
Conservative John Hutton1,33933.9–14.6
Labour Francis Keohane2496.3–4.2
Green Philip Ray892.3–4.3
SDP Samuel Ormsby320.8N/A
Independent James Holdsworth280.7N/A
Majority87122.1
Turnout 3,94740.1
Registered electors 9,853
Liberal Democrats gain from Conservative Swing Increase2.svg18.1

Dunmow

Dunmow: May 1991
PartyCandidateVotes%±%
Conservative David Westcott 2,937 56.4 –5.7
Liberal Democrats John Gibb1,45127.9+7.7
Labour David Cole81715.7–2.0
Majority1,48628.5
Turnout 5,20545.1
Registered electors 11,532
Conservative hold Swing Decrease2.svg6.7

Basildon Laindon

Basildon Laindon: September 1991
PartyCandidateVotes%±%
Conservative David Walsh 1,780 48.4 +13.1
Labour Harold Bruce1,36037.0–17.6
Liberal Democrats Simon Wilson538538+4.4
Majority42011.4
Turnout 3,67833.2
Registered electors 11,063
Conservative gain from Labour Swing Increase2.svg15.4

Brentwood Hutton

Brentwood Hutton: September 1992
PartyCandidateVotes%±%
Conservative Alun Thomas 1,872 57.9 –4.9
Liberal Democrats Katharine Spanton1,19136.8+18.6
Labour Edward O'Brien1725.3–13.7
Majority68121.1
Turnout 3,23526.8
Registered electors 12,183
Conservative hold Swing Decrease2.svg11.8

Related Research Articles

Buckinghamshire County Council in England was elected every four years from 1973 until 2020.

<span class="mw-page-title-main">Castle Point Borough Council elections</span> Local government elections in Essex, England

Castle Point Borough Council in Essex, England holds an election for the whole council every four years. From 2003 to 2023 a third of the council was elected every year for three years, with no election in the fourth. Since the last boundary changes in 2024, 39 councillors have been elected from 13 wards.

Essex County Council in England is elected every four years. Since the last boundary changes in 2005, 75 councillors are elected from 70 wards.

Surrey County Council is elected every four years and was made in 1889 under the Local Government Act 1888. Since 1965 this council has had one of two statuses as to its body of councillors: no overall political control, or overall Conservative party control.

<span class="mw-page-title-main">Essex County Council</span> English principal local authority in the East of England

Essex County Council is the county council that governs the non-metropolitan county of Essex in England. It has 75 councillors, elected from 70 divisions, and has been under Conservative majority control since 2001. The council meets at County Hall in the centre of Chelmsford. It is a member of the East of England Local Government Association.

One third of Harlow District Council in Essex, England, is elected each year, followed by one year when there is an election to Essex County Council instead. Since the last boundary changes in 2002, 33 councillors have been elected from 11 wards.

<span class="mw-page-title-main">2003 Harlow District Council election</span>

The 2003 Harlow District Council election took place on 1 May 2003 to elect members of Harlow District Council in Essex, England. One third of the council was up for election and the council stayed under no overall control.

<span class="mw-page-title-main">2009 Essex County Council election</span> 2009 UK local government election

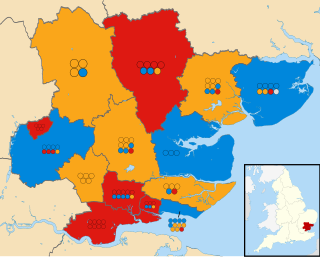
An election to Essex County Council took place on 4 June 2009 as part of the 2009 United Kingdom local elections. The elections had been delayed from 7 May, to coincide with elections to the European Parliament. 75 councillors were elected from various electoral divisions, which returned either one or two county councillors each by first-past-the-post voting for a four-year term of office. The electoral divisions were the same as those used at the previous election in 2005.

The 2002 Colchester Borough Council election took place on 2 May 2002 to elect members of Colchester Borough Council in Essex, England. This was the same day as the other 2002 local elections in the United Kingdom.

<span class="mw-page-title-main">2013 Essex County Council election</span> 2013 UK local government election

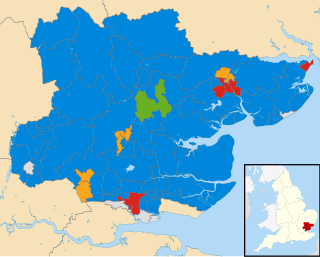
The 2013 Essex County Council election took place on 2 May 2013 to elect members of Essex County Council in Essex, England. They were held on the same day as other local elections. 75 councillors were elected from 70 electoral divisions, which returned either one or two county councillors each by first-past-the-post voting for a four-year term of office. The electoral divisions were the same as those used at the previous election in 2009. No elections were held in Thurrock or Southend-on-Sea, which are unitary authorities outside the area covered by the County Council.

<span class="mw-page-title-main">2003 Colchester Borough Council election</span> 2003 UK local government election

The 2003 Colchester Borough Council election took place on 1 May 2003 to elect members of Colchester Borough Council in Essex, England. This was the same day as the other 2003 United Kingdom local elections. One third of the seats were up for election and the council stayed under no overall control.

<span class="mw-page-title-main">2005 Essex County Council election</span> English local authority election

An election to Essex County Council took place on 9 May 2005 as part of the 2005 United Kingdom local elections. 75 councillors were elected from various electoral divisions, which returned either one or two county councillors each by first-past-the-post voting for a four-year term of office. The electoral divisions were redrawn for this election.

<span class="mw-page-title-main">2001 Essex County Council election</span> 2001 UK local government election

The 2001 Essex County Council election took place on 7 June 2001 to elect members of Essex County Council in Essex, England. This was on the same day as other local elections and the 2001 general election.

<span class="mw-page-title-main">1997 Essex County Council election</span> 1997 UK local government election

The 1997 Essex County Council election took place on 1 May 1997 to elect members of Essex County Council in Essex, England. This was held on the same day as other local elections and the 1997 general election.

<span class="mw-page-title-main">1993 Essex County Council election</span> 1993 UK local government election

The 1993 Essex County Council election took place on 6 May 1993 to elect members of Essex County Council in Essex, England. It was held on the same day as other local elections.

<span class="mw-page-title-main">1985 Essex County Council election</span> Local government contest in the East of England

The 1985 Essex County Council election took place on 2 May 1985 as part of the 1985 United Kingdom local elections. 98 councillors were elected from various electoral divisions, which returned either one or two county councillors each by first-past-the-post voting for a four-year term of office.

<span class="mw-page-title-main">2000 Colchester Borough Council election</span> 2000 UK local government election

The 2000 Colchester Borough Council election took place on 4 May 2000 to elect members of Colchester Borough Council in Essex, England. One third of the council was up for election and the council stayed under no overall control.

<span class="mw-page-title-main">2004 Castle Point Borough Council election</span> 2004 UK local government election

The 2004 Castle Point Borough Council election took place on 10 June 2004 to elect members of Castle Point Borough Council in Essex, England. One third of the council was up for election and the Conservative party stayed in overall control of the council.

<span class="mw-page-title-main">2017 Essex County Council election</span> 2017 UK local government election

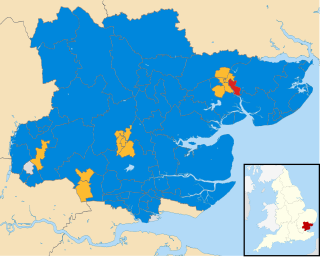
Elections to Essex County Council took place on 4 May 2017 as part of the 2017 local elections. All 75 councillors were elected from 70 electoral divisions, which each returned either one or two councillors by first-past-the-post voting for a four-year term of office.

<span class="mw-page-title-main">2021 Essex County Council election</span> 2021 UK local government election

The 2021 Essex County Council election took place on 6 May 2021 as part of the 2021 United Kingdom local elections. All 75 councillors were elected from 70 electoral divisions, with each returning either one or two councillors by first-past-the-post voting for a four-year term of office.

References

  1. "Elections". Archived from the original on 2 February 2014. Retrieved 7 February 2014.
  2. "Elections" . Retrieved 11 February 2014.