| |||||||||||||||||||||||||||||||||||||||||||||||||||||||||||
14 out of 41 seats to Basildon Borough Council 21 seats needed for a majority | |||||||||||||||||||||||||||||||||||||||||||||||||||||||||||
---|---|---|---|---|---|---|---|---|---|---|---|---|---|---|---|---|---|---|---|---|---|---|---|---|---|---|---|---|---|---|---|---|---|---|---|---|---|---|---|---|---|---|---|---|---|---|---|---|---|---|---|---|---|---|---|---|---|---|---|
| |||||||||||||||||||||||||||||||||||||||||||||||||||||||||||
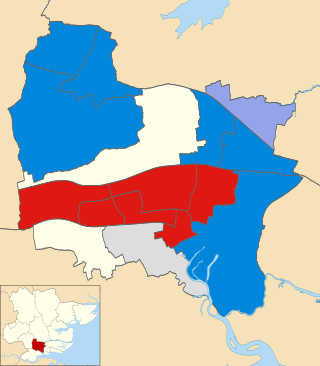
Winner of each seat at the 2022 Basildon Borough Council election | |||||||||||||||||||||||||||||||||||||||||||||||||||||||||||
|
The 2022 Basildon Borough Council election took place on 5 May 2022 to elect members of Basildon Borough Council in Essex. [1] This was on the same day as other local elections.
2022 Basildon Borough Council election | ||||||||||
---|---|---|---|---|---|---|---|---|---|---|
Party | This election | Full council | This election | |||||||
Seats | Net | Seats % | Other | Total | Total % | Votes | Votes % | +/− | ||
Conservative | 10 | 71.4 | 12 | 22 | 53.7 | 16,325 | 49.0 | +0.3 | ||
Labour | 2 | 1 | 14.3 | 8 | 10 | 24.4 | 7,861 | 23.6 | +0.7 | |
Independent | 2 | 1 | 14.3 | 5 | 7 | 17.1 | 3,147 | 9.5 | -0.5 | |
Wickford Ind. | 0 | 0.0 | 2 | 2 | 4.9 | 2,133 | 6.4 | +3.8 | ||
Liberal Democrats | 0 | 0.0 | 0 | 0 | 0.0 | 3,528 | 10.6 | +1.6 | ||
Reform UK | 0 | 0.0 | 0 | 0 | 0.0 | 157 | 0.5 | -0.9 | ||
British Democratic | 0 | 0.0 | 0 | 0 | 0.0 | 100 | 0.3 | N/A | ||
TUSC | 0 | 0.0 | 0 | 0 | 0.0 | 47 | 0.1 | N/A | ||
Party | Candidate | Votes | % | ±% | |
---|---|---|---|---|---|
Conservative | Andrew Schrader | 2,062 | 67.1 | -2.8 | |
Liberal Democrats | Laura Clark | 604 | 19.7 | +9.1 | |
Labour | Peter Bunyan | 405 | 13.2 | -3.8 | |
Majority | 1,458 | 47.4 | |||
Turnout | 3,071 | 32.5 | |||
Conservative hold | Swing | 6.0 | |||
Party | Candidate | Votes | % | ±% | |
---|---|---|---|---|---|
Conservative | Anthony Hedley | 2,005 | 56.6 | +6.6 | |
Liberal Democrats | Timothy Nicklin | 1,329 | 37.5 | -7.2 | |
Labour | Sally Bunyan | 206 | 5.8 | +0.5 | |
Majority | 676 | 19.1 | |||
Turnout | 3,540 | 37.6 | |||
Conservative hold | Swing | 6.9 | |||
Party | Candidate | Votes | % | ±% | |
---|---|---|---|---|---|
Conservative | Andrew Baggott | 1,948 | 65.7 | -10.2 | |
Liberal Democrats | John Daffin | 687 | 23.2 | +11.7 | |
Labour | Malcolm Reid | 332 | 11.2 | -1.4 | |
Majority | 1,261 | 42.5 | |||
Turnout | 2,967 | 33.9 | |||
Conservative hold | Swing | 11.0 | |||
Party | Candidate | Votes | % | ±% | |
---|---|---|---|---|---|
Conservative | Terri Sargent | 1,311 | 76.3 | +4.8 | |
Labour | Tracey Hilton | 408 | 23.7 | +8.1 | |
Majority | 903 | 52.6 | |||
Turnout | 1,719 | 25.5 | |||
Conservative hold | Swing | 1.7 | |||
Party | Candidate | Votes | % | ±% | |
---|---|---|---|---|---|
Labour | David Kirkman | 1,074 | 56.3 | +15.3 | |
Conservative | Sandeep Sandhu | 624 | 32.7 | -0.4 | |
Liberal Democrats | Vivien Howard | 209 | 11.0 | +8.2 | |
Majority | 450 | 23.6 | |||
Turnout | 1,907 | 18.2 | |||
Labour hold | Swing | 7.9 | |||
Party | Candidate | Votes | % | ±% | |
---|---|---|---|---|---|
Conservative | Jeff Henry | 1,123 | 51.8 | -2.8 | |
Labour | David Goddard | 763 | 35.2 | +8.2 | |
Liberal Democrats | Stephen McCarthy | 136 | 6.3 | +2.8 | |
British Democrats | Christopher Bateman | 100 | 4.6 | N/A | |
TUSC | David Murray | 47 | 2.2 | N/A | |
Majority | 360 | 16.6 | |||
Turnout | 2,169 | 21.7 | |||
Conservative hold | Swing | 5.5 | |||
Party | Candidate | Votes | % | ±% | |
---|---|---|---|---|---|
Independent | Walter Brown | 1,201 | 50.3 | +17.1 | |
Conservative | Christopher Allen | 883 | 37.0 | -6.0 | |
Labour | Clarence Zwengunde | 237 | 9.9 | -2.6 | |
Liberal Democrats | Christopher May | 68 | 2.8 | -8.4 | |
Majority | 318 | 13.3 | |||
Turnout | 2,389 | 34.2 | |||
Independent gain from Conservative | Swing | 11.6 | |||
Party | Candidate | Votes | % | ±% | |
---|---|---|---|---|---|
Labour | Susanna Caira-Neeson | 1,006 | 55.5 | +16.5 | |
Conservative | Deepak Shukla | 649 | 35.8 | -1.4 | |
Reform UK | Norma Saggers | 157 | 8.7 | +3.7 | |
Majority | 357 | 19.7 | |||
Turnout | 1,812 | 17.9 | |||
Labour hold | Swing | 9.0 | |||
Party | Candidate | Votes | % | ±% | |
---|---|---|---|---|---|
Independent | Kerry Smith | 1,946 | 69.8 | +24.1 | |
Labour | Dylan Wright | 402 | 14.4 | -2.2 | |
Conservative | Chima Okorafor | 334 | 12.0 | -8.4 | |
Liberal Democrats | Stephen Nice | 106 | 3.8 | +0.2 | |
Majority | 1,544 | 55.4 | |||
Turnout | 2,788 | 26.8 | |||
Independent hold | Swing | 13.2 | |||
Party | Candidate | Votes | % | ±% | |
---|---|---|---|---|---|
Conservative | Sam Gascoyne | 931 | 47.1 | +5.3 | |
Labour | Jack Ferguson | 911 | 46.1 | -0.5 | |
Liberal Democrats | Martin Howard | 133 | 6.7 | +4.0 | |
Majority | 20 | 1.0 | |||
Turnout | 1,975 | 21.3 | |||
Conservative gain from Labour | Swing | 2.9 | |||
Party | Candidate | Votes | % | ±% | |
---|---|---|---|---|---|
Conservative | Luke Mackenzie | 1,327 | 59.7 | +12.6 | |
Labour | Michael Baker | 896 | 40.3 | -4.4 | |
Majority | 431 | 19.4 | |||
Turnout | 2,223 | 24.2 | |||
Conservative hold | Swing | 8.5 | |||
Party | Candidate | Votes | % | ±% | |
---|---|---|---|---|---|
Conservative | Alex Myers | 1,030 | 52.1 | -1.9 | |
Labour | Matthew Wright | 458 | 23.2 | +11.1 | |
Wickford Ind. | Charles Sansom | 420 | 21.3 | -12.6 | |
Liberal Democrats | Stewart Mott | 68 | 3.4 | N/A | |
Majority | 572 | 28.9 | |||
Turnout | 1,976 | 30.7 | |||
Conservative hold | Swing | 6.5 | |||
Party | Candidate | Votes | % | ±% | |
---|---|---|---|---|---|
Conservative | Peter Holliman | 1,224 | 41.6 | -1.0 | |
Wickford Ind. | Trevor Hammond | 1,115 | 37.9 | -7.0 | |
Labour | Joseph Nemeth | 415 | 14.1 | +1.6 | |
Liberal Democrats | Nicola Hoad | 188 | 6.4 | N/A | |
Majority | 109 | 3.7 | |||
Turnout | 2,942 | 28.4 | |||
Conservative hold | Swing | 3.0 | |||
Party | Candidate | Votes | % | ±% | |
---|---|---|---|---|---|
Conservative | George Jeffrey | 874 | 48.0 | +19.1 | |
Wickford Ind. | Alan Ball | 598 | 32.9 | -38.2 | |
Labour | Brenda Webb | 348 | 19.1 | N/A | |
Majority | 276 | 15.1 | |||
Turnout | 1,820 | 24.6 | |||
Conservative hold | Swing | 28.7 | |||
Party | Candidate | Votes | % | ±% | ||
---|---|---|---|---|---|---|
Independent | Mo Larkin | 909 | 62.7 | N/A | ||
Conservative | Mark Cottrell | 233 | 16.1 | -4.1 | ||
Labour | Dylan Wright | 169 | 11.7 | -2.7 | ||
Liberal Democrats | Stephen Nice | 102 | 7.0 | +3.2 | ||
Reform UK | Michael Kinnane | 37 | 2.6 | N/A | ||
Majority | 676 | 46.6 | N/A | |||
Turnout | 1,450 | |||||
Independent gain from Independent | ||||||
Castle Point is a local government district with borough status in south Essex, England, lying 30 miles (48 km) east of central London. The borough comprises an area on the mainland and the adjoining Canvey Island in the Thames Estuary, which is connected to the mainland by bridges. The council is based in Thundersley. The borough's other main settlements are Canvey Island, Hadleigh and South Benfleet.
The Borough of Basildon is a local government district with borough status in Essex, England. The borough is named after its largest town, Basildon, where the council is based. The borough also includes the towns of Billericay and Wickford and surrounding rural areas.
In the context of local authorities in the United Kingdom, no overall control is a situation in which no single political group achieves a majority of seats, analogous to a hung parliament. Of the 248 councils who had members up for election in the 2019 local elections, 73 resulted in a NOC administration. In the 2021 election, 14 resulted in no overall control. The term can still be used for several other countries, such as for two local councils of Malta and the General Assembly of Budapest in Hungary.
One third of Basildon Borough Council in Essex, England is elected each year, followed by one year without election. Since the last boundary changes in 2002, 42 councillors have been elected from 16 wards.
One third of Castle Point Borough Council in Essex, England is elected each year, followed by one year without election. Until 2003 the whole council was elected every four years. Since the last boundary changes in 2003, 41 councillors have been elected from 14 wards.
South Basildon and East Thurrock is a constituency represented in the House of Commons of the UK Parliament since its 2010 creation by Stephen Metcalfe, a Conservative.
Essex County Council in England is elected every four years. Since the last boundary changes in 2005, 75 councillors are elected from 70 wards.
The 1999 Basildon District Council election took place on 6 May 1999 to elect members of Basildon District Council in Essex, England. One third of the council was up for election and the Labour party stayed in overall control of the council.
The 2000 Basildon District Council election took place on 4 May 2000 to elect members of Basildon District Council in Essex, England. One third of the council was up for election and the Labour party lost overall control of the council to no overall control.
The 2008 Basildon District Council election took place on 1 May 2008 to elect members of Basildon District Council in Essex, England. One third of the council was up for election and the Conservative party stayed in overall control of the council.
The 2010 Basildon District Council election took place on 6 May 2010 to elect members of Basildon District Council in Essex, England. One third of the council was up for election and the Conservative party stayed in overall control of the council.
The 2011 Basildon Council election took place on 5 May 2011 to elect members of Basildon Borough Council in Essex, England. One third of the council was up for election and the Conservative party stayed in overall control of the council.
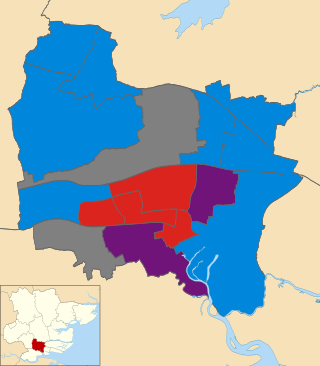
The 2015 Basildon Borough Council election took place on 7 May 2015, as part of the 2015 United Kingdom local elections, and took place alongside the UK General Election. One third of seats were up for election, with these seats last being contested in 2011. As a result of the election, the council remained in no overall control. The Conservative Party remained as the largest party, and formed a minority administration.
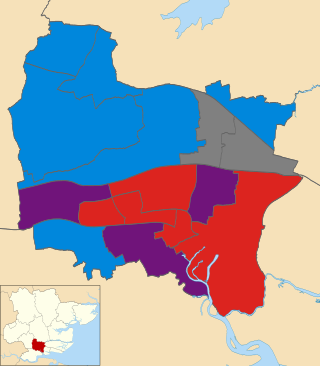
The 2016 Basildon Borough Council election took place on 5 May 2016 to elect members of Basildon Borough Council in Essex. This was on the same day as other local elections.
The 2018 United Kingdom local elections were held on Thursday 3 May 2018, with local council elections taking place in all 32 London boroughs, 34 metropolitan boroughs, 67 district and borough councils and 17 unitary authorities. There were also direct elections for the mayoralties of Hackney, Lewisham, Newham, Tower Hamlets and Watford.
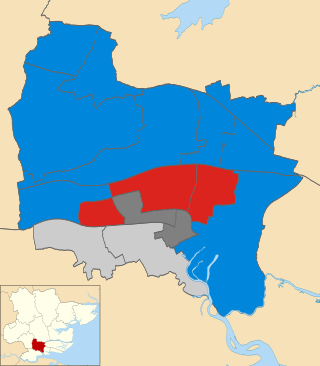
The 2018 Basildon Borough Council election took place on 3 May 2018 to elect members of Basildon Borough Council in Essex. This was on the same day as other local elections. The Conservative Party gained overall control of the council. which had previously been under no overall control and run by a coalition between UKIP, Labour and Independents.
The 2019 Basildon Borough Council election took place on 2 May 2019 to elect members of Basildon Borough Council in Essex. This was on the same day as other local elections. The Conservative Party lost control of the council. which fell under no overall control.
The 1973 Basildon Borough Council election were the first elections to the newly created Basildon District Council took place on 7 June 1973. This was on the same day as other local elections. The Local Government Act 1972 stipulated that the elected members were to shadow and eventually take over from the predecessor corporation on 1 April 1974. The election resulted in Labour gaining control of the council.
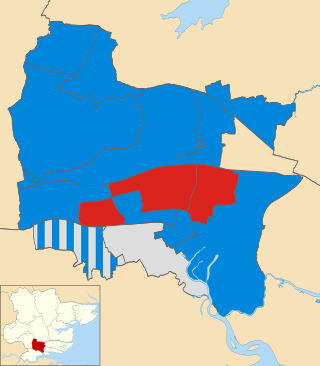
The 2021 Basildon Borough Council election took place on 6 May 2021 to elect members of Basildon Borough Council in Essex. This was on the same day as other local elections. The Conservative Party regained control of the council from no overall control.
The 2023 Basildon Borough Council election took place on 4 May 2023 to elect members of Basildon Borough Council in England. This was on the same day as other local elections in England.