| |||||||||||||||||||||||||||||||||||||
19 out of 57 seats to Milton Keynes Council 29 seats needed for a majority | |||||||||||||||||||||||||||||||||||||
---|---|---|---|---|---|---|---|---|---|---|---|---|---|---|---|---|---|---|---|---|---|---|---|---|---|---|---|---|---|---|---|---|---|---|---|---|---|
| |||||||||||||||||||||||||||||||||||||
Winner of each seat st the 2022 Milton Keynes Council election | |||||||||||||||||||||||||||||||||||||
|
The 2022 Milton Keynes Council election took place on 5 May 2022 to elect members of Milton Keynes Council. This was on the same day as other local elections.
One third of the council was up for election. [1]
2022 Milton Keynes Council election | ||||||||||
---|---|---|---|---|---|---|---|---|---|---|
Party | This election | Full council | This election | |||||||
Seats | Net | Seats % | Other | Total | Total % | Votes | Votes % | +/− | ||
Conservative | 4 | 2 | 21.1 | 18 | 22 | 38.6 | 22,750 | 35.0 | -7.0 | |
Labour | 9 | 1 | 47.4 | 11 | 20 | 35.1 | 23,734 | 36.5 | +2.5 | |
Liberal Democrats | 6 | 1 | 31.6 | 8 | 14 | 24.6 | 13,796 | 21.2 | +5.0 | |
Independent | 0 | 0.0 | 1 | 1 | 1.8 | 976 | 1.5 | +0.7 | ||
Green | 0 | 0.0 | 0 | 0 | 0.0 | 3,607 | 5.5 | -0.6 | ||
Women's Equality | 0 | 0.0 | 0 | 0 | 0.0 | 214 | 0.3 | ±0.0 | ||
Party | Candidate | Votes | % | ±% | |
---|---|---|---|---|---|
Labour | Mohammad Khan | 1,607 | 52.0 | +9.4 | |
Conservative | James Marlow | 951 | 30.8 | -6.7 | |
Liberal Democrats | Sean McCabe | 275 | 8.9 | +6.1 | |
Green | Joe French | 256 | 8.3 | -0.2 | |
Majority | 656 | 21.2 | |||
Turnout | 3,104 | 25.6 | |||
Labour hold | Swing | 8.1 | |||
Party | Candidate | Votes | % | ±% | |
---|---|---|---|---|---|
Labour Co-op | Nigel Long | 1,744 | 45.5 | +7.1 | |
Conservative | Allan Rankine | 1,672 | 43.6 | -7.0 | |
Liberal Democrats | Sarah Griffiths | 219 | 5.7 | N/A | |
Green | Michael Sheppard | 196 | 5.1 | -2.6 | |
Majority | 72 | 1.9 | |||
Turnout | 3,842 | 34.5 | |||
Labour Co-op gain from Conservative | Swing | 7.1 | |||
Party | Candidate | Votes | % | ±% | |
---|---|---|---|---|---|
Labour Co-op | Mick Legg | 1,834 | 49.1 | +7.8 | |
Conservative | Godwin Michael | 1,418 | 38.0 | -10.1 | |
Independent | Ray Brady | 172 | 4.6 | N/A | |
Liberal Democrats | Ben Adewale | 167 | 4.5 | +1.1 | |
Green | Axel Segebrecht | 141 | 3.8 | -1.0 | |
Majority | 416 | 11.1 | |||
Turnout | 3,743 | 35.8 | |||
Labour Co-op hold | Swing | 9.0 | |||
Party | Candidate | Votes | % | ±% | |
---|---|---|---|---|---|
Liberal Democrats | Rex Exon | 1,769 | 57.7 | +5.8 | |
Labour | Shadat Khan | 761 | 24.8 | +3.6 | |
Conservative | Krishna Panthula | 535 | 17.5 | -3.2 | |
Majority | 1,008 | 32.9 | |||
Turnout | 3,083 | 32.3 | |||
Liberal Democrats hold | Swing | 1.1 | |||
Party | Candidate | Votes | % | ±% | |
---|---|---|---|---|---|
Liberal Democrats | Sam Crooks | 1,971 | 51.1 | +8.2 | |
Conservative | Dev Ahuja | 1,269 | 32.9 | -7.2 | |
Labour | Monica Dowling | 615 | 16.0 | -1.1 | |
Majority | 702 | 18.2 | |||
Turnout | 3,869 | 30.3 | |||
Liberal Democrats hold | Swing | 7.7 | |||
Party | Candidate | Votes | % | ±% | |
---|---|---|---|---|---|
Liberal Democrats | Nana Oguntola | 1,712 | 44.7 | +9.8 | |
Conservative | John Hearnshaw | 1,404 | 36.6 | -5.9 | |
Labour | Christian Durugo | 715 | 18.7 | +1.3 | |
Majority | 308 | 8.1 | |||
Turnout | 3,851 | 39.0 | |||
Liberal Democrats gain from Conservative | Swing | 7.9 | |||
Party | Candidate | Votes | % | ±% | |
---|---|---|---|---|---|
Labour | Moriah Priestley | 1,365 | 54.2 | +8.6 | |
Conservative | Haider Imran | 646 | 25.6 | -4.1 | |
Liberal Democrats | Russell Houchin | 508 | 20.2 | +10.2 | |
Majority | 719 | 12.7 | |||
Turnout | 2,545 | 25.1 | |||
Labour hold | Swing | 6.4 | |||
Party | Candidate | Votes | % | ±% | |
---|---|---|---|---|---|
Conservative | David Hopkins | 1,764 | 49.9 | -7.8 | |
Labour | Veronica Belcher | 918 | 26.0 | +6.4 | |
Green | Peter Skelton | 451 | 12.8 | -0.7 | |
Liberal Democrats | Rebecca Cave | 401 | 11.3 | +2.0 | |
Majority | 846 | 23.9 | |||
Turnout | 3,551 | 33.5 | |||
Conservative hold | Swing | 7.1 | |||
Party | Candidate | Votes | % | ±% | |
---|---|---|---|---|---|
Labour Co-op | Shanika Mahendran | 2,145 | 51.9 | +3.3 | |
Conservative | Ethan Wilkinson | 1,564 | 37.8 | -4.6 | |
Liberal Democrats | Stephen Clark | 232 | 5.6 | +1.0 | |
Green | Dominic Taylor | 194 | 4.7 | +0.2 | |
Majority | 581 | 14.1 | |||
Turnout | 4,151 | 41.6 | |||
Labour Co-op gain from Conservative | Swing | 4.0 | |||
Party | Candidate | Votes | % | ±% | |
---|---|---|---|---|---|
Liberal Democrats | Jennifer Ferrans | 1,540 | 58.0 | +5.5 | |
Conservative | Jaime Tamagnini | 596 | 22.4 | -5.7 | |
Labour | Martin Petchey | 521 | 19.6 | +0.2 | |
Majority | 944 | 35.6 | |||
Turnout | 2,671 | 29.2 | |||
Liberal Democrats hold | Swing | 5.6 | |||
Party | Candidate | Votes | % | ±% | |
---|---|---|---|---|---|
Conservative | Liam Andrews | 1,655 | 46.8 | -9.8 | |
Labour | Carol Wood | 768 | 21.7 | +5.5 | |
Liberal Democrats | Tony Oyakhire | 653 | 18.5 | -3.0 | |
Green | Gary Lloyd | 247 | 7.0 | N/A | |
Women's Equality | Jane Whild | 214 | 6.1 | +0.4 | |
Majority | 887 | 25.1 | |||
Turnout | 3,555 | 36.2 | |||
Conservative hold | Swing | 7.7 | |||
Party | Candidate | Votes | % | ±% | |
---|---|---|---|---|---|
Liberal Democrats | Andy Carr | 1,620 | 50.5 | +12.4 | |
Conservative | Yusrah Kayani | 1,068 | 33.3 | -8.9 | |
Labour | Stephen Brown | 520 | 16.2 | +2.3 | |
Majority | 552 | 17.2 | |||
Turnout | 3,233 | 35.8 | |||
Liberal Democrats hold | Swing | 10.7 | |||
Party | Candidate | Votes | % | ±% | |
---|---|---|---|---|---|
Conservative | Peter Geary | 1,620 | 40.3 | -19.8 | |
Green | Catherine Rose | 850 | 21.1 | +11.4 | |
Independent | Ben Brown | 804 | 20.0 | N/A | |
Labour | Dee Bethune | 746 | 18.6 | -7.5 | |
Majority | 770 | 19.2 | |||
Turnout | 4,034 | 41.8 | |||
Conservative hold | Swing | 15.6 | |||
Party | Candidate | Votes | % | ±% | |
---|---|---|---|---|---|
Liberal Democrats | Peter Cannon | 1,487 | 46.3 | +13.8 | |
Conservative | Ade Adeliyi | 1,113 | 34.7 | -7.1 | |
Labour | Akash Nayee | 610 | 19.0 | -1.4 | |
Majority | 374 | 20.9 | |||
Turnout | 3,240 | 33.9 | |||
Liberal Democrats hold | Swing | 10.5 | |||
Party | Candidate | Votes | % | ±% | |
---|---|---|---|---|---|
Labour | Naseem Khan | 1,840 | 46.2 | +4.6 | |
Conservative | Babs Wright | 1,521 | 38.2 | -7.4 | |
Green | Peter Edwards | 333 | 8.4 | +0.3 | |
Liberal Democrats | Greg Duffield | 292 | 7.3 | +2.6 | |
Majority | 319 | 8.0 | |||
Turnout | 4,007 | 35.9 | |||
Labour hold | Swing | 6.0 | |||
Party | Candidate | Votes | % | ±% | |
---|---|---|---|---|---|
Labour | Jennifer Wilson-Marklew | 2,295 | 52.8 | +11.2 | |
Conservative | Rajeev Sharma | 1,518 | 34.9 | -10.0 | |
Liberal Democrats | Richard Greenwood | 285 | 6.6 | -0.3 | |
Green | Anthony Lewis | 247 | 5.7 | -0.9 | |
Majority | 777 | 21.2 | |||
Turnout | 4,363 | 37.8 | |||
Labour hold | Swing | 10.6 | |||
Party | Candidate | Votes | % | ±% | |
---|---|---|---|---|---|
Conservative | Fathima Muzammil | 1,167 | 43.7 | -8.0 | |
Labour | Rukhsana Malik | 990 | 37.0 | +2.6 | |
Green | Rebecca Bjorck | 268 | 10.0 | +1.2 | |
Liberal Democrats | Steven Walden | 248 | 9.3 | +4.2 | |
Majority | 177 | 6.7 | |||
Turnout | 2,695 | 31.2 | |||
Conservative gain from Labour | Swing | 5.3 | |||
Party | Candidate | Votes | % | ±% | |
---|---|---|---|---|---|
Labour Co-op | Robert Middleton | 2,051 | 59.7 | +7.6 | |
Conservative | Jonathan Street | 781 | 22.7 | -4.1 | |
Green | Alan Francis | 424 | 12.4 | +2.4 | |
Liberal Democrats | Thais Portilho | 177 | 5.2 | +1.5 | |
Majority | 1,270 | 37.0 | |||
Turnout | 3,446 | 31.8 | |||
Labour Co-op hold | Swing | 5.9 | |||
Party | Candidate | Votes | % | ±% | |
---|---|---|---|---|---|
Labour | Amber McQuillan | 1,689 | 69.9 | +12.2 | |
Conservative | Tatiana Vassilakis | 488 | 20.2 | -5.9 | |
Liberal Democrats | Raissa Roy | 240 | 9.9 | +4.3 | |
Majority | 1,201 | 49.7 | |||
Turnout | 2,437 | 21.3 | |||
Labour hold | Swing | 9.1 | |||
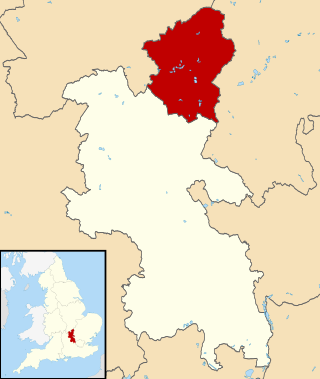
The City of Milton Keynes is a unitary authority area with both borough and city status, in Buckinghamshire. It is the northernmost district of the South East England Region. The borough abuts Bedfordshire, Northamptonshire and the remainder of Buckinghamshire.
Milton Keynes North is a constituency represented in the House of Commons of the UK Parliament since the 2019 United Kingdom general election by Ben Everitt, a Conservative. At that election, it was one of two constituencies covering the City of Milton Keynes unitary authority area.
Milton Keynes South is a constituency represented in the House of Commons of the UK Parliament since its 2010 creation by Iain Stewart, a Conservative.
Milton Keynes City Council is the local authority of the City of Milton Keynes in Buckinghamshire, England. It is a unitary authority, having the powers of a non-metropolitan county and district council combined. It has both borough status and city status. The borough, which extend beyond the ONS-defined Milton Keynes urban area and encompasses a substantial rural component, is divided into 19 wards, electing 57 councillors.
Milton Keynes City Council is the local authority for the City of Milton Keynes, a unitary authority in Buckinghamshire, England. Until 1 April 1997 it was a non-metropolitan district.
The 1999 Milton Keynes Council election took place on 6 May 1999 to elect members of Milton Keynes Unitary Council in Buckinghamshire, England. One third of the council was up for election and the Labour party stayed in overall control of the council.
The 2000 Milton Keynes Council election took place on 4 May 2000 to elect members of Milton Keynes Council in Buckinghamshire, England. One third of the council was up for election and the council stayed under no overall control.
The 2003 Milton Keynes Council election took place on 1 May 2003 to elect members of Milton Keynes Unitary Council in Buckinghamshire, England. One third of the council was up for election and the Liberal Democrats stayed in overall control of the council.
The 2004 Milton Keynes Council election took place on 10 June 2004 to elect members of Milton Keynes Unitary Council in Buckinghamshire, England. One third of the council was up for election and the Liberal Democrats stayed in overall control of the council.
The 2006 Milton Keynes Council election took place on 4 May 2006 to elect members of Milton Keynes Unitary Council in Buckinghamshire, England. One third of the council was up for election and the Liberal Democrats lost overall control of the council to no overall control.
The 2007 Milton Keynes Council election took place on 3 May 2007 to elect members of Milton Keynes Unitary Council in Buckinghamshire, England. One third of the council – the seats contested in the 2003 election – was up for election and the council remained under no overall control.
The 2008 Milton Keynes Council election took place on 1 May 2008 to elect members of Milton Keynes Unitary Council in Buckinghamshire, England. One third of the council – the 17 seats contested in the 2004 election – was up for election and the council, which totalled 51 seats, remained under no overall control.
The 2010 Milton Keynes Council election took place on 6 May 2010 to elect members of Milton Keynes Unitary Council in Buckinghamshire, England. One third of the council – the 17 seats contested in the 2006 election – was up for election and the council, which totalled 51 seats, remained under no overall control. An extra seat in Stony Stratford was also contested.
The 2011 Milton Keynes Council election took place on 5 May 2011 to elect members of Milton Keynes Unitary Council in Buckinghamshire, England. One third of the council – the 17 seats contested in the 2007 election – was up for election and the council, which totalled 51 seats, remained under no overall control.
The 2012 Milton Keynes Council election took place on Thursday 3 May 2012 to elect members of Milton Keynes Unitary Council in Buckinghamshire, England. One third of the council – the 17 seats contested in the 2008 election – was up for election and the council, which totals 51 seats, was under no overall control in advance of and after the vote. 7 of the Conservative Party's 21 seats were up for election, 4 of the Liberal Democrats's 17, 2 of the Labour's 9 and all 4 Independents.
The 2014 Milton Keynes Council election took place on 22 May 2014 to elect members of Milton Keynes Council in England. This was on the same day as other local elections. The whole council was up for election due to a re-drawing of boundaries and an increase from 51 councillors. The council was under no overall control in advance of and after the vote.
The 2015 Milton Keynes Council election took place on 7 May 2015 to elect members of Milton Keynes Council in England. This was on the same day as other local elections.
The 2018 Milton Keynes Council election took place on 3 May 2018 to elect members of Milton Keynes Council in England. This election was held on the same day as other local elections.
The 2019 Milton Keynes Council election took place on 2 May 2019 to elect members of Milton Keynes Council in England. This election was held on the same day as other local elections.
The 2021 Milton Keynes Council election took place May 6 to elect members of Milton Keynes Council in England. This was on the same day as other local elections.