Election results
| | This section is empty. You can help by adding to it. (August 2015) |
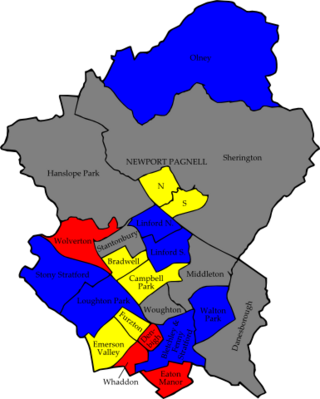
The 2015 Milton Keynes Council election took place on 7 May 2015 to elect members of Milton Keynes Council in England. [1] This was on the same day as other local elections.
| | This section is empty. You can help by adding to it. (August 2015) |
After the 2015 local election, the political make up of the council was as follows: [2]
| Party | Number of councillors |
|---|---|
| Labour | 23 |
| Conservative | 22 |
| Liberal Democrats | 12 |
| UKIP | 0 |
| Green | 0 |
| Independent | 0 |
| Party | Candidate | Votes | % | ±% | |
|---|---|---|---|---|---|
| Labour | Carole Baume | 2,105 | 36.3 | ||
| Conservative | Michael Somerton | 1,950 | 33.6 | ||
| UKIP | Vince Peddle | 1,203 | 20.7 | ||
| Green | Michael Sheppard | 304 | 5.2 | ||
| Liberal Democrats | Ian Nuttall | 239 | 4.1 | ||
| Turnout | |||||
| Party | Candidate | Votes | % | ±% | |
|---|---|---|---|---|---|
| Conservative | Ann Clancy | 2,879 | 40.3 | ||
| Labour | Elaine Wales | 2,291 | 32.1 | ||
| UKIP | Adrian Pitfield | 1,231 | 17.2 | ||
| Liberal Democrats | Susan Burke | 372 | 5.2 | ||
| Green | Sam Pancheri | 371 | 5.2 | ||
| Turnout | |||||
| Party | Candidate | Votes | % | ±% | |
|---|---|---|---|---|---|
| Conservative | Maggie Geaney | 2,610 | 37 | ||
| Labour | Moriah Priestley | 2,246 | 31.9 | ||
| UKIP | Bill Smith | 1,354 | 19.2 | ||
| Green | Liz Campbell | 472 | 6.7 | ||
| Liberal Democrats | Alfred Vella | 366 | 5.2 | ||
| Turnout | |||||
| Party | Candidate | Votes | % | ±% | |
|---|---|---|---|---|---|
| Liberal Democrats | Robin Bradburn | 2,032 | 32.8 | ||
| Labour | Rachel Pallett | 1,779 | 28.7 | ||
| Conservative | Max Chaudhry | 1,262 | 20.4 | ||
| UKIP | Cathy Kitchiner | 801 | 13 | ||
| Green | Rachel Cadger | 253 | 4.1 | ||
| TUSC | Katie Simpson | 64 | 1 | ||
| Turnout | |||||
| Party | Candidate | Votes | % | ±% | |
|---|---|---|---|---|---|
| Conservative | Catriona Morris | 2,497 | 46 | ||
| Liberal Democrats | Kerrie Bradburn | 1,652 | 30.4 | ||
| Labour | Ruth Cover | 993 | 18.3 | ||
| Green | Katrina Deacon | 296 | 5.4 | ||
| Turnout | |||||
| Party | Candidate | Votes | % | ±% | |
|---|---|---|---|---|---|
| Conservative | Peter McDonald | 2,147 | 33.4 | ||
| Liberal Democrats | Rosemary Snell | 1,801 | 28 | ||
| Labour | David Wangusi | 1,399 | 21.7 | ||
| UKIP | Zelia Izydorczyk | 593 | 9.2 | ||
| Green | Alexander Chapman | 454 | 7.1 | ||
| Independent | David Priest | 41 | 0.6 | ||
| Turnout | |||||
| Party | Candidate | Votes | % | ±% | |
|---|---|---|---|---|---|
| Labour | Paul Williams | 2,209 | 43.2 | ||
| Conservative | Terry Baines | 1,606 | 31.4 | ||
| Liberal Democrats | Marie Bradburn | 634 | 12.4 | ||
| Green | Ashley Allen | 470 | 9.2 | ||
| Independent | Darron Kendrick | 194 | 3.8 | ||
| Turnout | |||||
| Party | Candidate | Votes | % | ±% | |
|---|---|---|---|---|---|
| Conservative | Alice Bramall | 3,719 | 58.4 | ||
| Labour | Ellen Goodwin | 1,567 | 24.6 | ||
| Liberal Democrats | Russell Houchin | 587 | 9.2 | ||
| Green | Jonathan Ridgway | 498 | 7.8 | ||
| Turnout | |||||
| Party | Candidate | Votes | % | ±% | |
|---|---|---|---|---|---|
| Conservative | Andy Dransfield | 3,283 | 47.8 | ||
| Labour | David Prendergast | 2,026 | 29.5 | ||
| UKIP | David Reilly | 721 | 10.5 | ||
| Liberal Democrats | Edis Bevan | 448 | 6.5 | ||
| Green | Keri Edmonds | 392 | 5.7 | ||
| Turnout | |||||
| Party | Candidate | Votes | % | ±% | |
|---|---|---|---|---|---|
| Conservative | Andrew Buckley | 2,373 | 42.7 | ||
| Liberal Democrats | Matt Drewett | 1,486 | 26.7 | ||
| Labour | Kathryn Colgrave | 1,326 | 23.9 | ||
| Green | William Leahy | 373 | 6.7 | ||
| Turnout | |||||
| Party | Candidate | Votes | % | ±% | |
|---|---|---|---|---|---|
| Conservative | Lynn Patey-Smith | 3,476 | 49.9 | ||
| Labour | Kacper Sidorowicz | 1,064 | 15.3 | ||
| Liberal Democrats | Jane Carr | 1,028 | 14.8 | ||
| UKIP | Brian Monro | 988 | 14.2 | ||
| Green | Carol Barac | 411 | 5.9 | ||
| Turnout | |||||
| Party | Candidate | Votes | % | ±% | |
|---|---|---|---|---|---|
| Liberal Democrats | Derek Eastman | 2,328 | 36.5 | ||
| Conservative | Chris Wardle | 1,938 | 30.4 | ||
| Labour | Paul Day | 1,006 | 15.8 | ||
| UKIP | Richard Shaw | 765 | 12 | ||
| Green | Peter Edwards | 334 | 5.2 | ||
| Turnout | |||||
| Party | Candidate | Votes | % | ±% | |
|---|---|---|---|---|---|
| Conservative | David Hosking | 4,359 | 59.2 | ||
| Labour | Dee Bethune | 1,261 | 17.1 | ||
| UKIP | Dana Green | 835 | 11.3 | ||
| Liberal Democrats | Tony Oyakhire | 477 | 6.5 | ||
| Green | Catherine Rose | 430 | 5.8 | ||
| Turnout | |||||
| Party | Candidate | Votes | % | ±% | |
|---|---|---|---|---|---|
| Conservative | Hiten Ganatra | 2,097 | 34.1 | ||
| Liberal Democrats | Stuart Burke | 1,796 | 29.2 | ||
| Labour | Binta Bah-Pokawa | 1,262 | 20.6 | ||
| UKIP | Geoffrey Winter | 672 | 11 | ||
| Green | Michael Gurner | 315 | 5.1 | ||
| Turnout | |||||
| Party | Candidate | Votes | % | ±% | |
|---|---|---|---|---|---|
| Conservative | Alex Walker | 2,258 | 32.2 | ||
| Labour | Martin Petchey | 2,198 | 31.3 | ||
| UKIP | Anthony Pierson | 1,217 | 17.3 | ||
| Liberal Democrats | Bob Benning | 762 | 10.9 | ||
| Green | Jennifer Marklew | 587 | 8.4 | ||
| Turnout | |||||
| Party | Candidate | Votes | % | ±% | |
|---|---|---|---|---|---|
| Conservative | Denise Brunning | 2,208 | 40.8 | ||
| Labour | Arshad Majid | 1,543 | 28.5 | ||
| UKIP | Philip Blowfield | 767 | 14.2 | ||
| Green | Ellie Spear | 669 | 12.4 | ||
| Liberal Democrats | Paul Bailey | 226 | 4.2 | ||
| Turnout | |||||
| Party | Candidate | Votes | % | ±% | |
|---|---|---|---|---|---|
| Conservative | Geetha Morla | 2,618 | 52.2 | ||
| Labour | Sue Sullivan | 1,338 | 26.7 | ||
| UKIP | Leslie Ive | 522 | 10.4 | ||
| Liberal Democrats | Valerie Menzies | 318 | 6.3 | ||
| Green | Andrew Pancheri | 223 | 4.4 | ||
| Turnout | |||||
| Party | Candidate | Votes | % | ±% | |
|---|---|---|---|---|---|
| Labour | Peter Marland | 2,474 | 37.1 | ||
| Conservative | Shouket Mirza | 1,861 | 27.9 | ||
| UKIP | Ronen Ghose | 1,050 | 15.8 | ||
| Green | Alan Francis | 751 | 11.3 | ||
| Liberal Democrats | Masood Jehangir | 417 | 6.3 | ||
| Left Unity | Ann Parker | 113 | 1.7 | ||
| Turnout | |||||
| Party | Candidate | Votes | % | ±% | |
|---|---|---|---|---|---|
| Labour | Kevin Wilson | 3,051 | 53.8 | ||
| Conservative | Anthony Tull | 1,059 | 18.7 | ||
| UKIP | Kenny Oshodi | 1,002 | 17.7 | ||
| Green | Bassam Jundi | 322 | 5.7 | ||
| Liberal Democrats | Donna Platt | 236 | 4.2 | ||
| Turnout | |||||

Milton Keynes is a city in Buckinghamshire, England, about 50 miles (80 km) north-west of London. At the 2021 Census, the population of its urban area was 264,349. The River Great Ouse forms the northern boundary of the urban area; a tributary, the River Ouzel, meanders through its linear parks and balancing lakes. Approximately 25% of the urban area is parkland or woodland and includes two Sites of Special Scientific Interest (SSSIs). The city is made up of many different districts.

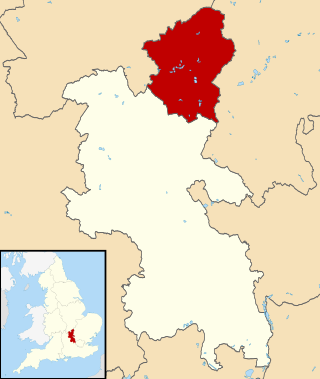
The City of Milton Keynes is a borough with city status, in Buckinghamshire, England. It is the northernmost district of the South East England Region. The borough abuts Bedfordshire, Northamptonshire and the remainder of Buckinghamshire. The borough is administered by Milton Keynes City Council, a unitary authority.

Woburn Sands is a town that straddles the border between Buckinghamshire and Bedfordshire in England, and is part of the Milton Keynes urban area. The larger part of the town is in Woburn Sands civil parish, which is in the City of Milton Keynes, Smaller parts of the town are in the neighbouring parishes of Aspley Guise and Aspley Heath. The meandering boundary between Buckinghamshire and Bedfordshire means the Lower and Middle Schools that serve all of the town are both in Aspley Guise CP. Bedfordshire Police and Thames Valley Police both deal with law enforcement issues in the town. At the 2011 Census, the population of the civil parish (only) was 2,916, that of the built-up area was 5,959. Woburn Sands, Aspley Guise and Aspley Heath each has its own centre but together the three settlements are a contiguous built-up area.

Milton Keynes North is a constituency represented in the House of Commons of the UK Parliament since the 2024 general election by Chris Curtis for the Labour Party.

Milton Keynes South was a constituency represented in the House of Commons of the UK Parliament from its 2010 creation until 2024 by Iain Stewart, a Conservative.

Milton Keynes City Council is the local authority for the City of Milton Keynes, a local government district in Buckinghamshire, England. The council was established in 1974 as Milton Keynes Borough Council. Since 1997 it has been a unitary authority, being a district council which also performs the functions of a county council; it is independent of Buckinghamshire Council, the unitary authority which administers the rest of the county.
Milton Keynes City Council is the local authority and unitary authority for the City of Milton Keynes, a borough in Buckinghamshire, England.
The 1999 Milton Keynes Council election took place on 6 May 1999 to elect members of Milton Keynes Unitary Council in Buckinghamshire, England. One third of the council was up for election and the Labour party stayed in overall control of the council.
The 2000 Milton Keynes Council election took place on 4 May 2000 to elect members of Milton Keynes Council in Buckinghamshire, England. One third of the council was up for election and the council stayed under no overall control.
The 2002 Milton Keynes Council election took place on 2 May 2002 to elect members of Milton Keynes Unitary Council in Buckinghamshire, England. The whole council was up for election with boundary changes since the last election in 2000. The Liberal Democrats gained overall control of the council from no overall control.
The 2003 Milton Keynes Council election took place on 1 May 2003 to elect members of Milton Keynes Unitary Council in Buckinghamshire, England. One third of the council was up for election and the Liberal Democrats stayed in overall control of the council.
The 2004 Milton Keynes Council election took place on 10 June 2004 to elect members of Milton Keynes Unitary Council in Buckinghamshire, England. One third of the council was up for election and the Liberal Democrats stayed in overall control of the council.

The 2006 Milton Keynes Council election took place on 4 May 2006 to elect members of Milton Keynes Unitary Council in Buckinghamshire, England. One third of the council was up for election and the Liberal Democrats lost overall control of the council to no overall control.
The 2014 Milton Keynes Council election took place on 22 May 2014 to elect members of Milton Keynes Council in England. This was on the same day as other local elections. The whole council was up for election due to a re-drawing of boundaries and an increase from 51 councillors. The council was under no overall control in advance of and after the vote.

The 2018 Milton Keynes Council election took place on 3 May 2018 to elect members of Milton Keynes Council in England. This election was held on the same day as other local elections.

The 2019 Milton Keynes Council election took place on 2 May 2019 to elect members of Milton Keynes Council in England. This election was held on the same day as other local elections.

Buckinghamshire Council is the local authority for Buckinghamshire (district), a non-metropolitan county in England. It is a unitary authority, performing both county and district-level functions. It was created on 1 April 2020, replacing the previous Buckinghamshire County Council and the councils of the four abolished districts of Aylesbury Vale, Chiltern, South Bucks, and Wycombe. The territory of the Council is about four-fifths of Buckinghamshire and has about two-thirds of its population.

Benjamin William Everitt is a British Conservative Party politician who served as the Member of Parliament (MP) for Milton Keynes North from 2019 to 2024.

The 2021 Milton Keynes Council election took place May 6 to elect members of Milton Keynes Council in England. This was on the same day as other local elections.

The 2022 Milton Keynes Council election took place on 5 May 2022 to elect members of Milton Keynes Council. This was on the same day as other local elections.