Results maps
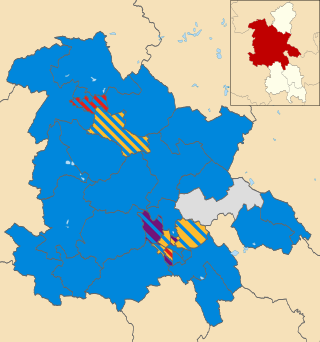
 2003 results map
 2007 results map
 2011 results map
 2015 results map
Chiltern District Council in Buckinghamshire, England was elected every four years from 1973 until 2020. [1] From the last boundary changes in 2003 until the council's abolition in 2020, 40 councillors were elected from 25 wards. [2]
From the first election to the council in 1973 until its merger into Buckinghamshire Council in 2020, political control of the council was held by the following parties: [3] [4]
| Party in control | Years | |
|---|---|---|
| Conservative | 1973–1995 | |
| No overall control | 1995–1999 | |
| Conservative | 1999–2020 | |
The leaders of the council from 2001 until its abolition in 2020 were:
| Councillor | Party | From | To | |
|---|---|---|---|---|
| Don Phillips [5] [6] [7] | Conservative | 22 May 2001 | May 2004 | |
| Tom Dodd [8] [9] | Conservative | 5 May 2004 | May 2007 | |
| John Warder [10] [11] | Conservative | 22 May 2007 | May 2010 | |
| Nick Rose [12] | Conservative | 18 May 2010 | 13 May 2014 | |
| Isobel Darby [13] [14] | Conservative | 13 May 2014 | 31 Mar 2020 | |
| Year | Conservative | Liberal Democrats | Chesham and District RA | Independent | Council control after election | |
|---|---|---|---|---|---|---|
| 2003 | 27 | 12 | 1 | 0 | Conservative | |
| 2007 | 30 | 9 | 0 | 1 | Conservative | |
| 2011 | 33 | 5 | 0 | 2 | Conservative | |
| 2015 | 35 | 3 | 0 | 2 | Conservative | |


| Party | Candidate | Votes | % | ±% | |
|---|---|---|---|---|---|
| Liberal Democrats | 380 | 31.9 | |||
| Independent | 344 | 28.9 | |||
| Conservative | 313 | 26.7 | |||
| Labour | 147 | 12.4 | |||
| Majority | 36 | 3.0 | |||
| Turnout | 1,189 | 30.4 | |||
| Liberal Democrats hold | Swing | ||||
| Party | Candidate | Votes | % | ±% | |
|---|---|---|---|---|---|
| Liberal Democrats | 365 | 54.0 | +5.4 | ||
| Conservative | 278 | 41.2 | +4.0 | ||
| Labour | 32 | 4.7 | −9.5 | ||
| Majority | 87 | 12.8 | |||
| Turnout | 675 | 43.3 | |||
| Liberal Democrats hold | Swing | ||||
| Party | Candidate | Votes | % | ±% | |
|---|---|---|---|---|---|
| Liberal Democrats | 218 | 45.1 | −4.5 | ||
| Labour | 132 | 27.3 | +4.4 | ||
| Conservative | 105 | 21.7 | −6.1 | ||
| Green | 28 | 5.8 | +5.8 | ||
| Majority | 86 | 17.8 | |||
| Turnout | 483 | 36.0 | |||
| Liberal Democrats hold | Swing | ||||
| Party | Candidate | Votes | % | ±% | |
|---|---|---|---|---|---|
| Liberal Democrats | 497 | 53.2 | +6.7 | ||
| Conservative | 324 | 34.7 | −3.4 | ||
| Labour | 72 | 7.7 | −7.8 | ||
| Green | 42 | 4.5 | +4.5 | ||
| Majority | 173 | 18.5 | |||
| Turnout | 935 | 22.9 | |||
| Liberal Democrats hold | Swing | ||||
| Party | Candidate | Votes | % | ±% | |
|---|---|---|---|---|---|
| Liberal Democrats | 254 | 51.9 | +0.1 | ||
| Conservative | 150 | 30.7 | −11.7 | ||
| Labour | 65 | 13.3 | +7.6 | ||
| Green | 20 | 4.1 | +4.1 | ||
| Majority | 104 | 21.2 | |||
| Turnout | 489 | 47.3 | |||
| Liberal Democrats hold | Swing | ||||
| Party | Candidate | Votes | % | ±% | |
|---|---|---|---|---|---|
| Liberal Democrats | 660 | 38.0 | −11.7 | ||
| Conservative | 606 | 34.9 | +3.2 | ||
| Labour | 326 | 18.8 | +5.6 | ||
| Green | 145 | 8.3 | +2.9 | ||
| Majority | 54 | 3.1 | |||
| Turnout | 1,737 | ||||
| Liberal Democrats hold | Swing | ||||
| Party | Candidate | Votes | % | ±% | |
|---|---|---|---|---|---|
| Conservative | Andrew Garnett | 1,387 | 58.2 | −4.0 | |
| Liberal Democrats | Brenda Barker | 998 | 41.8 | +4.0 | |
| Majority | 389 | 16.4 | |||
| Turnout | 2,385 | 46.6 | |||
| Conservative hold | Swing | ||||
| Party | Candidate | Votes | % | ±% | |
|---|---|---|---|---|---|
| Conservative | Robert Swayne | 494 | 74.2 | +9.8 | |
| Liberal Democrats | Michelle Gausman | 149 | 22.4 | −13.2 | |
| Labour | Sandra Moorcroft | 23 | 3.5 | +3.5 | |
| Majority | 345 | 51.8 | |||
| Turnout | 666 | 36.4 | |||
| Conservative hold | Swing | ||||
| Party | Candidate | Votes | % | ±% | |
|---|---|---|---|---|---|
| Conservative | Michael Stannard | 927 | 68.1 | +0.6 | |
| Liberal Democrats | Paul Meakin | 434 | 31.9 | −0.6 | |
| Majority | 493 | 36.2 | |||
| Turnout | 1,361 | 25.4 | |||
| Conservative hold | Swing | ||||
| Party | Candidate | Votes | % | ±% | |
|---|---|---|---|---|---|
| Conservative | Nigel Shepherd | 1,125 | 46.9 | −3.0 | |
| Liberal Democrats | Howard Maitland-Jones | 1,073 | 44.7 | −5.5 | |
| Labour | Peter Josep | 203 | 8.5 | +8.5 | |
| Majority | 52 | 2.2 | |||
| Turnout | 2,401 | 67.8 | |||
| Conservative hold | Swing | ||||
| Party | Candidate | Votes | % | ±% | |
|---|---|---|---|---|---|
| Conservative | Jonathan Rush | 495 | 74.0 | −1.1 | |
| Liberal Democrats | David Rafferty | 62 | 9.3 | −15.6 | |
| Labour | Stephen Agar | 60 | 9.0 | +9.0 | |
| UKIP | Alan Stevens | 52 | 7.8 | +7.8 | |
| Majority | 433 | 64.7 | |||
| Turnout | 669 | ||||
| Conservative hold | Swing | ||||
| Party | Candidate | Votes | % | ±% | |
|---|---|---|---|---|---|
| Conservative | Jules Cook | 489 | 50.2 | +11.6 | |
| Liberal Democrats | Richard Williams | 354 | 36.3 | +3.3 | |
| UKIP | Richard Phoenix | 67 | 6.9 | −7.4 | |
| Labour | Robin Walters | 64 | 6.6 | −7.5 | |
| Majority | 135 | 13.9 | |||
| Turnout | 974 | ||||
| Conservative gain from Liberal Democrats | Swing | ||||
| Party | Candidate | Votes | % | ±% | |
|---|---|---|---|---|---|
| Conservative | Vanessa Martin | 416 | 53.3 | +13.8 | |
| Liberal Democrats | Ruth Yeoman | 175 | 22.4 | +22.4 | |
| Green | Anna Brazil | 163 | 20.9 | +20.9 | |
| UKIP | Alan Stevens | 26 | 3.3 | +3.3 | |
| Majority | 241 | 30.9 | |||
| Turnout | 780 | ||||
| Conservative gain from Independent | Swing | ||||
| Party | Candidate | Votes | % | ±% | |
|---|---|---|---|---|---|
| Conservative | Jonathan Walters | 697 | 80.6 | N/A | |
| Liberal Democrats | Neil Williams | 168 | 19.4 | N/A | |
| Majority | |||||
| Turnout | |||||
| Conservative hold | Swing | ||||
The Conservative candidate was previously elected unopposed.
| Party | Candidate | Votes | % | ±% | |
|---|---|---|---|---|---|
| Conservative | Nick Southworth | 268 | 38.2 | +16.7 | |
| Labour | Mohammad Zafir Bhatti | 230 | 32.8 | +32.8 | |
| Liberal Democrats | Frances Kneller | 203 | 29.0 | +11.7 | |
| Majority | 38 | 5.4 | |||
| Turnout | 701 | ||||
| Conservative gain from Independent | Swing | ||||

Aylesbury is a constituency in the House of Commons of the UK Parliament, currently represented by Laura Kyrke-Smith, a member of the Labour Party.
Wycombe is a constituency in Buckinghamshire represented in the House of Commons of the UK Parliament since 2024 by Labour's Emma Reynolds.
Beaconsfield is a constituency in Buckinghamshire represented in the House of Commons of the UK Parliament since 2019 by Joy Morrissey of the Conservative Party. She succeeded Independent and former Conservative Dominic Grieve, whom she defeated following his suspension from the party. The constituency was established for the February 1974 general election.

Chesham and Amersham is a parliamentary constituency in Buckinghamshire, South East England, represented in the House of Commons by Sarah Green, a Liberal Democrat elected at a 2021 by-election.
Dacorum Borough Council in Hertfordshire, England is elected every four years. Since the last boundary changes in 2007, 51 councillors have been elected from 25 wards.
Wycombe District Council in Buckinghamshire, England was elected every four years from 1973 until 2020. From the last boundary changes in 2003 until its abolition in 2020, 60 councillors were elected from 28 wards.
Telford and Wrekin Council elections are held every four years. Telford and Wrekin Council is the local authority for the unitary authority of Telford and Wrekin in the ceremonial county of Shropshire, England. Until 1 April 1998 it was a non-metropolitan district. Since the last boundary changes in 2023, 54 councillors have been elected from 32 wards.
Cotswold District Council in Gloucestershire, England, is elected every four years.
Aylesbury Vale District Council was the council for the non-metropolitan district of Aylesbury Vale in Buckinghamshire, England, which existed as a local government area from 1974 to 2020. The council was elected every four years from 1973 until 2020. At the time of its abolition, the council had 59 councillors, elected from 33 wards.
One third of Basingstoke and Deane Borough Council in Hampshire, England is elected each year, followed by one year without election. Since the last boundary changes in 2021, 54 councillors have been elected from 18 wards.
St Edmundsbury Borough Council in Suffolk, England, was elected every four years. After the last boundary changes in 2003, 45 councillors were elected from 31 wards. The council was abolished in 2019, with the area becoming part of West Suffolk.
South Oxfordshire District Council, a non-metropolitan district council in Oxfordshire, England is elected every four years.
Windsor and Maidenhead Borough Council is the local authority for the Royal Borough of Windsor and Maidenhead, which is a unitary authority in Berkshire, England. Until 1 April 1998 it was a non-metropolitan district. Elections are held every four years. Since the last boundary changes in 2019 there have been 41 councillors elected from 19 wards.
West Berkshire Council is the local authority for West Berkshire, a unitary authority in Berkshire, England. Until 1 April 1998 it was a non-metropolitan district called Newbury.
One-third of Runnymede Borough Council in Surrey, England, is elected each year, followed by one year where there is an election to Surrey County Council instead. The council is divided up into 14 wards, electing 41 councillors, since the last boundary changes in 2019.
Three Rivers District Council elections are held three years out of four to elect members of Three Rivers District Council in Hertfordshire, England. Since the last boundary changes in 2014 the council has comprised 39 councillors representing 13 wards, each of which elects three councillors, one at each election such that a third of the council is elected each time. Elections to Hertfordshire County Council are held in the fourth year of the cycle when there are no district council elections.
South Northamptonshire District Council in Northamptonshire, England was elected every four years. After the last boundary changes in 2007, 42 councillors were elected from 27 wards. The council was abolished in 2021, with the area becoming part of West Northamptonshire.
Milton Keynes City Council is the local authority and unitary authority for the City of Milton Keynes, a borough in Buckinghamshire, England.
South Bucks District Council was elected every four years from 1973 until 2020.
South Bedfordshire was a non-metropolitan district in Bedfordshire, England. It was abolished on 1 April 2009 and replaced by Central Bedfordshire.
Chiltern (former district) | ||
|---|---|---|
| Towns (component areas and hamlets) |  | |
| Other civil parishes (component villages and hamlets) | ||
| Former districts and boroughs | ||
| Former constituencies | ||