2017 Buckinghamshire County Council election

Last updated

2017 Buckinghamshire County Council election
FlagOfBuckinghamshire.PNG
  2013 4 May 2017 2021  

All 49 seats to Buckinghamshire County Council
25 seats needed for a majority
 First partySecond party
 
Party Conservative Liberal Democrats
Seats before365
Seats won414
Seat changeIncrease2.svg5Decrease2.svg1
Popular vote72,07025,276
Percentage53.13%18.63%

 Third partyFourth party
 
Party Independent Labour
Seats before11
Seats won31
Seat changeIncrease2.svg2Steady2.svg
Popular vote6,85218,469
Percentage5.05%13.61%

Buckinghamshire UK local election 2017 map.svg
Map showing the results of the 2017 Buckinghamshire County Council elections.

Council control before election

Conservative

Council control after election

Conservative

The 2017 Buckinghamshire County Council election took place on 4 May 2017 as part of the 2017 local elections in the United Kingdom. [1] All 49 councillors were elected from electoral divisions which returned one county councillor each by first-past-the-post voting for a four-year term of office, due to expire in 2021.

Contents

The Conservative Party retained an overall control on the council, winning 41 of the 49 seats on the council. Of the remaining 9 councillors, there were four Liberal Democrats, three Independents and one Labour. UKIP lost all six of their seats.

Due to the replacement of Buckinghamshire County Council by Buckinghamshire Council in 2020, the successor election to this election is the 2021 Buckinghamshire Council election.

Result

2017 Buckinghamshire County Council Election Result [2]
PartySeatsGainsLossesNet gain/lossSeats %Votes %Votes+/−
  Conservative 4161+583.6853.1372,070+12.08%
  Liberal Democrats 423-18.1618.6325,276+3.72%
 East Wycombe Independents220+24.081.532,079+1.53%
  Labour 11102.0413.6118,469+2.16%
  Independent 10002.043.524,773+1.48%
  UKIP 006-60.006.058,204-20.94%
  Green 00000.003.534,794+1.82%

The overall turnout was 34.8% with a total of 135,665 valid votes cast.

Council Composition

Following the last election in 2013 the composition of the council was:

366511
ConservativesUKIPLib DemsLI

After the election, the composition of the council was:

414211
ConservativesLib DemsEWILI

Lib Dems - Liberal Democrats
L - Labour Party
I - Independent
EWI - East Wycombe Independents

Ward results

Asterisks denote incumbent Councillors seeking re-election. Councillors seeking re-election were elected in 2013, and results are compared to that year's polls on that basis. All results are listed below: [3]

Abbey

Abbey
PartyCandidateVotes%±%
Conservative Lesley Mary Clarke* 1,224 50.6 +3.3
Labour Mohammed Rafiq80133.1+9.2
Liberal Democrats Tamsin Nicola Holkham1988.2+1.9
UKIP Bob Harris1104.5-18.1
Green Neil James Denham873.6
Majority42317.5-5.9
Turnout 2,42032.6+8.5
Conservative hold Swing

Amersham & Chesham Bois

Amersham & Chesham Bois
PartyCandidateVotes%±%
Conservative Gareth David Williams 1,763 58.9 +7.4
Liberal Democrats Walid Marzouk84428.2+11.3
Labour Alexander Damien Rhys2598.6-1.0
UKIP Freda Margaret Stevens1294.3-17.7
Majority91930.7+1.2
Turnout 2,99539.3+8.5
Conservative hold Swing

Aston Clinton & Bierton

Aston Clinton & Bierton
PartyCandidateVotes%±%
Conservative Bill Chapple* 1,765 59.7 +20.5
Liberal Democrats Mark Frederick Willis37012.5-3.5
UKIP Geoff Baile32811.1-25.3
Labour Mike Butcher30710.4+2.0
Green Coral Simpson1886.4
Majority1,39547.2+44.5
Turnout 2,95838.9+3.7
Conservative hold Swing

Aylesbury East

Aylesbury East
PartyCandidateVotes%±%
Conservative Julie Elizabeth Ward 1,374 43.7 +13.5
Liberal Democrats Allison Jayne Harrison86227.4+6.8
UKIP Phil Gomm*43213.7-21.9
Labour Damien Marie Bishop35511.3-1.3
Green Andy Capjon1223.9
Majority51216.3+10.9
Turnout 3,14538.6+2.9
Conservative gain from UKIP Swing

Aylesbury North

Aylesbury North
PartyCandidateVotes%±%
Liberal Democrats Raj Wali Khan* 1,066 40.6 +7.0
Conservative Ammer Raheel57722.0+1.8
Labour Gary Paxton49218.7-2.2
UKIP Paul Hobbs31412.0-13.3
Green Colin Norman Bloxham1766.7
Majority48918.6+10.2
Turnout 2,62531.0+3.4
Liberal Democrats hold Swing

Aylesbury North West

Aylesbury North West
PartyCandidateVotes%±%
Liberal Democrats Martin Paul Farrow 658 29.8 +3.9
Conservative Graham Moore54224.5+10.1
Labour John Anthony Cowell50122.7+7.8
UKIP Andy Huxley*43619.7-25.1
Green Huseyin Caglayan723.3
Majority1165.3-13.6
Turnout 2,20925.3+0.7
Liberal Democrats gain from UKIP Swing

Aylesbury South East

Aylesbury South East
PartyCandidateVotes%±%
Conservative Brian Keith Roberts* 1,468 53.5 +13.6
Liberal Democrats Richard Gordon Lloyd49918.2+3.6
Labour Ansar Gulzar39414.4+1.3
UKIP Heather Adams2489.0-19.0
Green Nigel Antony Foster1354.9
Majority96935.3+23.4
Turnout 2,74432.0+3.3
Conservative hold Swing

Aylesbury South West

Aylesbury South West
PartyCandidateVotes%±%
Liberal Democrats Niknam Hussain 851 34.7 +2.1
Labour Mark Trevor Bateman68928.1+9.0
Conservative Sophie Elizabeth Vaughan-Evans52621.5+10.3
UKIP Brian Adams*33013.5-21.6
Green Mark Wheeler552.2
Majority1626.6+4.1
Turnout 2,45131.9+4.7
Liberal Democrats gain from UKIP Swing

Aylesbury West

Aylesbury West
PartyCandidateVotes%±%
Liberal Democrats Steven Michael Lambert 1,362 55.8 +14.2
Conservative Peter William Ward52221.4+6.4
Labour Carmel Traynor32213.2+1.5
UKIP Debbie Huntley2379.7-22.0
Majority84034.4+24.5
Turnout 2,44331.4+4.1
Liberal Democrats hold Swing

Beaconsfield

Beaconsfield
PartyCandidateVotes%±%
Conservative Alan Martin Walters 1,828 70.1 +9.5
Liberal Democrats Peter Jeffrey Chapman42416.3+3.0
Labour Nigel Paul Vickery1796.9
UKIP Tim Scott1756.7-19.5
Majority1,40453.8+19.4
Turnout 2,60631.7+4.1
Conservative hold Swing

Bernwood

Bernwood
PartyCandidateVotes%±%
Conservative Clive Harriss 1,482 47.4 +3.4
Green David Richard Lyons96530.9+18.1
Labour Alison Duncan Watt49715.9+0.2
UKIP Colin Evered1845.9-15.8
Majority51716.5-5.8
Turnout 3,12839.9+4.8
Conservative hold Swing

Booker, Cressex & Castlefield

Booker, Cressex & Castlefield
PartyCandidateVotes%±%
Labour Majid Hussain 1,608 44.9 +16.6
Conservative Zahir Mohammed*1,59744.6-0.5
Liberal Democrats Jenese Jacquelyn Joseph2065.8-1.6
UKIP Maria Delores Busby1694.7-8.1
Majority110.3-18.5
Turnout 3,58041.6+4.3
Labour gain from Conservative Swing

Buckingham East

Buckingham East
PartyCandidateVotes%±%
Conservative Warren Whyte* 1,326 55.9 +11.7
Labour Jon Simon Harvey50621.3-2.4
Liberal Democrats Anja Schaefer2018.5+3.9
Green Nicola Smith1205.1
UKIP Nick Shipp1195.0-22.5
Independent Leah Yeoman994.2
Majority82024.6+7.8
Turnout 2,37133.2+8.8
Conservative hold Swing

Buckingham West

Buckingham West
PartyCandidateVotes%±%
Conservative Charlie Clare 1,593 50.0 +11.8
Labour Robin Stuchbury*1,36642.9+2.9
Liberal Democrats David George Evershed1243.9-1.2
Green Elliot John Settle1033.2
Majority2277.1+5.2
Turnout 3,18639.4+7.4
Conservative gain from Labour Swing

Chalfont St Giles

Chalfont St Giles
PartyCandidateVotes%±%
Conservative Timothy Richard Butcher 1,778 60.9 +15.3
Liberal Democrats Sally Elizabeth Ash62321.3+13.2
UKIP David George Meacock2307.9-29.7
Labour Tim Starkey1695.8-3.0
Green Philip John Wall1214.1
Majority1,15539.6+31.6
Turnout 2,92134.9+5.2
Conservative hold Swing

Chalfont St Peter

Chalfont St Peter
PartyCandidateVotes%±%
Conservative David John Francis Martin 2,009 70.5 +15.1
Liberal Democrats Daniel Paul Gallagher55519.5+13.4
Labour Julian Darley1495.2-1.3
UKIP Andrew John Glen1384.8-27.2
Majority1,45451.0+27.6
Turnout 2,85134.6+1.7
Conservative hold Swing

Chesham

Chesham
PartyCandidateVotes%±%
Conservative Mark Wayne Shaw* 1,704 56.4 +19.7
Labour Graham Simon Gardner66822.1-5.1
Liberal Democrats Frances Catherine Van Ijzendoorn52617.4+5.8
UKIP Richard George Ness1214.0-15.0
Majority1,03634.3+24.8
Turnout 3,01940.9+4.3
Conservative hold Swing

Chess Valley

Chess Valley
PartyCandidateVotes%±%
Conservative Noel Lawrence Brown* 1,557 52.3 +4.8
Liberal Democrats Davina Joy Kirby68222.9+7.5
Labour North Pyper38813.0+2.7
Green Gillian Walker2217.4-0.2
UKIP Timothy James Matthews1304.4-14.7
Majority87529.4+1.0
Turnout 2,97839.0+7.5
Conservative hold Swing

Chiltern Ridges

Chiltern Ridges
PartyCandidateVotes%±%
Conservative Patricia Mary Birchley* 1,815 49.8 +13.0
Liberal Democrats Mohammad Fayyaz1,23233.8+17.0
Labour Barbara Ann Hunter2446.7+2.0
Green Alan John Gray Booth1754.8-2.7
UKIP Richard Neal Phoenix1754.8-29.4
Majority58316.0+13.4
Turnout 3,64144.4+4.1
Conservative hold Swing

Chiltern Villages

Chiltern Villages
PartyCandidateVotes%±%
Conservative Jean Elizabeth Teesdale* 2,318 74.9 +17.3
Green Peter James Sims47615.4
Labour Jacqui Jacques2999.7+0.1
Majority1,84259.5+25.8
Turnout 3,09335.9+7.7
Conservative hold Swing

Cliveden

Cliveden
PartyCandidateVotes%±%
Conservative Dev Dhillon* 1,215 53.8 +13.1
Liberal Democrats Jane Wallis32514.4+6.6
Labour Alexa Anne Collins30913.7+0.7
Independent Edwina Jane Glover24911.0
UKIP Graham Geoffrey Smith1607.1-31.4
Majority89039.4+37.2
Turnout 2,25830.0+2.7
Conservative hold Swing

Denham

Denham
PartyCandidateVotes%±%
Conservative Roger William Reed* 1,208 58.2 +4.8
Liberal Democrats Andy Milburn29214.1+4.7
UKIP John Shearme26712.9-24.3
Labour Charlotte Louise Hall1567.5
Green Robert Michael Smith1517.3
Majority91644.1+27.9
Turnout 2,07428.2+3.4
Conservative hold Swing

Downley

Downley
PartyCandidateVotes%±%
Conservative Wendy Janet Mallen 1,314 50.7 +7.9
Labour Mohammed Hanif75729.2-1.3
Liberal Democrats Ray Farmer40915.8+6.3
UKIP John Gregory McCollough1124.3-13.0
Majority55721.5+9.2
Turnout 2,59232.2+0.5
Conservative hold Swing

Farnham Common & Burnham Beeches

Farnham Common & Burnham Beeches
PartyCandidateVotes%±%
Conservative Lin Hazell* 1,476 66.2 +7.0
Liberal Democrats Carol Lesley Linton46320.8+8.7
Labour Janet Violet Sjogren1496.7
UKIP Susan Ann Fagan1406.3-22.4
Majority1,01345.4+14.9
Turnout 2,22830.9+4.0
Conservative hold Swing

Flackwell Heath, Little Marlow & Marlow South East

Flackwell Heath, Little Marlow & Marlow South East
PartyCandidateVotes%±%
Conservative David Martyn Watson* 1,765 67.2 +16.8
Liberal Democrats Paul Michael Anthony Burden40915.6+6.9
Labour Helen Elizabeth Ingram27210.4+1.8
UKIP John Albert Gooding1806.9-15.5
Majority1,35651.6+23.6
Turnout 2,62631.3+5.8
Conservative hold Swing

Gerrards Cross

Gerrards Cross
PartyCandidateVotes%±%
Conservative Barbara Lynn Gibbs 1,221 57.3 +10.1
Independent Christopher Stuart Brown58427.4+4.0
Liberal Democrats Diane Margaret Holden2019.4+4.2
Labour Michael Anthony Kavanagh1265.9
Majority63729.9+14.1
Turnout 2,13231.5+3.8
Conservative hold Swing

Great Brickhill

Great Brickhill
PartyCandidateVotes%±%
Conservative Janet Blake* 1,949 62.5 +12.1
Liberal Democrats Dave Frearson46915.0+3.2
Labour Maxine Myatt2999.6
UKIP Amy Howitt2187.0-30.7
Green Deborah Lovatt1825.8
Majority1,48047.5+34.8
Turnout 3,11735.2+2.4
Conservative hold Swing

Great Missenden

Great Missenden
PartyCandidateVotes%±%
Conservative Peter Ernest Charles Martin 1,974 62.8 +25.1
Liberal Democrats Ruth Juett51216.3+12.2
Green Jennifer Sarah Brazil2758.7
Labour Benjamin Thomas Davies2317.3+1.2
UKIP Alan Peter Stevens*1514.8-35.9
Majority1,46246.5+43.5
Turnout 3,14340.1+2.8
Conservative gain from UKIP Swing

Grendon Underwood

Grendon Underwood
PartyCandidateVotes%±%
Conservative Angela MacPherson* 1,909 65.4 +23.5
Liberal Democrats Jules Newman40213.8+5.0
Labour Jennifer Ann Tuffley2478.5-1.5
Green Clare Elisabeth Butler1916.5-0.8
UKIP Jason Wise1705.8-27.3
Majority1,50751.6+42.8
Turnout 2,91934.8+3.8
Conservative hold Swing

Hazlemere

Hazlemere
PartyCandidateVotes%±%
Conservative Katrina Suzanne Atkins Wood* 1,632 68.0 +22.0
Liberal Democrats Ian Forbes32413.5+5.4
Labour Rosie Paola Greco25410.6+1.6
UKIP Philip John Whitehead1907.9-29.0
Majority1,30854.5+45.4
Turnout 2,40032.6+3.7
Conservative hold Swing

Iver

Iver
PartyCandidateVotes%±%
Conservative Luisa Katherine Sullivan 1,357 62.0 +16.9
Green Leigh Martin Tugwood35316.1
Labour Richard James Griggs24611.2
UKIP Paul Dreelan1265.8-18.4
Liberal Democrats Jeff Herschel1084.9-25.8
Majority1,00445.9+11.5
Turnout 2,19026.8+0.3
Conservative hold Swing

Ivinghoe

Ivinghoe
PartyCandidateVotes%±%
Conservative Anne Wight 1,548 48.1 +13.1
Liberal Democrats Avril Cutland Davies*1,31440.8+2.7
Green Johanna Wheeler2016.2
Labour Nina Dluzewska1554.8-2.3
Majority2347.3+4.2
Turnout 3,21839.5+6.2
Conservative gain from Liberal Democrats Swing

Little Chalfont & Amersham Common

Little Chalfont & Amersham Common
PartyCandidateVotes%±%
Conservative Martin Anthony Tett* 1,762 60.4 +7.2
Liberal Democrats Sue Jordan67523.1+10.0
Labour Susan Procter30210.4+1.4
UKIP Christopher Worley Radcliffe Cooke1776.1-18.5
Majority1,09737.3+8.7
Turnout 2,91638.5+9.3
Conservative hold Swing

Marlow

Marlow
PartyCandidateVotes%±%
Conservative Alex Collingwood 2,107 63.7 +6.2
Liberal Democrats Mark Andrew Skoyles83225.2+12.6
Labour George William Alderman2236.7-2.5
UKIP Paddy Gallaugher1464.4-16.2
Majority1,27538.51.6
Turnout 3,30840.1+8.8
Conservative hold Swing

Penn Wood & Old Amersham

Penn Wood & Old Amersham
PartyCandidateVotes%±%
Conservative Isobel Anne Darby 2,247 69.7 +14.8
Liberal Democrats Richard Neil Williams57017.7+7.1
Labour Ruth Werbiski Dutton2297.1-0.7
UKIP Liam David Noble1785.5-21.2
Majority1,67752.0+19.6
Turnout 3,22438.6+6.2
Conservative hold Swing

Ridgeway East

Ridgeway East
PartyCandidateVotes%±%
Conservative David James Carroll* 2,238 68.8 +19.6
Liberal Democrats Graeme Peter Card56217.3+11.5
Labour Linda Mary Ruth Derrick3139.6+2.8
UKIP Vijay Singh Srao1404.3-33.9
Majority1,67651.5+41.5
Turnout 3,25338.7+6.5
Conservative hold Swing

Ridgeway West

Ridgeway West
PartyCandidateVotes%±%
Conservative Carl Alexander Arvid Etholen* 1,913 69.5 +14.2
Liberal Democrats Candy Piercy49618.0+12.9
Labour Shaharyan Khan1816.6+0.2
UKIP Jonathan Mark Evered1646.0-18.2
Majority1,41751.5+20.4
Turnout 2,75435.2+4.1
Conservative hold Swing

Ryemead & Micklefield

Ryemead & Micklefield
PartyCandidateVotes%±%
East Wycombe IndependentJulia Denise Wassell* 1,149 43.0
Liberal Democrats Trevor Snaith89433.4-20.8
Conservative Neil Stephen Mockley36513.6-2.1
Labour Naveed Javed Akhtar2077.7-7.1
Independent Scott Gavin Ridley602.2
Majority2559.628.9
Turnout 2,67535.0+11.9
[[East Wycombe Independent|Independent]] gain from Liberal Democrats Swing

Julie Wassell was previously elected as a Liberal Democrat councillor for this ward at the last election.

Stoke Poges & Wexham

Stoke Poges & Wexham
PartyCandidateVotes%±%
Conservative Ralph Bagge 1,512 68.4 +15.1
UKIP Karen Perez27812.6-18.0
Labour Rory Andrew Nosworthy2169.8+0.2
Liberal Democrats Christopher Francis Woolley2059.3+2.8
Majority1,23455.8+33.1
Turnout 2,21128.2+3.6
Conservative hold Swing

Stone and Waddesdon

Stone and Waddesdon
PartyCandidateVotes%±%
Conservative Paul Irwin* 1,625 61.9 +36.2
Liberal Democrats Rebecca Halifax Beswick38814.8-11.3
Labour Mike Padmore26610.1
UKIP Gary Good1947.4-20.0
Green Greg Smith1535.8
Majority1,23747.1+45.7
Turnout 2,62630.8-5.6
Conservative gain from UKIP Swing

Terriers & Amersham Hill

Terriers & Amersham Hill
PartyCandidateVotes%±%
Conservative Arif Hussain 1,157 49.5 -2.2
Liberal Democrats Steve Guy53322.8+10.7
Labour Adam James Coulthard51121.9+3.0
UKIP Linda Rosemary Ann Harris1355.8-11.6
Majority62426.7-6.1
Turnout 2,33630.9+5.8
Conservative hold Swing

The Risboroughs

The Risboroughs
PartyCandidateVotes%±%
Conservative Bill Bendyshe-Brown* 1,569 55.0 +18.1
Independent Andy Ball88631.1
Liberal Democrats Ian Patrick Metherell2498.7+6.1
Labour Brian Huw Gammage1485.2-0.6
Majority68323.9+18.2
Turnout 2,85238.1+5.6
Conservative hold Swing

The Wooburns, Bourne End & Hedsor

The Wooburns, Bourne End & Hedsor
PartyCandidateVotes%±%
Conservative Mike Appleyard* 1,265 47.6 +1.6
Independent Geoff Howard60622.8
Liberal Democrats Mark Jolliffe40915.4-6.1
Labour Wendy Byrne28710.8-1.0
UKIP John Willoughby Feltrim Fagan933.5-19.2
Majority65924.8+1.5
Turnout 2,66032.3+5.9
Conservative hold Swing

Totteridge & Bowerdean

Totteridge & Bowerdean
PartyCandidateVotes%±%
East Wycombe IndependentChaudhary Allah Ditta* 930 39.9 +1.2
Labour Sebert Headley Graham58825.3-2.0
Conservative Alexander James Shayler46620.0+0.4
Liberal Democrats Ben James Holkham34414.8+0.4
Majority34214.6+3.2
Turnout 2,32829.8-2.3
[[East Wycombe Independent|Independent]] gain from Liberal Democrats Swing

Tylers Green & Loudwater

Tylers Green & Loudwater
PartyCandidateVotes%±%
Conservative David Alastair Clifton Shakespeare* 1,438 60.9 +17.4
Liberal Democrats Paula Louise Lee53922.8+4.1
Labour Fariha Khan2078.8-0.8
UKIP Brian James Mapletoft1797.6-20.6
Majority89938.1+22.8
Turnout 2,36328.7+3.0
Conservative hold Swing

Wendover, Halton & Stoke Mandeville

Wendover, Halton & Stoke Mandeville
PartyCandidateVotes%±%
Conservative Steve Bowles 1,687 55.5 +31.4
Liberal Democrats Anders Carl Christensen39713.1+9.9
Labour Martin Ian Abel37212.2+6.3
UKIP Chris Adams32610.7-25.6
Green Tom Peter Hodge2568.4+3.5
Majority1,29041.4+30.8
Turnout 3,03837.4+0.8
Conservative gain from UKIP Swing

West Wycombe

West Wycombe
PartyCandidateVotes%±%
Independent Darren John Hayday* 1,409 51.1 +20.8
Conservative Tony Green62822.8-1.9
Labour Ghulam Rabani55520.1+4.1
Liberal Democrats Neil Timberlake1635.9-2.7
Majority1,18128.3+22.7
Turnout 2,75537.4+9.2
Independent hold Swing

Wing

Wing
PartyCandidateVotes%±%
Conservative Netta Glover* 1,366 43.8 +9.4
Independent Peter Aiden Cooper88028.2-1.6
Labour David Christopher Hancock2869.2+2.1
Liberal Democrats Sheila De Rosa2568.2+0.1
UKIP Roger Huntley2096.7-13.9
Green Kumar Bala1193.8
Majority48615.6+11.0
Turnout 3,11635.0+3.5
Conservative hold Swing

Winslow

Winslow
PartyCandidateVotes%±%
Conservative John Chilver* 1,389 46.4 +9.3
Liberal Democrats Llew Monger1,25642.0+9.3
Labour Philip Christian Jacques1846.1-0.1
UKIP Niki Adams1635.4-12.5
Majority1334.40.0
Turnout 2,99239.95.3
Conservative hold Swing

Related Research Articles

Elections to Slough Borough Council were held on 4 May 2006. One third of the council was up for election. This was the 121st Slough general local authority election since Slough became a local government unit in 1863.

Elections to the Borough Council in Slough, England, were held on 3 May 2007. One third of the council was up for election. This was the 122nd Slough general local authority election since Slough became a local government unit in 1863.

Elections to the Borough Council in Slough, England, were held on 1 May 2008. This was the 123rd Slough general local authority election since Slough became a local government unit in 1863.

<span class="mw-page-title-main">2007 St Albans City and District Council election</span>

The 2007 St Albans City and District Council election took place on 3 May 2007 to elect members of St Albans District Council in Hertfordshire, England. One third of the council was up for election and the Liberal Democrats lost overall control of the council to no overall control.

An election for the Borough Council in Slough, England, was held on 6 May 2010. This was the 124th Slough general local authority election since Slough became a local government unit in 1863.

<span class="mw-page-title-main">2012 Ceredigion County Council election</span>

An election to Ceredigion County Council was held on 3 May 2012 along with elections to 20 of the other 21 local authorities in Wales, community council elections in Wales and other elections elsewhere in the United Kingdom. It was followed by the 2017 election.

<span class="mw-page-title-main">2013 Buckinghamshire County Council election</span>

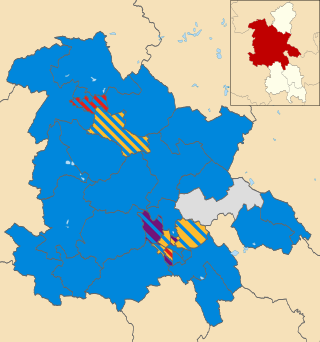
An election to Buckinghamshire County Council took place on 2 May 2013 as part of the 2013 United Kingdom local elections. 49 councillors were elected from electoral divisions which returned one county councillor each by first-past-the-post voting for a four-year term of office. Following a boundary review, the size of the council was reduced from 57 to 49 members for this election. No elections were held in Milton Keynes, which is a unitary authority outside the area covered by the County Council. The council continues to be administered on the Leader and Cabinet model. The Conservative Party won a reduced majority on the council.

<span class="mw-page-title-main">2013 Suffolk County Council election</span>

Elections to Suffolk County Council took place on 2 May 2013 as part of the 2013 United Kingdom local elections. 75 councillors were elected from 63 electoral divisions, which returned either one or two county councillors each by first-past-the-post voting for a four-year term of office. The electoral divisions were the same as those used at the previous election in 2009.

<span class="mw-page-title-main">2015 Blackpool Borough Council election</span> Local election in Blackpool, England

The 2015 Blackpool Borough Council election took place on 7 May 2015 to elect members of Blackpool Borough Council in England. All 21 wards of 2 seats each on the council were contested with newly elected members next due to serve a four-year term and next contest their seats in 2019. This election took place on the same day as other local elections as well as the 2015 UK General Election.

<span class="mw-page-title-main">2008 West Oxfordshire District Council election</span>

The 2008 West Oxfordshire District Council election took place on 1 May 2008 to elect members of West Oxfordshire District Council in Oxfordshire, England. One third of the council was up for election and the Conservative Party stayed in overall control of the council.

<span class="mw-page-title-main">2017 Welsh local elections</span>

The 2017 Welsh local elections were held on 4 May 2017 to elect members of all 22 local authorities in Wales. This included the Isle of Anglesey, which was previously up for election in 2013 due to having its elections delayed for a year. Community council elections also took place on the same day. These local elections were held as part of the 2017 local elections in the United Kingdom. Apart from Anglesey, the last elections were held in 2012. Normally these elections take place every four years, but the 2017 elections were postponed for a year in order to avoid clashing with the 2016 Welsh Assembly election, which itself had been postponed by a year to avoid clashing with the 2015 general election.

An election to Ceredigion County Council were held on 4 May 2017 when local elections took place across Wales. It was preceded by the 2012 election and the next election is scheduled to take place in 2022.

<span class="mw-page-title-main">2021 United Kingdom local elections</span> Elections to local councils and mayoralties

The 2021 United Kingdom local elections were held on Thursday 6 May 2021. More than 145 English local councils, around 5,000 councillor seats, thirteen directly elected mayors in England, and 39 police and crime commissioners in England and Wales were contested. On the same day, the 2021 Hartlepool by-election took place, and there were also elections to the Scottish Parliament, Senedd and London Assembly, the last in conjunction with the London mayoral election.

<span class="mw-page-title-main">2021 Cornwall Council election</span>

The 2021 Cornwall Council election took place on 6 May 2021 as part of the 2021 United Kingdom local elections. It was contested under new division boundaries as the number of seats on the council falls from 123 to 87.

<span class="mw-page-title-main">2021 Staffordshire County Council election</span> Staffordshire County Council election

Elections to Staffordshire County Council took place on 6 May 2021 on the same day as district council elections in Cannock Chase and Tamworth and other local elections in England. All of the council's divisions were up for election, meaning a total of 62 councillors were elected.

The 2022 Southwark London Borough Council election took place on 5 May 2022. All 63 members of Southwark London Borough Council were elected. The elections took place alongside local elections in the other London boroughs and elections to local authorities across the United Kingdom.

<span class="mw-page-title-main">2022 Tower Hamlets London Borough Council election</span>

The 2022 Tower Hamlets London Borough Council election took place on 5 May 2022. All 45 members of Tower Hamlets London Borough Council were elected. The elections took place alongside local elections in the other London boroughs and elections to local authorities across the United Kingdom.

<span class="mw-page-title-main">2022 Rochdale Metropolitan Borough Council election</span> 2022 local election in Rochdale

The 2022 Rochdale Metropolitan Borough Council election took place as of 5 May 2022. Due to boundary changes, all 60 councillors were elected at the same time. The election took place alongside other local elections across the United Kingdom.

<span class="mw-page-title-main">2022 Perth and Kinross Council election</span> 2022 Perthshire local elections

Elections to Perth and Kinross Council were held on 5 May 2022 as part of the 2022 Scottish local elections. 40 Councillors were elected from 12 multi-members electoral wards under the Single Transferable Vote electoral system. The Scottish Conservatives had run Perth and Kinross Council as a minority administration immediately prior to the election, with a previous coalition with the Scottish Liberal Democrats collapsing mid-way through the term. Twelve incumbent Councillors, including two group leaders, decided not to seek re-election whilst others stood again but lost their seats.

References

  1. "Upcoming elections & referendums". Electoral Commission. Archived from the original on 5 May 2018. Retrieved 15 September 2016.
  2. [ dead link ]
  3. https://democracy.buckscc.gov.uk/mgElectionElectionAreaResults.aspx?EID=13&RPID=84183105%5B%5D