The 2015 Aylesbury Vale District Council election took place on 7 May 2015 to elect members of Aylesbury Vale District Council in Buckinghamshire, England. The whole council was up for election with boundary changes since the last election in 2011. [1] The Conservative Party remained in overall control of the council. [2]
Overall turnout at the election was 68%. [3]
Party | Seats | Gains | Losses | Net gain/loss | Seats % | Votes % | Votes | +/− | |
---|---|---|---|---|---|---|---|---|---|
Conservative | 43 | +7 | 72.9 | 44.0 | 76,413 | -5.0% | |||
Liberal Democrats | 9 | -8 | 15.3 | 15.5 | 26,920 | -9.8% | |||
UKIP | 4 | +1 | 6.8 | 21.8 | 37,886 | +7.1% | |||
Labour | 2 | +1 | 3.4 | 7.2 | 12,454 | -0.1% | |||
Independent | 1 | -1 | 1.7 | 2.1 | 3,724 | -1.0% | |||
Green | 0 | 0 | 0 | 9.4 | 16,282 | +9.0% | |||
Party | Candidate | Votes | % | ±% | |
---|---|---|---|---|---|
Conservative | Michael Collins | 2,701 | |||
Conservative | William Chapple | 2,664 | |||
Conservative | Carole Paternoster | 2,591 | |||
UKIP | Philip Yerby | 1,853 | |||
UKIP | Geoffrey Baile | 1,532 | |||
UKIP | Lesley Baile | 1,429 | |||
Labour | Martin Abel | 770 | |||
Liberal Democrats | Neil Stuart | 766 | |||
Green | Huseyin Caglayan | 710 | |||
Green | Cameron Kaye | 604 | |||
Turnout | 15,620 | 76 |
Party | Candidate | Votes | % | ±% | |
---|---|---|---|---|---|
Conservative | Tom Hunter-Watts | 1,638 | |||
Conservative | Mark Winn | 1,568 | |||
UKIP | Angelicka Bignell | 746 | |||
UKIP | Daneil Lewis | 662 | |||
Liberal Democrats | Glenda Reynolds | 598 | |||
Independent | Philip Gomm | 579 | |||
Labour | Lyn Griffiths | 546 | |||
Green | Matthew Edwards | 288 | |||
Green | Alexander Attridge | 199 | |||
Turnout | 6,824 | 77 |
Party | Candidate | Votes | % | ±% | |
---|---|---|---|---|---|
Conservative | Simon Cole | 1,358 | |||
Conservative | Timothy Mills | 1,259 | |||
Labour | Ruth Newell | 803 | |||
UKIP | Nicholas Shipp | 595 | |||
Labour | Christine Strain-Clark | 590 | |||
Green | Dinah Barton | 413 | |||
Turnout | 5,018 | 60 |
Party | Candidate | Votes | % | ±% | |
---|---|---|---|---|---|
Labour | Robin Stuchbury | 1,478 | |||
Conservative | Howard Mordue | 1,307 | |||
Conservative | Florence Hunter | 962 | |||
Labour | Jon Harvey | 873 | |||
UKIP | Nicola Adams | 315 | |||
UKIP | Louise Howitt | 290 | |||
Turnout | 5,225 | 65 |
Party | Candidate | Votes | % | ±% | |
---|---|---|---|---|---|
Conservative | Barbara Russel | 1,075 | |||
Conservative | Edward Sims | 944 | |||
Liberal Democrats | Mary Baldwin | 752 | |||
Labour | Michael Padmore | 625 | |||
Liberal Democrats | Marcus Rogers | 570 | |||
UKIP | Gavin Richardson | 567 | |||
UKIP | Joshua Richardson | 481 | |||
Labour | Grzegorz Popek | 427 | |||
Green | Christian Kaye | 280 | |||
Green | Colin Bloxham | 211 | |||
Turnout | 5,932 | 66 |
Party | Candidate | Votes | % | ±% | |
---|---|---|---|---|---|
Liberal Democrats | Steven Lambert | 1,781 | |||
Liberal Democrats | Michael Smith | 1,280 | |||
Conservative | Andrew Cole | 1,260 | |||
Liberal Democrats | Stuart Jarvis | 1,226 | |||
Conservative | Zulifqar Ahmed | 1,128 | |||
Conservative | Paul Hughes | 1,068 | |||
UKIP | Deborah Huntley | 958 | |||
UKIP | Roger Huntley | 860 | |||
UKIP | Brian Wright | 751 | |||
Labour | Zard Khan | 571 | |||
Green | Jerdrzej Kulig | 305 | |||
Green | Stephen Brown | 259 | |||
Green | Alice Haylock | 221 | |||
Turnout | 11,668 | 66 |
Party | Candidate | Votes | % | ±% | |
---|---|---|---|---|---|
Conservative | Chris Poll | unopposed |
Party | Candidate | Votes | % | ±% | |
---|---|---|---|---|---|
Liberal Democrats | Raj Khan | 729 | |||
UKIP | Andrew Hetherington | 666 | |||
Liberal Democrats | Niknam Hussain | 652 | |||
Labour | David Caldwell | 632 | |||
Conservative | Ammer Raheel | 604 | |||
UKIP | Janet Reynolds | 567 | |||
Labour | Gary Paxton | 516 | |||
Conservative | Kevin Rogers | 496 | |||
Green | Suzannah McCarthy | 220 | |||
Green | Zachary-Rhys Nuttall | 131 | |||
Turnout | 5,213 | 59 |
Party | Candidate | Votes | % | ±% | |
---|---|---|---|---|---|
Liberal Democrats | Anders Christensen | 1,047 | |||
Liberal Democrats | Tuffail Hussain | 993 | |||
Conservative | Paul Moore | 959 | |||
UKIP | Philip Hayes | 932 | |||
Conservative | Elizabeth Lumley | 882 | |||
Liberal Democrats | Samantha Pullen | 879 | |||
UKIP | Dorren Merridan | 792 | |||
Conservative | Mark Roberts | 784 | |||
Labour | Lucio Tangi | 774 | |||
UKIP | Frederick Merridan | 770 | |||
Green | Deborah King | 345 | |||
Green | Matthias Fiest | 273 | |||
Turnout | 9,430 | 56 |
Party | Candidate | Votes | % | ±% | |
---|---|---|---|---|---|
Conservative | Neil Blake | 2,099 | |||
Conservative | Benjamin Everitt | 1,986 | |||
UKIP | Deborah Howard | 727 | |||
Green | Timothy Welch | 683 | |||
Turnout | 5,495 | 73 |
Party | Candidate | Votes | % | ±% | |
---|---|---|---|---|---|
Conservative | Beville Stanier | 1,323 | 71.4 | ||
Green | Alexandra Stubbings | 529 | 28.6 | ||
Majority | 794 | 42.8 | |||
Turnout | 1,852 | 73 |
Party | Candidate | Votes | % | ±% | |
---|---|---|---|---|---|
Conservative | John Cartwright | 1,068 | 54.7 | ||
UKIP | James McBeth | 427 | 21.9 | ||
Green | Nicholas Jones | 246 | 12.6 | ||
Liberal Democrats | Gareth Davies | 213 | 10.9 | ||
Majority | 641 | 32.8 | |||
Turnout | 1,954 | 73 |
Party | Candidate | Votes | % | ±% | |
---|---|---|---|---|---|
Conservative | Judith Brandis | 2,677 | |||
Conservative | Brian Foster | 2,075 | |||
Conservative | Michael Edmonds | 1,681 | |||
Green | David Lyons | 1,063 | |||
Independent | Mark Bale | 1,037 | |||
UKIP | Thomas Newton | 1,031 | |||
UKIP | Jonathan Evred | 931 | |||
Independent | Kenneth Brown | 848 | |||
Liberal Democrats | Elizabeth Melling | 771 | |||
Green | Gregory Smith | 673 | |||
UKIP | Kevin Wise | 600 | |||
Green | Jonathan Green | 575 | |||
Turnout | 13,962 | 72 |
Party | Candidate | Votes | % | ±% | |
---|---|---|---|---|---|
Conservative | Mike Hawkett | 1,083 | 58.7 | ||
Green | Michael Le Brun | 265 | 14.4 | ||
UKIP | Colin Evered | 257 | 13.9 | ||
Labour | Margaret Liggett | 240 | 13.0 | ||
Majority | 818 | 44.3 | |||
Turnout | 1,845 | 72 |
Party | Candidate | Votes | % | ±% | |
---|---|---|---|---|---|
Conservative | Warren Whyte | 952 | 63.9 | ||
Green | Nicola Smith | 330 | 22.1 | ||
UKIP | Evangeline Wise | 208 | 14.0 | ||
Majority | 622 | 41.8 | |||
Turnout | 1,490 | 68 |
Party | Candidate | Votes | % | ±% | |
---|---|---|---|---|---|
Conservative | Susanne Chapple | 1,955 | |||
Conservative | Jennifer Bloom | 1,784 | |||
Conservative | Roger King | 1,683 | |||
UKIP | Heather Adams | 1,047 | |||
UKIP | Kim Birchinall | 980 | |||
UKIP | Amiee Gibson | 895 | |||
Labour | Philip Jacques | 798 | |||
Liberal Democrats | Richard Lloyd | 644 | |||
Liberal Democrats | Alan Sherwell | 582 | |||
Liberal Democrats | Peter Vernon | 506 | |||
Green | Coral Simpson | 416 | |||
Green | Gregory Smith | 405 | |||
Green | Haidee Harrison | 376 | |||
Turnout | 12,071 | 66 |
Party | Candidate | Votes | % | ±% | |
---|---|---|---|---|---|
Conservative | Angela Macpherson | 1,026 | 56.1 | ||
Liberal Democrats | Ian Metherell | 413 | 22.6 | ||
UKIP | Andrew Good | 389 | 21.3 | ||
Majority | 613 | 33.5 | |||
Turnout | 1,828 | 71 |
Party | Candidate | Votes | % | ±% | |
---|---|---|---|---|---|
Liberal Democrats | Julie Ward | 1,221 | |||
Liberal Democrats | Alison Harrison | 1,093 | |||
Conservative | Mary Stamp | 1,059 | |||
Conservative | Peter Gwilliams | 1,031 | |||
Conservative | Denise Summers | 1,019 | |||
UKIP | Sheila Cotton | 1,004 | |||
Liberal Democrats | Mark Willis | 929 | |||
UKIP | Martin Norris | 771 | |||
UKIP | Ann Day | 758 | |||
Labour | Robert McNickle | 676 | |||
Green | Joanne Hodge | 420 | |||
Turnout | 9,981 | 69 |
Party | Candidate | Votes | % | ±% | |
---|---|---|---|---|---|
Conservative | Michael Rand | 1,280 | 78.4 | ||
UKIP | William Bate | 353 | 21.6 | ||
Majority | 927 | 56.8 | |||
Turnout | 1,633 | 75 |
Party | Candidate | Votes | % | ±% | |
---|---|---|---|---|---|
Conservative | Sandra Jenkins | 2,035 | |||
Conservative | Derek Town | 1,810 | |||
Green | Johanna Wheeler | 839 | |||
Liberal Democrats | David Evershed | 715 | |||
UKIP | Robyn Adams | 679 | |||
Green | Mary Hodgkiss | 456 | |||
Turnout | 6,534 | 72 |
Party | Candidate | Votes | % | ±% | |
---|---|---|---|---|---|
Conservative | Kevin Hewson | 1,023 | 54.6 | ||
Independent | Robert Hunter | 432 | 23.1 | ||
UKIP | James Styles | 418 | 22.3 | ||
Majority | 591 | 31.5 | |||
Turnout | 1,873 | 76 |
Party | Candidate | Votes | % | ±% | |
---|---|---|---|---|---|
UKIP | Christopher Adams | 1,142 | |||
Conservative | Nicholas Lewis | 988 | |||
UKIP | Andrew Huxley | 918 | |||
Conservative | Samantha North | 895 | |||
UKIP | Graham Cadle | 828 | |||
Conservative | Nadeem Gulraiz | 716 | |||
Labour | Josephine Caldwell | 566 | |||
Liberal Democrats | Shoshana Willetts | 495 | |||
Liberal Democrats | Martin Farrow | 486 | |||
Liberal Democrats | Mohammed Azam | 471 | |||
Turnout | 7,505 | 57 |
Party | Candidate | Votes | % | ±% | |
---|---|---|---|---|---|
Liberal Democrats | Peter Agoro | 772 | |||
Labour | Mark Bateman | 604 | |||
Conservative | Akhmad Hussain | 586 | |||
UKIP | Roy Black | 560 | |||
Conservative | Sarah Sproat | 547 | |||
Liberal Democrats | Sally-Anne Jarvis | 522 | |||
UKIP | Brett Steptowe | 432 | |||
Labour | Tanya Warshaw | 398 | |||
Green | Clare Butler | 152 | |||
Green | Richard Eckersely | 93 | |||
Turnout | 4,666 | 57 |
Party | Candidate | Votes | % | ±% | |
---|---|---|---|---|---|
Conservative | John Chilver | 933 | 56.0 | ||
UKIP | Frank Mahon | 449 | 27.0 | ||
Green | Emma Simpson | 284 | 17.0 | ||
Majority | 484 | 29.0 | |||
Turnout | 1,666 | 69 |
Party | Candidate | Votes | % | ±% | |
---|---|---|---|---|---|
Conservative | Janet Blake | 1,221 | 63.4 | ||
Green | Hannah Lett | 422 | 21.9 | ||
UKIP | Amethyst Sharman | 284 | 14.7 | ||
Majority | 799 | 41.5 | |||
Turnout | 1,927 | 74 |
Party | Candidate | Votes | % | ±% | |
---|---|---|---|---|---|
Conservative | Patrick Fealey | 1,154 | 65.0 | ||
UKIP | Simon Strutt | 340 | 19.1 | ||
Green | Rory Hodgson | 282 | 15.9 | ||
Majority | 814 | 45.9 | |||
Turnout | 1,776 | 69 |
Party | Candidate | Votes | % | ±% | |
---|---|---|---|---|---|
Conservative | Paul Irwin | 799 | 50.2 | ||
UKIP | Gary Good | 402 | 25.2 | ||
Liberal Democrats | David Vick | 392 | 24.6 | ||
Majority | 397 | 25.0 | |||
Turnout | 1,593 | 70 |
Party | Candidate | Votes | % | ±% | |
---|---|---|---|---|---|
UKIP | Brian Adams | 805 | |||
Conservative | Gary Powell | 714 | |||
Conservative | Sophie Vaughan-Evans | 702 | |||
Liberal Democrats | Ranula Takodra | 659 | |||
Liberal Democrats | Steven Kennell | 648 | |||
Labour | Luke Warshaw | 567 | |||
UKIP | Jason Wise | 538 | |||
Turnout | 4,633 | 60 |
Party | Candidate | Votes | % | ±% | |
---|---|---|---|---|---|
Conservative | Ashley Bond | 825 | 49.3 | ||
Liberal Democrats | Lisa Smith | 494 | 29.5 | ||
UKIP | Heather Elliott | 354 | 21.2 | ||
Majority | 331 | 19.8 | |||
Turnout | 1,673 | 72 |
Party | Candidate | Votes | % | ±% | |
---|---|---|---|---|---|
Conservative | Stephen Bowles | 2,374 | |||
Conservative | Peter Strachan | 2,168 | |||
Conservative | Andrew Southam | 1,820 | |||
UKIP | Susan Hetherington | 1,392 | |||
UKIP | Desmond Anning | 1,359 | |||
UKIP | Marc Ruggles | 1,124 | |||
Green | Tom Hodge | 1,057 | |||
Green | Christopher Peeler | 974 | |||
Liberal Democrats | Lloyd Harris | 828 | |||
Green | William Spencer | 504 | |||
Turnout | 13,600 | 73 |
Party | Candidate | Votes | % | ±% | |
---|---|---|---|---|---|
Conservative | Dorothea Glover | 1,210 | 75.5 | ||
UKIP | Barry Walton | 392 | 24.5 | ||
Majority | 818 | 51.0 | |||
Turnout | 1,602 | 70 |
Party | Candidate | Votes | % | ±% | |
---|---|---|---|---|---|
Independent | Peter Cooper | 828 | 46.8 | ||
Conservative | Richard Withey | 540 | 30.5 | ||
UKIP | Nicholas Griffin | 208 | 11.8 | ||
Green | Mark Wheeler | 194 | 11.0 | ||
Majority | 288 | 16.3 | |||
Turnout | 1,770 |
Party | Candidate | Votes | % | ±% | |
---|---|---|---|---|---|
Liberal Democrats | Llewellyn Monger | 1,545 | |||
Conservative | Susan Renshell | 1,351 | |||
Liberal Democrats | Patricia Cawte | 1,248 | |||
Conservative | Brian Speed | 973 | |||
UKIP | Amy Howitt | 394 | |||
UKIP | Margaret Price | 324 | |||
Green | Frazer Payne | 309 | |||
Green | Mary Hunt | 276 | |||
Turnout | 6,420 |
A by-election was held in Grendon Underwood and Brill on 23 December 2015 after the death of Conservative councillor and former leader of the council John Cartwright. [4] The seat was held for the Conservatives by Cameron Branston with a majority of 51 votes over Liberal Democrat Julian Newman. [4]
Party | Candidate | Votes | % | ±% | |
---|---|---|---|---|---|
Conservative | Anthony Cameron Branston | 326 | 43.5 | -11.2 | |
Liberal Democrats | Julian Newman | 275 | 36.7 | +25.8 | |
UKIP | Gary Good | 148 | 19.8 | -2.1 | |
Majority | 51 | 6.8 | -26.0 | ||
Turnout | 749 | 28.8 | -44 | ||
Conservative hold | Swing | ||||
A by-election was held in Elmhurst on 6 April 2017 after the resignation of UK Independence Party councillor Andy Hetherington. [6] [7] The seat was won for the Liberal Democrats by Susan Morgan with a majority of 634 seats over Labour's Gary Andrew Paxton. [8]
Party | Candidate | Votes | % | ±% | |
---|---|---|---|---|---|
Liberal Democrats | Susan Morgan | 785 | 63.5 | +37.9 | |
Labour | Gary Andrew Paxton | 151 | 12.2 | -10.0 | |
Conservative | Ammer Raheel | 147 | 11.9 | -9.3 | |
UKIP | Philip Peter Gomm | 111 | 9.0 | -14.4 | |
Green | Nigel Antony Foster | 43 | 3.5 | -4.2 | |
Majority | 634 | 51.3 | |||
Turnout | 1,244 | 27 | |||
Liberal Democrats gain from UKIP | Swing | ||||
A by-election was held in Wendover and Halton on 4 May 2017 after the resignation of Conservative councillor Andrew Southam. [10] This was held alongside the Buckinghamshire County Council election on the same date. The seat was won for the Conservatives by Richard Allan Newcombe with a majority of 823 seats over Labour's Cath Collier. [11]
Party | Candidate | Votes | % | ±% | |
---|---|---|---|---|---|
Conservative | Richard Allan Newcombe | 1,240 | 51 | ||
Labour | Cath Collier | 417 | 17 | ||
Liberal Democrats | Ashley Richard Morgan | 298 | 12 | ||
UKIP | Des Anning | 273 | 11 | ||
Green | Tom Peter Hodge | 227 | 9 | ||
Turnout | 2,455 | ||||
Conservative hold | Swing | ||||
A by-election was held in Central & Walton on 22 March 2018 following the resignation in February of Conservative councillor Edward Sims. [12] The Liberal Democrats' Waheed Raja gained the seat. [13]
A by-election is expected in Quainton following the death of Kevin Hewson (Conservative) in February 2018. [14]
Tom Hunter-Watts left the Conservative Party and on 5 May 2017 joined the Lib Dems. [15]
On 9 May 2017, all three of UKIP's remaining councillors left the party. [15]
Wendover is a town and civil parish at the foot of the Chiltern Hills in Buckinghamshire, England. It is situated at the point where the main road across the Chilterns between London and Aylesbury intersects with the once important road along the foot of the Chilterns. The town is some 35 miles (56 km) north west of London and 5 miles (8 km) south east of Aylesbury.
Aylesbury is a constituency represented in the House of Commons of the UK Parliament since 2019 by Rob Butler of the Conservative Party.
Buckingham is a constituency represented in the House of Commons of the UK Parliament since 2019 by Greg Smith, a Conservative.
Brent London Borough Council in London, England is elected every four years. Since the last boundary changes in 2002, 63 councillors have been elected from 21 wards.
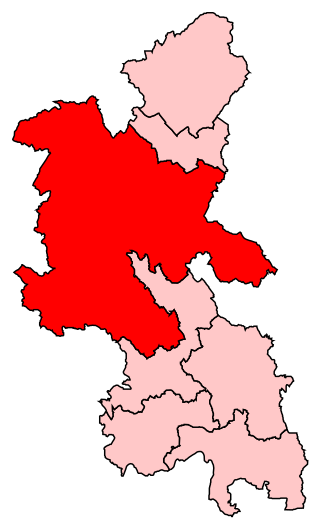
Aylesbury Vale District Council was the council for the non-metropolitan district of Aylesbury Vale in Buckinghamshire, England, which existed as a local government area from 1974 to 2020. The council was elected every four years from 1973 until 2020. At the time of its abolition, the council had 59 councillors, elected from 33 wards.
The 2002 Halton Borough Council election took place on 2 May 2002 to elect members of Halton Unitary Council in Cheshire, England. One third of the council was up for election and the Labour Party stayed in overall control of the council.
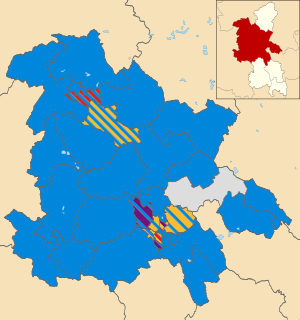
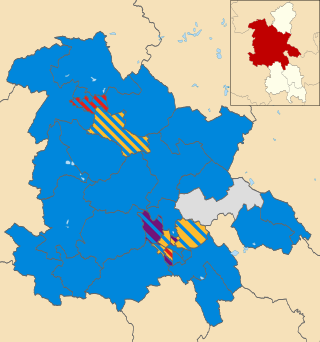
The 2011 Aylesbury Vale District Council election took place on 5 May 2011 to elect members of Aylesbury Vale District Council in Buckinghamshire, England. The whole council was up for election and the Conservative Party stayed in overall control of the council.
The 2012 North Hertfordshire Council election was held on 3 May 2012, at the same time as other local elections across England, Scotland and Wales. Of the 49 seats on North Hertfordshire District Council, 15 were up for election.
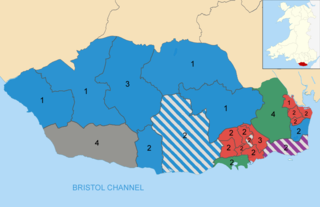
The 2012 Vale of Glamorgan Council election took place on Thursday 3 May 2012 to elect members of Vale of Glamorgan Council in Wales. This was the same day as other United Kingdom local elections. The previous full council election took place on 1 May 2008 and the next one took place on 4 May 2017.
The 2007 Wychavon District Council election took place on 3 May 2007 to elect members of Wychavon District Council in Worcestershire, England. The whole council was up for election and the Conservative party stayed in overall control of the council.
The 2019 United Kingdom local elections took place on Thursday 2 May 2019, with 248 English local councils, six directly elected mayors in England, and all 11 local councils in Northern Ireland being contested.
Elections to City of York Council were held on 2 May 2019, as part of the United Kingdom local elections. The election resulted in substantial gains for the Liberal Democrats, who became the largest party, although no party surpassed the 24-seat majority threshold. The Conservatives suffered badly in this election, and lost 12 of the 14 seats they had won at the previous election. The Green Party held all their four seats, and surpassed the Conservatives in the popular vote. Labour gained two seats, although they failed to gain support in rural areas, where voters favoured the Liberal Democrats. On 14 May, The Liberal Democrats and the Green Party announced that they had agreed to run the council in a new 'progressive partnership' coalition, with Green Party leader Andy D'Agorne assuming the role of Deputy Leader of the Council while Liberal Democrat leader Keith Aspden succeeded Ian Gillies as Leader of the Council.
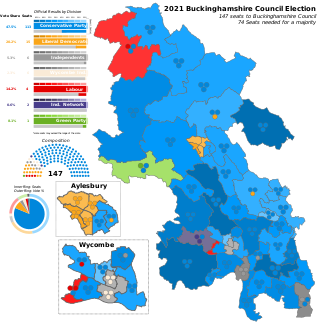
The 2021 Buckinghamshire Council election took place on 6 May 2021, alongside nationwide local elections. The election was originally due to take place in May 2020, but was postponed due to the COVID-19 pandemic.
The 2019 Horsham District Council election took place on 2 May 2019 to elect members of Horsham District Council in England. It was held on the same day as other local elections. Every seat was contested and the Conservatives retained control of the council with a majority of 8.
The 2021 Cambridgeshire County Council election took place on 6 May 2021 as part of the 2021 local elections in the United Kingdom. All 61 councillors were elected from 59 electoral divisions, which returned either one or two county councillors each by first-past-the-post voting for a four-year term of office. The election was held alongside a full election for Cambridge City Council, the Cambridgeshire Police and Crime Commissioner, Mayor of Cambridgeshire and Peterborough and one-third of Peterborough City Council.
The 2021 North Hertfordshire District Council election took place on 6 May 2021 to elect 17 of the 49 members of North Hertfordshire District Council in England. This was on the same day as other local elections around the country. This election had originally been due to take place in May 2020, but was postponed due to the COVID-19 pandemic.
The 2022 Manchester City Council election took place on 5 May 2022. One third of councillors on Manchester City Council were elected. This election was a part of the other local elections across the United Kingdom.
The 2022 Exeter City Council election took place on 5 May 2022 to elect members to Exeter City Council in Devon, England. This was the same day as other local elections in the United Kingdom. 17 of the 39 seats were up for election, one councillor in each of the 13 wards, and 4 by-elections. These wards were last contested in 2018.
The 2022 Knowsley Metropolitan Borough Council election took place on 5 May 2022. One third of councillors — 15 out of 45 — on Knowsley Metropolitan Borough Council were elected. The election took place alongside other local elections across the United Kingdom.