The 2015 Scarborough Borough Council election took place on 7 May 2015 to elect members of the Scarborough Borough Council in England. [1] It was held on the same day as other local elections.
Party | Seats | Gains | Losses | Net gain/loss | Seats % | Votes % | Votes | +/− | |
---|---|---|---|---|---|---|---|---|---|
Conservative | 26 | 5 | 4 | ![]() | 52 | 32.5 | 20,158 | ||
Labour | 14 | 8 | 0 | ![]() | 28 | 21.9 | 13,581 | ||
UKIP | 5 | 5 | 0 | ![]() | 10 | 21.6 | 13,408 | ||
Independent | 3 | 0 | 11 | ![]() | 6 | 8.3 | 5,137 | ||
Green | 2 | 1 | 1 | ![]() | 4 | 10.5 | 6,522 | ||
Liberal Democrats | 0 | 0 | 3 | ![]() | 0 | 5.2 | 3,233 | ||
National Front | 0 | 0 | 0 | ![]() | 0 | 0.0 | 11 |
Party | Candidate | Votes | % | ±% | |
---|---|---|---|---|---|
Independent | Janet Jefferson* | 872 | 51.1 | −18.8 | |
Labour | Paul Cross | 628 | 36.8 | −2.1 | |
UKIP | Barret Wilson | 402 | 23.6 | N/A | |
Green | Jason Mullen | 380 | 22.3 | N/A | |
Conservative | Anthony Fawcett | 327 | 19.2 | −8.3 | |
Majority | |||||
Turnout | 1,707 | 54 | |||
Independent hold | Swing | ||||
Labour hold | Swing |
Party | Candidate | Votes | % | ±% | |
---|---|---|---|---|---|
Conservative | Simon Green* | 1,100 | 43.7 | +3.6 | |
Conservative | Roberta Swiers | 1,054 | 41.9 | +3.7 | |
Labour | James Brace | 745 | 29.6 | +7.5 | |
UKIP | Nicholas Henderson | 673 | 26.7 | N/A | |
Majority | |||||
Turnout | 2,534 | 71 | |||
Conservative hold | Swing | ||||
Conservative gain from Independent | Swing |
Party | Candidate | Votes | % | ±% | |
---|---|---|---|---|---|
Labour | David Billing* | 706 | 42.9 | +3.9 | |
Labour | Eric Broadbent* | 590 | 35.9 | +2.0 | |
UKIP | Deborah McDonald | 344 | 20.9 | N/A | |
Conservative | Brenda Kaye | 340 | 20.7 | +3.4 | |
UKIP | Timothy Thorne | 332 | 20.2 | N/A | |
Green | Christopher Phillips | 234 | 14.2 | +1.8 | |
Liberal Democrats | Jacob Cook | 194 | 11.8 | −17.9 | |
Majority | |||||
Turnout | 1,646 | 51 | |||
Labour hold | Swing | ||||
Labour hold | Swing |
Party | Candidate | Votes | % | ±% | |
---|---|---|---|---|---|
Conservative | Clive Pearson | 686 | 55.1 | −16.6 | |
Labour | Joan Snape | 207 | 16.6 | −11.7 | |
Green | Annette Hudspith | 145 | 11.6 | N/A | |
UKIP | Michael King | 145 | 11.6 | N/A | |
Liberal Democrats | George Dawson | 63 | 5.1 | N/A | |
Majority | |||||
Turnout | 1,253 | 74 | |||
Conservative hold | Swing |
Party | Candidate | Votes | % | ±% | |
---|---|---|---|---|---|
Conservative | David Jeffels* | 1,435 | 55.7 | −2.7 | |
Conservative | Heather Phillips* | 873 | 33.9 | +0.1 | |
Labour | Colin Challen** | 581 | 22.5 | N/A | |
UKIP | Lee Crowley | 569 | 22.1 | N/A | |
Liberal Democrats | Robert Lockwood | 454 | 17.6 | −4.8 | |
Majority | |||||
Turnout | 2,583 | 72 | |||
Conservative hold | Swing | ||||
Conservative gain from Independent | Swing |
Colin Challen was a sitting councillor for Castle ward.
Party | Candidate | Votes | % | ±% | |
---|---|---|---|---|---|
Labour | Tony Randerson* | 713 | 36.3 | +8.1 | |
Labour | John Warburton | 596 | 30.4 | +5.5 | |
UKIP | Jonathan Dodds | 564 | 28.7 | N/A | |
Labour | Joanne Maw | 563 | 28.7 | +1.7 | |
UKIP | Jordan Seston | 535 | 27.3 | N/A | |
UKIP | Arthur Healy | 522 | 26.6 | N/A | |
Conservative | Calvin Simmons | 349 | 17.8 | +8.4 | |
Liberal Democrats | Johannes Zegstroo* | 219 | 11.2 | −25.8 | |
Green | Josh Foskett | 118 | 6.0 | N/A | |
Majority | |||||
Turnout | 1,963 | 49 | |||
Labour gain from Liberal Democrats | Swing | ||||
UKIP gain from Liberal Democrats | Swing |
Party | Candidate | Votes | % | ±% | |
---|---|---|---|---|---|
Conservative | Guy Coulson* | 1,384 | 55.7 | −11.6 | |
Conservative | Phillip Trumper | 939 | 37.8 | −15.0 | |
Labour | John Chilton | 562 | 22.6 | +1.0 | |
Labour | Caroline Willder | 448 | 18.0 | N/A | |
UKIP | Kenneth Hordon | 435 | 17.5 | N/A | |
UKIP | Lawrence Waller | 346 | 13.9 | N/A | |
Majority | |||||
Turnout | 2,501 | 71 | |||
Conservative hold | Swing | ||||
Conservative hold | Swing |
Party | Candidate | Votes | % | ±% | |
---|---|---|---|---|---|
Labour | John Ritchie* | 724 | 35.9 | −2.3 | |
Labour | Liz Colling | 628 | 31.1 | N/A | |
Independent | Patricia Marsburg* | 500 | 24.8 | −14.7 | |
UKIP | Deirdre Abbott | 477 | 23.6 | N/A | |
UKIP | Deirdre Bowen | 466 | 23.1 | N/A | |
Green | Stuart Noble | 291 | 14.4 | −3.0 | |
Liberal Democrats | Andrew Ellis | 250 | 12.4 | +3.1 | |
Majority | |||||
Turnout | 2,037 | 56 | |||
Labour gain from Independent | Swing | ||||
Labour hold | Swing |
Party | Candidate | Votes | % | ±% | |
---|---|---|---|---|---|
Independent | Mike Cockerill* | 1,554 | 48.1 | −17.8 | |
UKIP | Sam Cross* | 1,168 | 36.2 | −19.3 | |
UKIP | Colin Haddington* | 1,103 | 34.1 | −18.1 | |
Conservative | Anthony Viney | 1,004 | 31.1 | −21.1 | |
UKIP | John Casey | 907 | 28.1 | N/A | |
Green | Nicholas Harvey | 587 | 18.2 | N/A | |
Majority | |||||
Turnout | 3,295 | 61 | |||
Independent hold | Swing | ||||
UKIP gain from Independent | Swing | ||||
UKIP gain from Conservative | Swing |
Party | Candidate | Votes | % | ±% | |
---|---|---|---|---|---|
Conservative | Jane Mortimer* | 630 | 52.0 | −19.6 | |
Labour | Judith Dennett | 277 | 22.9 | −5.5 | |
UKIP | John Thistle | 218 | 18.0 | N/A | |
Green | Peter Jordan | 86 | 7.1 | N/A | |
Majority | |||||
Turnout | 1,215 | 70 | |||
Conservative hold | Swing |
Party | Candidate | Votes | % | ±% | |
---|---|---|---|---|---|
Conservative | Godfrey Allanson* | 1,300 | 49.7 | −0.9 | |
Conservative | Michelle Donohue-Moncrieff* | 1,230 | 47.0 | +22.1 | |
UKIP | Janine Robinson | 890 | 34.0 | N/A | |
Green | Patricia Walker | 729 | 27.9 | −39.0 | |
Majority | |||||
Turnout | 2,628 | 65 | |||
Conservative gain from Green | Swing | ||||
Conservative hold | Swing |
Party | Candidate | Votes | % | ±% | |
---|---|---|---|---|---|
Conservative | Andrew Backhouse* | 964 | 73.9 | −3.4 | |
Labour | Andrew Leak | 340 | 26.1 | +14.3 | |
Majority | |||||
Turnout | 1,331 | 74 | |||
Conservative hold | Swing |
Party | Candidate | Votes | % | ±% | |
---|---|---|---|---|---|
Conservative | David Chance* | 1,014 | 41.9 | +0.4 | |
Labour | Gerald Dennett | 961 | 39.7 | +0.5 | |
Conservative | Jane Kenyon-Miller* | 875 | 36.2 | −14.5 | |
UKIP | Neil Kipling | 668 | 27.6 | N/A | |
Majority | |||||
Turnout | 2,430 | 65 | |||
Conservative hold | Swing | ||||
Labour gain from Conservative | Swing |
Party | Candidate | Votes | % | ±% | |
---|---|---|---|---|---|
Conservative | Marie Harland* | 795 | 40.9 | −18.0 | |
Conservative | John Nock | 558 | 28.7 | N/A | |
Independent | John Armsby* | 494 | 25.4 | −27.3 | |
UKIP | John Dickinson | 410 | 21.1 | N/A | |
Labour | Diane Jeuda | 353 | 18.2 | −5.9 | |
Labour | Aileen Peake | 309 | 15.9 | N/A | |
Green | Neil Bye | 212 | 10.9 | N/A | |
Independent | Connie Peach | 188 | 9.7 | N/A | |
Majority | |||||
Turnout | 1,944 | 70 | |||
Conservative hold | Swing | ||||
Conservative gain from Independent | Swing |
Party | Candidate | Votes | % | ±% | |
---|---|---|---|---|---|
Conservative | Andrew Jenkinson* | 1,260 | 36.5 | +5.0 | |
Labour | Vanda Inman | 1,102 | 31.9 | +9.3 | |
Conservative | Luke Backhouse | 1,034 | 29.9 | −0.5 | |
UKIP | Andrew Smith | 1,026 | 29.7 | N/A | |
UKIP | Graham Snelson | 833 | 24.1 | N/A | |
Conservative | Thomas Miller | 761 | 22.0 | −5.9 | |
Green | Helen Kindness | 686 | 19.9 | +5.6 | |
Liberal Democrats | Joseph Hagan | 503 | 14.6 | +2.0 | |
Independent | Deborah Wiles | 403 | 11.7 | N/A | |
Majority | |||||
Turnout | 3,460 | 68 | |||
Conservative gain from Independent | Swing | ||||
Labour gain from Independent | Swing | ||||
Conservative hold | Swing |
Party | Candidate | Votes | % | ±% | |
---|---|---|---|---|---|
Labour | Neil Price | 726 | 37.2 | +4.5 | |
Conservative | Martin Smith* | 462 | 23.7 | −6.4 | |
UKIP | Guy Smith | 452 | 23.2 | −2.1 | |
Conservative | Ros Fox | 443 | 22.7 | N/A | |
UKIP | Susan Johnson | 417 | 21.4 | N/A | |
Green | Katy Graley | 340 | 17.4 | +4.9 | |
Independent | Jo Swift | 210 | 10.8 | N/A | |
Majority | |||||
Turnout | 1,954 | 57 | |||
Labour hold | Swing | ||||
Conservative hold | Swing |
Party | Candidate | Votes | % | ±% | |
---|---|---|---|---|---|
Labour | Carl Maw | 748 | 37.9 | +3.8 | |
UKIP | Norman Murphy* | 624 | 31.6 | −3.7 | |
Conservative | Matthew Kay | 586 | 29.7 | +9.6 | |
Independent | Peter Popple* | 550 | 27.9 | −19.0 | |
UKIP | Bryan Thomas | 336 | 17.0 | N/A | |
Liberal Democrats | Paul Cook | 263 | 13.3 | +5.8 | |
Majority | |||||
Turnout | 1,975 | 64 | |||
Labour gain from Independent | Swing | ||||
UKIP gain from Independent | Swing |
Party | Candidate | Votes | % | ±% | |
---|---|---|---|---|---|
Labour | Steve Siddons* | 773 | 43.2 | +16.3 | |
Green | Mark Vesey | 550 | 30.7 | +10.0 | |
Conservative | Jonathan Simmons | 452 | 25.2 | −6.1 | |
UKIP | Stuart Abbott | 420 | 23.5 | N/A | |
Conservative | Teddy Sulman | 407 | 22.7 | −6.2 | |
UKIP | Chris Daniels | 392 | 21.9 | N/A | |
Liberal Democrats | John-Paul Zegstroo | 196 | 10.9 | −12.3 | |
Majority | |||||
Turnout | 1,795 | 61 | |||
Labour gain from Independent | Swing | ||||
Green gain from Conservative | Swing |
Party | Candidate | Votes | % | ±% | |
---|---|---|---|---|---|
Conservative | Derek Bastiman* | 1,305 | 50.9 | −9.0 | |
Conservative | Hazel Lynskey | 1,097 | 42.8 | −8.0 | |
UKIP | Stuart Walker | 631 | 24.6 | N/A | |
Labour | Subash Sharma** | 495 | 19.3 | N/A | |
Green | John Munro | 387 | 15.1 | −3.6 | |
Majority | |||||
Turnout | 2,568 | 76 | |||
Conservative hold | Swing | ||||
Conservative hold | Swing |
Subash Sharma was a sitting councillor for North Bay ward.
Party | Candidate | Votes | % | ±% | |
---|---|---|---|---|---|
Conservative | Helen Mallory* | 1,162 | 46.2 | +3.5 | |
UKIP | Roxanne Murphy* | 906 | 36.0 | +2.2 | |
Liberal Democrats | Kayleigh Bradley | 499 | 19.8 | N/A | |
Liberal Democrats | Bob Jackman | 403 | 16.0 | −3.0 | |
Green | Michael Cutler | 373 | 14.8 | +0.9 | |
Majority | |||||
Turnout | 2,546 | 68 | |||
Conservative hold | Swing | ||||
UKIP gain from Independent | Swing |
Party | Candidate | Votes | % | ±% | |
---|---|---|---|---|---|
Conservative | Lynn Bastiman* | 640 | 28.9 | +0.7 | |
Green | Dilys Cluer* | 628 | 28.4 | −5.0 | |
UKIP | Mark Harland | 542 | 24.5 | N/A | |
Labour | Andy Lee | 461 | 20.8 | −0.2 | |
Green | David Hugh-Malone | 433 | 19.6 | +1.3 | |
Labour | Colin Barnes | 429 | 19.4 | +4.8 | |
Liberal Democrats | Alix Bartlett-Cook | 166 | 7.5 | −2.2 | |
Majority | |||||
Turnout | 2,217 | 66 | |||
Conservative hold | Swing | ||||
Green hold | Swing |
Party | Candidate | Votes | % | ±% | |
---|---|---|---|---|---|
Labour | Rob Barnett | 681 | 36.4 | +7.1 | |
Conservative | Sandra Turner* | 555 | 29.7 | −8.6 | |
UKIP | Mike Ward | 550 | 29.4 | N/A | |
Labour | Paul Tulloch | 469 | 25.1 | −1.8 | |
Conservative | Dorothy Clegg* | 421 | 22.5 | −10.0 | |
Green | Amanda Smith | 214 | 11.4 | N/A | |
Majority | |||||
Turnout | 1,879 | 54 | |||
Labour gain from Conservative | Swing | ||||
Conservative hold | Swing |
Party | Candidate | Votes | % | ±% | |
---|---|---|---|---|---|
Conservative | Thomas Fox* | 743 | 36.9 | −13.8 | |
Conservative | Callam Walsh | 677 | 33.6 | −18.9 | |
Labour | Chris Head | 528 | 26.2 | +8.5 | |
UKIP | Sean Hunter | 392 | 19.5 | −3.0 | |
Green | David King | 360 | 17.9 | +3.3 | |
UKIP | Frank Wright | 327 | 16.2 | N/A | |
Liberal Democrats | Natasha Cook | 316 | 15.7 | N/A | |
Majority | |||||
Turnout | 2,019 | 70 | |||
Conservative hold | Swing | ||||
Conservative hold | Swing |
Party | Candidate | Votes | % | ±% | |
---|---|---|---|---|---|
Conservative | Joseph Plant* | 833 | 44.2 | −6.0 | |
Conservative | Alf Abbott* | 721 | 38.3 | −1.4 | |
Labour | Noreen Wilson | 622 | 33.0 | +10.6 | |
Labour | Heather Relf | 580 | 30.8 | +10.3 | |
UKIP | Derek Robinson | 505 | 26.8 | N/A | |
Majority | |||||
Turnout | 1,895 | 60 | |||
Conservative hold | Swing | ||||
Conservative hold | Swing |
Party | Candidate | Votes | % | ±% | |
---|---|---|---|---|---|
Labour | Richard Moody | 648 | 34.8 | −8.6 | |
Independent | William Chatt* | 554 | 29.8 | −13.8 | |
Conservative | Jennifer Kelly | 425 | 22.8 | +2.7 | |
UKIP | Phil McDonald | 397 | 21.3 | −4.8 | |
UKIP | John Elwell-Sutton | 355 | 19.1 | N/A | |
Green | Gabrielle Naptali | 202 | 10.9 | +1.4 | |
Liberal Democrats | Jackie Bowdidge | 110 | 5.9 | −2.2 | |
National Front | Trisha Scott | 11 | 0.6 | N/A | |
Majority | |||||
Turnout | 1,869 | 57 | |||
Labour hold | Swing | ||||
Independent hold | Swing |
The 1998 Wirral Metropolitan Borough Council election took place on 7 May 1998 to elect members of Wirral Metropolitan Borough Council in England. This election was held on the same day as other local elections.
The 2003 Wirral Metropolitan Borough Council election took place on 1 May 2003 to elect members of Wirral Metropolitan Borough Council in England. This election was held on the same day as other local elections.
Middlesbrough Council is a unitary authority in North Yorkshire, England. Until 1 April 1996 it was a non-metropolitan district in Cleveland. Since 2002 it has also had a directly elected mayor.
Scarborough Borough Council in North Yorkshire, England was established in 1974 and abolished in 2023. It was elected once every four years.
The 2012 Wirral Metropolitan Borough Council election took place on 3 May 2012 to elect members of Wirral Metropolitan Borough Council in England. This election was held on the same day as other local elections.
The 2014 Southwark Council election took place on 22 May 2014 to elect members of Southwark Borough Council in London, England. This was on the same day as other local elections.
The 2015 Wirral Metropolitan Borough Council election took place on 7 May 2015 to elect members of Wirral Metropolitan Borough Council in England. This election was held on the same day as other local elections.
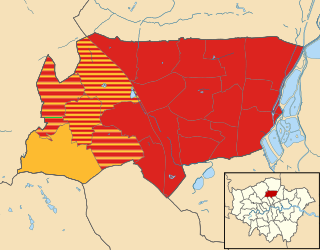
The 1994 Brent Council election took place on 5 May 1994 to elect members of Brent London Borough Council in London, England. The whole council was up for election and the council stayed in no overall control.
The 1990 Hammersmith and Fulham Council election took place on 3 May 1990 to elect members of Hammersmith and Fulham London Borough Council in London, England. The whole council was up for election and the Labour party stayed in overall control of the council.
The 1994 Hammersmith and Fulham Borough Council election took place on 5 May 1994 to elect members of Hammersmith and Fulham London Borough Council in London, England. The whole council was up for election and the Labour Party regained overall control of the council, which it had lost during the previous council term.
The 1994 Hillingdon Council election took place on 5 May 1994 to elect members of Hillingdon London Borough Council in London, England. The whole council was up for election and the Labour Party gained overall control of the council.
Elections for the London Borough of Merton were held on 5 May 1994 to elect members of Merton London Borough Council in London, England. This was on the same day as other local elections in England.
Elections for Boston Borough Council, which governs as a second-tier authority the Borough of Boston were held on Thursday 7 May 2015. Following Boundary Commission changes between this election and the previous in 2011 to the wards, 30 councillors were elected to serve 15 wards. The election was held on the same day as other local elections.
Oxton is a Wirral Metropolitan Borough Council ward in the Birkenhead Parliamentary constituency.
The 1990 Wirral Metropolitan Borough Council election took place on 3 May 1990 to elect members of Wirral Metropolitan Borough Council in England. This election was held on the same day as other local elections.
The 1991 Wirral Metropolitan Borough Council election took place on 2 May 1991 to elect members of Wirral Metropolitan Borough Council in England. This election was held on the same day as other local elections.
The 2021 Wirral Metropolitan Borough Council election took place on 6 May 2021 to elect members of Wirral Metropolitan Borough Council in England. This election was held on the same day as other local elections. The election was originally due to take place in May 2020, but was postponed due to the COVID-19 pandemic. This delay meant those elected would serve only a three-year term.
The 2019 Woking Borough Council election took place on 2 May 2019 to elect one third of members to Woking Borough Council in England coinciding with other local elections held across much of England. Elections in each ward are held in three years out of four. The previous election was held in 2018 and the next election was due to be held in 2020 but was instead deferred to 2021 along with all other ‘2020’ local elections due to the COVID-19 pandemic.
Elections to Hampshire County Council took place on 6 May 2021 as part of the 2021 United Kingdom local elections. All 78 seats were up for election, with each ward returning either one or two councillors by first-past-the-post voting for a four-year term of office. This took place at the same time as the elections for the Hampshire Police and Crime Commissioner and district councils.
The 2022 Haringey London Borough Council election took place on 5 May 2022. All 57 members of Haringey London Borough Council were elected. The elections took place alongside local elections in the other London boroughs and elections to local authorities across the United Kingdom.