| |||||||||||||||||||||||||||||||||||||||||
All 72 seats to North Yorkshire County Council 37 seats needed for a majority | |||||||||||||||||||||||||||||||||||||||||
---|---|---|---|---|---|---|---|---|---|---|---|---|---|---|---|---|---|---|---|---|---|---|---|---|---|---|---|---|---|---|---|---|---|---|---|---|---|---|---|---|---|
| |||||||||||||||||||||||||||||||||||||||||
Map showing the results of the 2013 North Yorkshire County Council election. Striped divisions have mixed representation. | |||||||||||||||||||||||||||||||||||||||||
|
An election to North Yorkshire County Council took place on 2 May 2013 as part of the 2013 United Kingdom local elections. 72 councillors were elected from 68 electoral divisions, which returned either one or two county councillors each by first-past-the-post voting for a four-year term of office. The four divisions which elected two members were Harrogate Bilton & Nidd Gorge, Harrogate Central, Knaresborough, and Selby Barlby. Of those seats UKIP won its first ever seats on the council in Bilton and Nidd Gorge. The electoral divisions were the same as those used at the previous election in 2009. The election saw the Conservative Party maintain overall control of the council.
All locally registered electors (British, Irish, Commonwealth and European Union citizens) who were aged 18 or over on Thursday 2 May 2013 were entitled to vote in the local elections. Those who were temporarily away from their ordinary address (for example, away working, on holiday, in student accommodation or in hospital) were also entitled to vote in the local elections, [1] although those who had moved abroad and registered as overseas electors cannot vote in the local elections. It is possible to register to vote at more than one address (such as a university student who had a term-time address and lives at home during holidays) at the discretion of the local Electoral Register Office, but it remains an offence to vote more than once in the same local government election. [2]
Party | Seats | Gains | Losses | Net gain/loss | Seats % | Votes % | Votes | +/− | |
---|---|---|---|---|---|---|---|---|---|
Conservative | 45 | -3 | 62.5% | 40.6% | 64,273 | ||||
Liberal Democrats | 8 | -3 | 11.1% | 11.4% | 17,997 | ||||
Labour | 7 | +6 | 9.7% | 16.5% | 26,094 | ||||
UKIP | 2 | 2 | 0 | +2 | 2.7% | 16.0% | 25,358 | ||
Independent | 8 | -4 | 11.1% | 11.5% | 18,196 | ||||
Liberal | 2 | 1 | 0 | +1 | 2.7% | 1.4% | 2,287 | ||
Green | 0 | 0 | 0 | 0 | 0 | 2.7% | 4,228 | ||
National Front | 0 | 0 | 0 | 0 | 0 | 0.0% | 9 |
Party | Candidate | Votes | % | ±% | |
---|---|---|---|---|---|
Conservative | Patrick Mulligan* | 1,096 | 59.9 | +12.2 | |
Labour | Graeme Hitchen | 381 | 20.8 | +10.0 | |
Liberal Democrats | Mark Wheeler | 353 | 19.3 | -22.2 | |
Majority | 715 | 39.1 | +32.9 | ||
Turnout | 1,830 | 28.8 | |||
Conservative hold | Swing | +1.1 | |||
Party | Candidate | Votes | % | ±% | |
---|---|---|---|---|---|
Conservative | Shelagh Marshall* | 1,445 | 57.0 | -4.3 | |
Independent | Chris Beazley | 676 | 26.6 | N/A | |
Labour | Jim Black | 226 | 8.9 | +0.8 | |
Green | David Noland | 190 | 7.5 | N/A | |
Majority | 769 | 30.4 | -14.7 | ||
Turnout | 2,537 | 36.3 | |||
Conservative hold | Swing | -15.5 | |||
Party | Candidate | Votes | % | ±% | |
---|---|---|---|---|---|
Conservative | David Ireton* | 1,117 | 55.4 | -24.9 | |
Independent | Tony Macaulay | 466 | 23.1 | N/A | |
Labour | John Matthew | 308 | 15.3 | -4.4 | |
Liberal Democrats | Pascal Jacquemain | 124 | 6.2 | N/A | |
Majority | 651 | 32.3 | -28.3 | ||
Turnout | 2,015 | 32.7 | |||
Conservative hold | Swing | -24.0 | |||
Party | Candidate | Votes | % | ±% | |
---|---|---|---|---|---|
Conservative | Richard Welch* | 997 | 45.6 | -8.2 | |
Independent | Chris Moorby | 883 | 40.4 | N/A | |
Labour | Christine Rose | 308 | 14.1 | +4.4 | |
Majority | 114 | 5.2 | -12.1 | ||
Turnout | 2,188 | 35.0 | |||
Conservative hold | Swing | -24.3 | |||
Party | Candidate | Votes | % | ±% | |
---|---|---|---|---|---|
Independent | Robert Heseltine* | 1,194 | 54.1 | +7.6 | |
Conservative | James Stafford | 329 | 14.9 | -11.3 | |
Liberal Democrats | Eric Jaquin | 292 | 13.2 | +3.1 | |
Labour | Duncan Hall | 243 | 11.0 | +3.0 | |
Green | Claire Nash | 149 | 6.8 | N/A | |
Majority | 865 | 39.2 | +18.9 | ||
Turnout | 2,207 | 31.6 | |||
Independent hold | Swing | +9.5 | |||
Party | Candidate | Votes | % | ±% | |
---|---|---|---|---|---|
Liberal Democrats | Polly English* | 572 | 28.7 | -12.1 | |
Independent | Andy Solloway | 471 | 23.6 | N/A | |
Conservative | Paul Whitaker | 407 | 20.4 | -16.9 | |
Green | Fiona Protheroe | 312 | 15.6 | N/A | |
Labour | Peter Madeley | 234 | 11.7 | +0.1 | |
Majority | 101 | 5.1 | +1.6 | ||
Turnout | 1,996 | 33.5% | |||
Liberal Democrats hold | Swing | -17.9 | |||
Party | Candidate | Votes | % | ±% | |
---|---|---|---|---|---|
Independent | Philip Barrett* | 1,133 | 63.5 | -6.7 | |
UKIP | Roger Baxandall | 508 | 28.5 | +15.2 | |
Labour | Birdie Reeves | 144 | 8.1 | +4.1 | |
Majority | 625 | 35.0 | -20.7 | ||
Turnout | 1,785 | 29.3 | |||
Independent hold | Swing | -11.0 | |||
Party | Candidate | Votes | % | ±% | |
---|---|---|---|---|---|
Conservative | John Weighell* | 1,204 | 52.8 | -3.7 | |
Independent | Ian Watkins | 466 | 20.4 | -16.8 | |
UKIP | Graham Cullen | 437 | 19.2 | N/A | |
Labour | Pam King | 172 | 7.5 | +1.2 | |
Majority | 738 | 32.4 | +13.1 | ||
Turnout | 2,279 | 34.3 | |||
Conservative hold | Swing | +6.6 | |||
Party | Candidate | Votes | % | ±% | |
---|---|---|---|---|---|
Conservative | Peter Sowray* | 1,327 | 71.2 | +5.7 | |
Labour | Kathleen Mullen | 538 | 28.8 | +19.4 | |
Majority | 789 | 42.4 | +2.0 | ||
Turnout | 1,865 | 26.8 | |||
Conservative hold | Swing | -6.9 | |||
Party | Candidate | Votes | % | ±% | |
---|---|---|---|---|---|
Conservative | Heather Moorhouse* | 1,059 | 52.0 | -7.4 | |
UKIP | Stuart Lightwing | 538 | 26.4 | N/A | |
Labour | Paul Spellman | 274 | 13.5 | +7.3 | |
Liberal Democrats | Richard Short | 165 | 8.1 | -19.0 | |
Majority | 521 | 25.6 | -6.7 | ||
Turnout | 2,036 | 37.3 | |||
Conservative hold | Swing | -16.7 | |||
Party | Candidate | Votes | % | ±% | |
---|---|---|---|---|---|
Conservative | Tim Swales* | 1,257 | 64.6 | -6.1 | |
UKIP | Harry Burton | 402 | 20.7 | N/A | |
Labour | Mike Newton | 286 | 14.7 | +6.0 | |
Majority | 855 | 43.9 | -6.2 | ||
Turnout | 1,945 | 32.4 | |||
Conservative hold | Swing | -13.4 | |||
Party | Candidate | Votes | % | ±% | |
---|---|---|---|---|---|
Conservative | Tony Hall* | 825 | 52.4 | -21.0 | |
UKIP | Claire Palmer | 489 | 31.1 | N/A | |
Labour | Gerry Ramsden | 259 | 16.5 | -10.1 | |
Majority | 336 | 21.3 | -25.5 | ||
Turnout | 1,573 | 24.9 | |||
Conservative hold | Swing | -26.1 | |||
Party | Candidate | Votes | % | ±% | |
---|---|---|---|---|---|
Conservative | David Blades* | 1,155 | 54.3 | -10.4 | |
UKIP | Joseph Warfield | 530 | 24.9 | N/A | |
Labour | Ann Hutchings | 441 | 20.7 | +6.4 | |
Majority | 625 | 29.4 | -14.3 | ||
Turnout | 2,126 | 31.1 | |||
Conservative hold | Swing | -17.7 | |||
Party | Candidate | Votes | % | ±% | |
---|---|---|---|---|---|
Conservative | Bob Baker | 1,031 | 59.1 | +3.8 | |
Labour | Kate Fox | 406 | 23.3 | +5.6 | |
Green | Steve Hunter | 307 | 17.6 | N/A | |
Majority | 625 | 37.8 | +2.0 | ||
Turnout | 1,744 | 26.9 | |||
Conservative hold | Swing | -0.8 | |||
Party | Candidate | Votes | % | ±% | |
---|---|---|---|---|---|
Conservative | Caroline Patmore* | 1,331 | 66.9 | -0.9 | |
Green | Jonathan Tulloch | 347 | 17.4 | N/A | |
Labour | Ewan Sommerville | 311 | 15.6 | +5.5 | |
Majority | 984 | 49.5 | -2.2 | ||
Turnout | 1,989 | 29.6 | |||
Conservative hold | Swing | -9.2 | |||
Party | Candidate | Votes | % | ±% | |
---|---|---|---|---|---|
Liberal Democrats | Bryn Griffiths* | 832 | 34.1 | -19.3 | |
Conservative | Stephen Dickins | 757 | 31.1 | -10.6 | |
UKIP | David Troughton | 427 | 17.5 | N/A | |
Labour | Eileen Driver | 421 | 17.3 | +12.4 | |
Majority | 75 | 3.0 | -8.7 | ||
Turnout | 2,437 | 40.5 | |||
Liberal Democrats hold | Swing | -4.4 | |||
Party | Candidate | Votes | % | ±% | |
---|---|---|---|---|---|
Conservative | Arthur Barker* | 1,260 | 62.4 | -11.2 | |
UKIP | Jacqueline Brakenberry | 501 | 24.8 | N/A | |
Labour | Lenny Cornwall | 259 | 12.8 | +4.9 | |
Majority | 759 | 37.6 | -17.5 | ||
Turnout | 2,020 | 31.8 | |||
Conservative hold | Swing | -18.0 | |||
Party | Candidate | Votes | % | ±% | |
---|---|---|---|---|---|
Conservative | Gareth Dadd* | 1,673 | 84.0 | +2.9 | |
Labour | Jude Thurlow | 319 | 16.0 | N/A | |
Majority | 1,354 | 68.0 | +5.8 | ||
Turnout | 1,992 | 31.3 | |||
Conservative hold | Swing | -9.5 | |||
Party | Candidate | Votes | % | ±% | |
---|---|---|---|---|---|
Liberal | John Savage* | 989 | 37.7 | N/A | |
Conservative | Famida Wilson | 897 | 34.2 | -38.2 | |
UKIP | Robert Frendt | 480 | 18.3 | N/A | |
Labour | John Fisher | 258 | 9.8 | +2.1 | |
Majority | 92 | 3.5 | -49.0 | ||
Turnout | 2,624 | 36.4 | |||
Liberal gain from Conservative | Swing | +38.0 | |||
Cllr John Savage was the Incumbent Councillor, however left the Conservative Party in 2010, before then joining the Liberal Party. Savage's vote share change is shown with that of the Liberal Party in the last election, who did not stand in said election.
Party | Candidate | Votes | % | ±% | |
---|---|---|---|---|---|
Conservative | Robert Windass | 1,220 | 47.7 | -14.5 | |
UKIP | Paul Hudson | 759 | 29.7 | N/A | |
Liberal | Peter Philips | 337 | 13.2 | N/A | |
Labour | Alec Hendry | 242 | 9.5 | +4.0 | |
Majority | 461 | 18.0 | -11.9 | ||
Turnout | 2,558 | 34.2 | |||
Conservative hold | Swing | -22.1 | |||
Party | Candidate | Votes | % | ±% | |
---|---|---|---|---|---|
UKIP | David Simister | 1,164 | 28.9 | N/A | |
Liberal Democrats | Andrew Goss* | 1,145 | 28.5 | -17.0 | |
Liberal Democrats | Geoff Webber* | 1,112 | |||
UKIP | Mark Simpson | 875 | |||
Conservative | Steven Jackson | 747 | 18.6 | -15.3 | |
Conservative | Graham Swift | 690 | |||
Labour | Andrew Gray | 642 | 16.0 | +6.5 | |
Labour | Brian Summerson | 542 | |||
Green | Claire Hawkins | 326 | 8.1 | N/A | |
Majority | |||||
Turnout | 7,243 | 56.8 | |||
UKIP gain from Liberal Democrats | Swing | -23.0 | |||
Liberal Democrats hold | Swing | -23.0 | |||
Party | Candidate | Votes | % | ±% | |
---|---|---|---|---|---|
Conservative | Richard Cooper | 1,586 | 37.9 | -6.1 | |
Conservative | Jean Butterball | 1,551 | |||
Liberal Democrats | John Fox* | 1,539 | 36.8 | -13.0 | |
Liberal Democrats | James Monaghan | 1,330 | |||
UKIP | Adrian Ludbrook | 657 | 15.7 | N/A | |
UKIP | Gregory Peters | 634 | |||
Labour | Diane Maguire | 398 | 9.5 | +3.3 | |
Labour | Nicholas Knott | 360 | |||
Majority | |||||
Turnout | 8,055 | 59.0 | |||
Conservative gain from Liberal Democrats | Swing | +3.5 | |||
Party | Candidate | Votes | % | ±% | |
---|---|---|---|---|---|
Conservative | Jim Clark* | 1,300 | 51.6 | -9.4 | |
Liberal Democrats | Les Parkes | 606 | 24.1 | -14.7 | |
UKIP | Salvina Bashforth | 413 | 16.4 | N/A | |
Labour | Kevin McNerney | 200 | 7.9 | +4.7 | |
Majority | 694 | 27.5 | +2.3 | ||
Turnout | 2,519 | 37.7 | |||
Conservative hold | Swing | +2.7 | |||
Party | Candidate | Votes | % | ±% | |
---|---|---|---|---|---|
Conservative | John Ennis | 1,083 | 40.0 | -5.8 | |
Liberal Democrats | Peter Skardon | 988 | 36.5 | -14.3 | |
UKIP | Geoffrey Lumley | 432 | 15.9 | N/A | |
Labour | Helen Burke | 207 | 7.6 | +4.2 | |
Majority | |||||
Turnout | 41 | ||||
Conservative gain from Liberal Democrats | Swing | ||||
Party | Candidate | Votes | % | ±% | |
---|---|---|---|---|---|
Conservative | Don Mackenzie | 1050 | 50 | ||
UKIP | David Thompson | 404 | 19 | ||
Liberal Democrats | Gordon Charlton | 326 | 16 | ||
Labour | Janet Isabella | 165 | 8 | ||
Green | Shaun Lowry | 158 | 8 | ||
Rejected ballots | |||||
Majority | |||||
Turnout | 32 | ||||
Conservative hold | Swing | ||||
Party | Candidate | Votes | % | ±% | |
---|---|---|---|---|---|
Liberal Democrats | Margaret-Ann De Courcey-Bayley | 908 | 49 | ||
UKIP | Steven O'Neill | 403 | 22 | ||
Conservative | Benjamin Johnson | 310 | 17 | ||
Labour | Geoffrey Foxall | 214 | 12 | ||
Rejected ballots | |||||
Majority | |||||
Turnout | 28 | ||||
Liberal Democrats hold | Swing | ||||
Party | Candidate | Votes | % | ±% | |
---|---|---|---|---|---|
Liberal Democrats | Bill Hoult | 2084 | 23 | ||
Liberal Democrats | Anne Jones | 1861 | 20 | ||
Conservative | John Batt | 1219 | 13 | ||
Conservative | Phil Ireland | 1108 | 12 | ||
UKIP | Matthew Joy | 947 | 10 | ||
UKIP | David Rimington | 764 | 8 | ||
Labour | Lorraine Ferris | 399 | 4 | ||
Labour | Jan Williams | 376 | 4 | ||
Green | Gillian Charters | 330 | 4 | ||
Rejected ballots | |||||
Majority | |||||
Turnout | 37 | ||||
Liberal Democrats hold | Swing | ||||
Liberal Democrats gain from Conservative | Swing | ||||
Party | Candidate | Votes | % | ±% | |
---|---|---|---|---|---|
Conservative | |||||
Liberal Democrats | |||||
UKIP | |||||
Labour | |||||
Rejected ballots | |||||
Majority | |||||
Turnout | |||||
gain from | Swing | ||||
Party | Candidate | Votes | % | ±% | |
---|---|---|---|---|---|
Conservative | |||||
UKIP | |||||
Liberal Democrats | |||||
Labour | |||||
Rejected ballots | |||||
Majority | |||||
Turnout | |||||
gain from | Swing | ||||
Party | Candidate | Votes | % | ±% | |
---|---|---|---|---|---|
Conservative | |||||
Liberal Democrats | |||||
Labour | |||||
UKIP | |||||
Rejected ballots | |||||
Majority | |||||
Turnout | |||||
gain from | Swing | ||||
Party | Candidate | Votes | % | ±% | |
---|---|---|---|---|---|
Conservative | |||||
Liberal Democrats | |||||
UKIP | |||||
Labour | |||||
Rejected ballots | |||||
Majority | |||||
Turnout | |||||
gain from | Swing | ||||
Party | Candidate | Votes | % | ±% | |
---|---|---|---|---|---|
Conservative | |||||
Liberal Democrats | |||||
UKIP | |||||
Labour | |||||
Rejected ballots | |||||
Majority | |||||
Turnout | |||||
gain from | Swing | ||||
Party | Candidate | Votes | % | ±% | |
---|---|---|---|---|---|
Conservative | |||||
UKIP | |||||
Liberal Democrats | |||||
Labour | |||||
Rejected ballots | |||||
Majority | |||||
Turnout | |||||
gain from | Swing | ||||
Party | Candidate | Votes | % | ±% | |
---|---|---|---|---|---|
Conservative | |||||
Liberal Democrats | |||||
Labour | |||||
UKIP | |||||
Rejected ballots | |||||
Majority | |||||
Turnout | |||||
gain from | Swing | ||||
Party | Candidate | Votes | % | ±% | |
---|---|---|---|---|---|
Conservative | |||||
Liberal Democrats | |||||
Labour | |||||
UKIP | |||||
Rejected ballots | |||||
Majority | |||||
Turnout | |||||
gain from | Swing | ||||
Party | Candidate | Votes | % | ±% | |
---|---|---|---|---|---|
Conservative | |||||
Liberal Democrats | |||||
Labour | |||||
UKIP | |||||
Rejected ballots | |||||
Majority | |||||
Turnout | |||||
gain from | Swing | ||||
Party | Candidate | Votes | % | ±% | |
---|---|---|---|---|---|
Conservative | |||||
Liberal Democrats | |||||
Labour | |||||
UKIP | |||||
Rejected ballots | |||||
Majority | |||||
Turnout | |||||
gain from | Swing | ||||
Party | Candidate | Votes | % | ±% | |
---|---|---|---|---|---|
Conservative | |||||
Liberal Democrats | |||||
Labour | |||||
UKIP | |||||
Rejected ballots | |||||
Majority | |||||
Turnout | |||||
gain from | Swing | ||||
Party | Candidate | Votes | % | ±% | |
---|---|---|---|---|---|
Conservative | |||||
Liberal Democrats | |||||
Labour | |||||
UKIP | |||||
Rejected ballots | |||||
Majority | |||||
Turnout | |||||
gain from | Swing | ||||
Party | Candidate | Votes | % | ±% | |
---|---|---|---|---|---|
Conservative | |||||
Liberal Democrats | |||||
Labour | Sam Prest | ||||
UKIP | |||||
Rejected ballots | |||||
Majority | |||||
Turnout | |||||
gain from | Swing | ||||
Party | Candidate | Votes | % | ±% | |
---|---|---|---|---|---|
Conservative | |||||
Liberal Democrats | |||||
Labour | |||||
UKIP | |||||
Rejected ballots | |||||
Majority | |||||
Turnout | |||||
gain from | Swing | ||||
Party | Candidate | Votes | % | ±% | |
---|---|---|---|---|---|
Conservative | |||||
Liberal Democrats | |||||
Labour | Tim Prest | ||||
UKIP | |||||
Rejected ballots | |||||
Majority | |||||
Turnout | |||||
gain from | Swing | ||||
Party | Candidate | Votes | % | ±% | |
---|---|---|---|---|---|
Conservative | |||||
Liberal Democrats | |||||
Labour | |||||
UKIP | |||||
Rejected ballots | |||||
Majority | |||||
Turnout | |||||
gain from | Swing | ||||
Party | Candidate | Votes | % | ±% | |
---|---|---|---|---|---|
Conservative | |||||
Liberal Democrats | |||||
Labour | |||||
UKIP | |||||
Rejected ballots | |||||
Majority | |||||
Turnout | |||||
gain from | Swing | ||||
Party | Candidate | Votes | % | ±% | |
---|---|---|---|---|---|
Conservative | |||||
Liberal Democrats | |||||
Labour | |||||
UKIP | |||||
Rejected ballots | |||||
Majority | |||||
Turnout | |||||
gain from | Swing | ||||
Party | Candidate | Votes | % | ±% | |
---|---|---|---|---|---|
Conservative | |||||
Liberal Democrats | |||||
Labour | |||||
UKIP | |||||
Rejected ballots | |||||
Majority | |||||
Turnout | |||||
gain from | Swing | ||||
Party | Candidate | Votes | % | ±% | |
---|---|---|---|---|---|
Conservative | |||||
Liberal Democrats | |||||
Labour | |||||
UKIP | |||||
Rejected ballots | |||||
Majority | |||||
Turnout | |||||
gain from | Swing | ||||
Party | Candidate | Votes | % | ±% | |
---|---|---|---|---|---|
Conservative | |||||
Liberal Democrats | |||||
Labour | |||||
UKIP | |||||
Rejected ballots | |||||
Majority | |||||
Turnout | |||||
gain from | Swing | ||||
Party | Candidate | Votes | % | ±% | |
---|---|---|---|---|---|
Conservative | |||||
Liberal Democrats | |||||
Labour | |||||
UKIP | |||||
Rejected ballots | |||||
Majority | |||||
Turnout | |||||
gain from | Swing | ||||
Party | Candidate | Votes | % | ±% | |
---|---|---|---|---|---|
Conservative | |||||
Liberal Democrats | |||||
Labour | |||||
UKIP | |||||
Rejected ballots | |||||
Majority | |||||
Turnout | |||||
gain from | Swing | ||||
Party | Candidate | Votes | % | ±% | |
---|---|---|---|---|---|
Conservative | |||||
Liberal Democrats | |||||
Labour | |||||
UKIP | |||||
Rejected ballots | |||||
Majority | |||||
Turnout | |||||
gain from | Swing | ||||
Party | Candidate | Votes | % | ±% | |
---|---|---|---|---|---|
Conservative | |||||
Liberal Democrats | |||||
Labour | |||||
UKIP | |||||
Rejected ballots | |||||
Majority | |||||
Turnout | |||||
gain from | Swing | ||||
Party | Candidate | Votes | % | ±% | |
---|---|---|---|---|---|
Conservative | |||||
Liberal Democrats | |||||
Labour | |||||
UKIP | |||||
Rejected ballots | |||||
Majority | |||||
Turnout | |||||
gain from | Swing | ||||
Party | Candidate | Votes | % | ±% | |
---|---|---|---|---|---|
Conservative | |||||
Liberal Democrats | |||||
Labour | |||||
UKIP | |||||
Rejected ballots | |||||
Majority | |||||
Turnout | |||||
gain from | Swing | ||||
Party | Candidate | Votes | % | ±% | |
---|---|---|---|---|---|
Conservative | |||||
Liberal Democrats | |||||
Labour | |||||
UKIP | |||||
Rejected ballots | |||||
Majority | |||||
Turnout | |||||
gain from | Swing | ||||
Party | Candidate | Votes | % | ±% | |
---|---|---|---|---|---|
Conservative | |||||
Liberal Democrats | |||||
Labour | |||||
UKIP | |||||
Rejected ballots | |||||
Majority | |||||
Turnout | |||||
gain from | Swing | ||||
Party | Candidate | Votes | % | ±% | |
---|---|---|---|---|---|
Conservative | |||||
Liberal Democrats | |||||
Labour | |||||
UKIP | |||||
Rejected ballots | |||||
Majority | |||||
Turnout | |||||
gain from | Swing | ||||
Party | Candidate | Votes | % | ±% | |
---|---|---|---|---|---|
Conservative | |||||
Liberal Democrats | |||||
Labour | |||||
UKIP | |||||
Rejected ballots | |||||
Majority | |||||
Turnout | |||||
gain from | Swing | ||||
Party | Candidate | Votes | % | ±% | |
---|---|---|---|---|---|
Conservative | |||||
Liberal Democrats | |||||
Labour | |||||
UKIP | |||||
Rejected ballots | |||||
Majority | |||||
Turnout | |||||
gain from | Swing | ||||
Party | Candidate | Votes | % | ±% | |
---|---|---|---|---|---|
Conservative | Andrew Lee | 1041 | 67 | ||
Labour | Rosie Corrigan | 521 | 33 | ||
Turnout | 1562 | 29 | |||
Conservative hold | Swing | {{{swing}}} | |||
Party | Candidate | Votes | % | ±% | |
---|---|---|---|---|---|
Conservative | |||||
Liberal Democrats | |||||
Labour | |||||
UKIP | |||||
Rejected ballots | |||||
Majority | |||||
Turnout | |||||
gain from | Swing | ||||
Party | Candidate | Votes | % | ±% | |
---|---|---|---|---|---|
Conservative | |||||
Liberal Democrats | |||||
Labour | |||||
UKIP | |||||
Rejected ballots | |||||
Majority | |||||
Turnout | |||||
gain from | Swing | ||||
Party | Candidate | Votes | % | ±% | |
---|---|---|---|---|---|
Conservative | |||||
Liberal Democrats | |||||
Labour | |||||
UKIP | |||||
Rejected ballots | |||||
Majority | |||||
Turnout | |||||
gain from | Swing | ||||
Party | Candidate | Votes | % | ±% | |
---|---|---|---|---|---|
Conservative | |||||
Liberal Democrats | |||||
Labour | |||||
UKIP | |||||
Rejected ballots | |||||
Majority | |||||
Turnout | |||||
gain from | Swing | ||||
Party | Candidate | Votes | % | ±% | |
---|---|---|---|---|---|
Conservative | |||||
Liberal Democrats | |||||
Labour | |||||
UKIP | |||||
Rejected ballots | |||||
Majority | |||||
Turnout | |||||
gain from | Swing | ||||
Party | Candidate | Votes | % | ±% | |
---|---|---|---|---|---|
Conservative | |||||
Liberal Democrats | |||||
Labour | |||||
UKIP | |||||
Rejected ballots | |||||
Majority | |||||
Turnout | |||||
gain from | Swing | ||||
Party | Candidate | Votes | % | ±% | |
---|---|---|---|---|---|
Conservative | |||||
Liberal Democrats | |||||
Labour | |||||
UKIP | |||||
Rejected ballots | |||||
Majority | |||||
Turnout | |||||
gain from | Swing | ||||
Party | Candidate | Votes | % | ±% | |
---|---|---|---|---|---|
Conservative | |||||
Liberal Democrats | |||||
Labour | |||||
UKIP | |||||
Rejected ballots | |||||
Majority | |||||
Turnout | |||||
gain from | Swing | ||||
Party | Candidate | Votes | % | ±% | |
---|---|---|---|---|---|
Conservative | Mike Jordan | 592 | 37.0 | -3.2 | |
Labour | Rod Price | 525 | 32.8 | -1.6 | |
UKIP | Colin Heath | 282 | 17.6 | N/A | |
Independent | David McSherry | 201 | 12.6 | -5.7 | |
Majority | 67 | 4.2 | -1.6 | ||
Conservative hold | Swing | ||||
Elections to Suffolk County Council were held on 4 June 2009 as part of the 2009 United Kingdom local elections on the same day as the elections to the European Parliament. 75 councillors were elected from 63 electoral divisions, which returned either one or two county councillors each by first-past-the-post voting for a four-year term of office. The electoral divisions were the same as those used at the previous election in 2005.
An election to Cambridgeshire County Council took place on 4 June 2009 as part of the 2009 United Kingdom local elections. The election was delayed from 7 May to coincide with elections to the European Parliament. 69 councillors were elected from 60 electoral divisions, which returned either one or two county councillors each by first-past-the-post voting. The Conservative Party retained their majority on the council, while the Green Party and UKIP gained their first seats.
An election to Somerset County Council took place on 4 June 2009 as part of the 2009 United Kingdom local elections, having been delayed from 7 May, to coincide with elections to the European Parliament. The result brought to an end 16 years of Liberal Democrat rule to a Conservative controlled administration. 58 councillors were elected from various electoral divisions, which returned one county councillor each. Members were elected by the first-past-the-post voting system for a four-year term of office. This was the last election before the number of seats was cut to 55 for the 2013 election. With a total of 58 seats being reduced to 55 for the next election.
Elections to Staffordshire County Council took place on 4 June 2009 as part of the 2009 United Kingdom local elections, having been delayed from 7 May, in order to coincide with elections to the European Parliament. 62 councillors were elected from the various electoral divisions, which returned either one or two county councillors each by first-past-the-post voting for a four-year term of office. The electoral divisions were the same as those used at the previous election in 2005. The council continues to be administered on the Leader and Cabinet model.
An election to Devon County Council took place on 7 May 2009 as part of the 2009 United Kingdom local elections. The elections had been delayed from 7 May, to coincide with elections to the European Parliament. 62 councillors were elected from various electoral divisions, which returned either one or two county councillors each by first-past-the-post voting for a four-year term of office. The electoral divisions were the same as those used at the previous election in 2005. No elections were held in Plymouth and Torbay, which are unitary authorities outside the area covered by the County Council.
An election to Cumbria County Council took place on 2 May 2013 as part of the 2013 United Kingdom local elections. All 84 councillors were elected from electoral divisions which returned one county councillor each by first-past-the-post voting for a four-year term of office. Following an electoral review carried out by the Local Government Boundary Commission for England, newly drawn electoral divisions were used without change in the number of county councillors.
An election to Leicestershire County Council took place on 2 May 2013 as part of the 2013 United Kingdom local elections. 55 councillors were elected from 52 electoral divisions, which returned either one or two county councillors each by first-past-the-post voting for a four-year term of office. The Conservatives held control of the council with a reduced majority of 5 seats. Despite a strong challenge from UKIP, the party only gained 2 seats whilst the Liberal Democrats lost one seat and Labour recouped some of their 2009 losses, gaining 6 seats.
The West Sussex County Council election, 2013 took place on 2 May 2013, as part of the 2013 United Kingdom local elections. All 71 electoral divisions were up for election, which returned one county councillor each by first-past-the-post voting for a four-year term of office. At this election, the Conservative Party was seeking to retain overall control of the council, and the Liberal Democrats to maintain their position as the main opposition party.
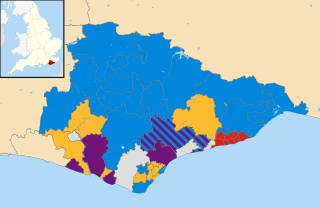
The East Sussex County Council election, 2013 took place on 2 May 2013 as part of the 2013 United Kingdom local elections. All 49 councillors of East Sussex County Council were elected from 44 electoral divisions, which return either one or two councillors each by first-past-the-post voting for a four-year term of office. The electoral divisions were the same as those used at the previous election in 2009. No elections were held in Brighton and Hove, which is a unitary authority outside the area covered by the County Council.
An election to Hampshire County Council took place on 2 May 2013 as part of the 2013 United Kingdom local elections. 78 councillors were elected from 75 electoral divisions, which returned either one or two county councillors each by first-past-the-post voting for a four-year term of office. The electoral divisions were the same as those of the previous election in 2009. No elections were held in Portsmouth and Southampton, which are unitary authorities outside the area covered by the County Council. The election saw the Conservative Party retain overall control of the council, with a reduced majority of five councillors.
An election to Worcestershire County Council took place on 2 May 2013 as part of the 2013 United Kingdom local elections. 57 councillors were elected from 53 electoral divisions, which returned either one or two county councillors each by first-past-the-post voting for a four-year term of office. The divisions were the same as those used at the previous election in 2009. The election saw the Conservative Party retain overall control of the council with a significantly reduced majority of just 2 seats.
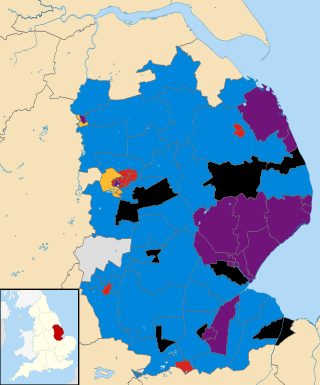
An election to Lincolnshire County Council took place on 2 May 2013 as part of the 2013 United Kingdom local elections. 77 electoral divisions returned one county councillor each by first-past-the-post voting for a four-year term of office. The electoral divisions were the same as those used at the previous election in 2009. No elections were held in North Lincolnshire or North East Lincolnshire, which are unitary authorities outside the area covered by the County Council.
Elections to Gloucestershire County Council took place on 2 May 2013 as part of the 2013 United Kingdom local elections. 53 electoral divisions elected one county councillor each by first-past-the-post voting for a four-year term of office. No elections were held in South Gloucestershire, which is a unitary authority outside the area covered by the County Council.
An election to Staffordshire County Council took place on 2 May 2013 as part of the 2013 United Kingdom local elections. 62 electoral divisions returned one county councillor each by first-past-the-post voting for a four-year term of office. Following a boundary review, new electoral division boundaries were established for this election. No elections were held in Stoke-on-Trent, which is a unitary authority outside the area covered by the County Council. The council continues to be administered on the Leader and Cabinet model.
An election to Dorset County Council took place on 2 May 2013 as part of the United Kingdom local elections. 45 councillors were elected from 42 electoral divisions, which returned either one or two county councillors each by first-past-the-post voting for a four-year term of office. The electoral divisions were the same as those used at the previous election in 2009. No elections were held in Bournemouth or Poole, which are unitary authorities outside the area covered by the County Council. The election saw the Conservative Party maintain overall control of the council.
Elections to Suffolk County Council took place on 2 May 2013 as part of the 2013 United Kingdom local elections. 75 councillors were elected from 63 electoral divisions, which returned either one or two county councillors each by first-past-the-post voting for a four-year term of office. The electoral divisions were the same as those used at the previous election in 2009.
An election to Northamptonshire County Council took place on 2 May 2013 as part of the 2013 United Kingdom local elections. Following a boundary review, the number of county councillors was reduced from 73 to 57 from this election. All members were elected by first-past-the-post voting from single-member electoral divisions for a four-year term of office. The Conservative Party held on to their overall majority, having held overall control of the council since 2005.
Elections to Harrogate Borough Council were held on 22 May 2014. A third of the council was up for election, with voting only in the urban wards of Harrogate, Knaresborough and Ripon. The elections were held on the same day as the British local elections and the European Parliament elections. Each ward up for election returned a councillor for a four-year term of office.
The 2017 Gloucestershire County Council election took place on 4 May 2017 as part of the 2017 local elections in the United Kingdom. All 53 councillors were elected from electoral divisions which returned one county councillor each by first-past-the-post voting for a four-year term of office. Control of the council went from a Conservative Party minority to a majority administration.
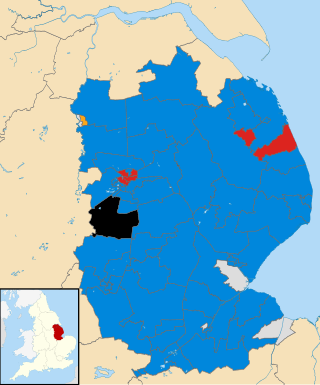
The 2022 North Yorkshire Council election took place on 5 May 2022, alongside the other local elections. These were the last elections to North Yorkshire County Council, and the elected councillors would also serve as the first councillors on the North Yorkshire Council, which replaced the existing county council in April 2023.