![]() | |||||||||||||||||||||||||||||||||||||||||
| |||||||||||||||||||||||||||||||||||||||||
15 out of 45 seats to York City Council 23 seats needed for a majority | |||||||||||||||||||||||||||||||||||||||||
---|---|---|---|---|---|---|---|---|---|---|---|---|---|---|---|---|---|---|---|---|---|---|---|---|---|---|---|---|---|---|---|---|---|---|---|---|---|---|---|---|---|
Turnout | 52.7% (![]() | ||||||||||||||||||||||||||||||||||||||||
| |||||||||||||||||||||||||||||||||||||||||
![]() Winner of each seat at the 1987 York City Council election | |||||||||||||||||||||||||||||||||||||||||
|
The 1987 York City Council election took place on 7 May 1987 to elect members of York City Council in North Yorkshire, England. [1] This was on the same day as other local elections.
1987 York City Council election | ||||||||||
---|---|---|---|---|---|---|---|---|---|---|
Party | This election | Full council | This election | |||||||
Seats | Net | Seats % | Other | Total | Total % | Votes | Votes % | +/− | ||
Labour | 6 | ![]() | 40.0 | 20 | 26 | 57.8 | 16,171 | 38.7 | –4.4 | |
Conservative | 7 | ![]() | 46.7 | 5 | 12 | 26.7 | 15,741 | 37.7 | +6.8 | |
Alliance | 2 | ![]() | 13.3 | 5 | 7 | 15.6 | 9,499 | 22.8 | –2.6 | |
Green | 0 | ![]() | 0.0 | 0 | 0 | 0.0 | 330 | 0.8 | +0.3 |
Party | Candidate | Votes | % | ±% | |
---|---|---|---|---|---|
Labour | M. Bond | 1,183 | 43.3 | –3.8 | |
Conservative | I. Binner* | 1,103 | 40.4 | +8.5 | |
Alliance | B. Eales | 445 | 16.3 | –0.7 | |
Majority | 80 | 2.9 | –12.3 | ||
Turnout | 2,731 | 51.6 | +3.1 | ||
Registered electors | 5,290 | ||||
Labour gain from Conservative | Swing | ![]() |
Party | Candidate | Votes | % | ±% | |
---|---|---|---|---|---|
Conservative | P. Brown* | 1,470 | 49.2 | +14.3 | |
Labour | D. Roberts | 1,035 | 34.6 | –5.6 | |
Alliance | K. Harper | 485 | 16.2 | –8.7 | |
Majority | 435 | 14.5 | N/A | ||
Turnout | 2,990 | 56.8 | +5.8 | ||
Registered electors | 5,264 | ||||
Conservative hold | Swing | ![]() |
Party | Candidate | Votes | % | ±% | |
---|---|---|---|---|---|
Labour | C. Wallace | 1,105 | 46.7 | –6.0 | |
Conservative | R. Youngson | 892 | 37.7 | +6.3 | |
Alliance | J. Talbot | 370 | 15.6 | –0.3 | |
Majority | 213 | 9.0 | –12.3 | ||
Turnout | 2,367 | 50.7 | +4.4 | ||
Registered electors | 4,668 | ||||
Labour hold | Swing | ![]() |
Party | Candidate | Votes | % | ±% | |
---|---|---|---|---|---|
Labour | K. Cooper* | 1,424 | 63.5 | –2.2 | |
Conservative | A. Reeson | 573 | 25.5 | +5.1 | |
Alliance | J. Dales | 247 | 11.0 | –2.9 | |
Majority | 851 | 37.9 | –7.4 | ||
Turnout | 2,244 | 43.8 | +2.5 | ||
Registered electors | 5,118 | ||||
Labour hold | Swing | ![]() |
Party | Candidate | Votes | % | ±% | |
---|---|---|---|---|---|
Conservative | A. Bond | 1,191 | 43.0 | +5.9 | |
Labour | J. Cockerill | 1,168 | 42.2 | –2.7 | |
Alliance | S. Gildener | 410 | 14.8 | –3.2 | |
Majority | 23 | 0.8 | N/A | ||
Turnout | 2,769 | 52.4 | +3.4 | ||
Registered electors | 5,288 | ||||
Conservative gain from Labour | Swing | ![]() |
Party | Candidate | Votes | % | ±% | |
---|---|---|---|---|---|
Conservative | M. Bwye* | 1,287 | 44.0 | +5.2 | |
Labour | J. Bird | 1,172 | 40.1 | –5.5 | |
Alliance | V. Campbell | 464 | 15.9 | +0.3 | |
Majority | 115 | 3.9 | N/A | ||
Turnout | 2,923 | 54.3 | +1.4 | ||
Registered electors | 5,379 | ||||
Conservative hold | Swing | ![]() |
Party | Candidate | Votes | % | ±% | |
---|---|---|---|---|---|
Alliance | S. Galloway* | 1,934 | 60.6 | +0.7 | |
Conservative | D. Goldthorpe | 652 | 20.4 | +2.2 | |
Labour | B. Walker | 520 | 16.3 | –5.6 | |
Green | J. Forrester | 88 | 2.8 | N/A | |
Majority | 1,282 | 40.1 | +2.1 | ||
Turnout | 3,194 | 48.2 | +6.5 | ||
Registered electors | 6,626 | ||||
Alliance hold | Swing | ![]() |
Party | Candidate | Votes | % | ±% | |
---|---|---|---|---|---|
Labour | A. Moxon* | 1,305 | 48.2 | –1.0 | |
Conservative | E. Beavan | 990 | 36.5 | +3.4 | |
Alliance | P. Gildener | 415 | 15.3 | –2.4 | |
Majority | 315 | 11.6 | –4.5 | ||
Turnout | 2,710 | 49.3 | +4.9 | ||
Registered electors | 5,499 | ||||
Labour hold | Swing | ![]() |
Party | Candidate | Votes | % | ±% | |
---|---|---|---|---|---|
Conservative | K. Wood* | 1,307 | 44.7 | +14.4 | |
Labour | P. Kind | 1,159 | 39.7 | –0.9 | |
Alliance | N. McIlveen | 457 | 15.6 | –13.4 | |
Majority | 148 | 5.1 | N/A | ||
Turnout | 2,923 | 55.1 | +2.4 | ||
Registered electors | 5,307 | ||||
Conservative hold | Swing | ![]() |
Party | Candidate | Votes | % | ±% | |
---|---|---|---|---|---|
Labour | J. Archer* | 1,396 | 51.2 | –2.3 | |
Conservative | R. Dickson | 972 | 35.7 | +7.2 | |
Alliance | D. Wilson | 358 | 13.1 | –4.9 | |
Majority | 424 | 15.6 | –9.3 | ||
Turnout | 2,726 | 51.9 | +7.3 | ||
Registered electors | 5,253 | ||||
Labour hold | Swing | ![]() |
Party | Candidate | Votes | % | ±% | |
---|---|---|---|---|---|
Conservative | J. Hargrave* | 1,239 | 43.1 | +3.9 | |
Labour | V. Fry | 1,135 | 39.5 | –7.9 | |
Alliance | D. Hagyard | 355 | 12.4 | –0.9 | |
Green | J. McCallum | 145 | 5.0 | N/A | |
Majority | 104 | 3.6 | N/A | ||
Turnout | 2,874 | 56.5 | +4.5 | ||
Registered electors | 5,086 | ||||
Conservative hold | Swing | ![]() |
Party | Candidate | Votes | % | ±% | |
---|---|---|---|---|---|
Conservative | M. Bartram | 1,462 | 48.8 | +5.6 | |
Labour | R. Dick | 918 | 30.6 | +0.5 | |
Alliance | J. Hornsby | 520 | 17.4 | –9.3 | |
Green | R. Bell | 97 | 3.2 | N/A | |
Majority | 544 | 18.2 | +5.1 | ||
Turnout | 2,997 | 58.2 | –0.5 | ||
Registered electors | 5,153 | ||||
Conservative hold | Swing | ![]() |
Party | Candidate | Votes | % | ±% | |
---|---|---|---|---|---|
Conservative | J. Clout* | 1,395 | 44.3 | +12.2 | |
Alliance | A. Cormack | 1,138 | 36.2 | –0.5 | |
Labour | M. Iqbal | 613 | 19.5 | –11.7 | |
Majority | 257 | 8.2 | N/A | ||
Turnout | 3,146 | 59.4 | +5.0 | ||
Registered electors | 5,297 | ||||
Conservative hold | Swing | ![]() |
Party | Candidate | Votes | % | ±% | |
---|---|---|---|---|---|
Labour | F. Thistleton* | 1,134 | 46.5 | –5.2 | |
Conservative | D. Thornton | 857 | 35.1 | +8.8 | |
Alliance | J. Salmon | 449 | 18.4 | –0.2 | |
Majority | 277 | 11.4 | –14.0 | ||
Turnout | 2,440 | 47.2 | +6.5 | ||
Registered electors | 5,174 | ||||
Labour hold | Swing | ![]() |
Party | Candidate | Votes | % | ±% | |
---|---|---|---|---|---|
Alliance | S. Galloway* | 1,452 | 53.6 | +5.6 | |
Labour | C. Jackson | 904 | 33.4 | –4.4 | |
Conservative | A. Potter | 351 | 13.0 | +1.7 | |
Majority | 548 | 20.2 | +8.5 | ||
Turnout | 2,707 | 55.9 | +6.7 | ||
Registered electors | 4,840 | ||||
Alliance hold | Swing | ![]() |
The Municipality of Metropolitan Toronto was an upper-tier level of municipal government in Ontario, Canada, from 1953 to 1998. It was made up of the old city of Toronto and numerous townships, towns and villages that surrounded Toronto, which were starting to urbanize rapidly after World War II. It was commonly referred to as "Metro Toronto" or "Metro".
Fernando James Ferrer is an American politician who was the borough president of The Bronx from 1987 to 2001. Ferrer was a candidate for mayor of New York City in 1997 and 2001 and was the Democratic Party nominee for mayor in 2005, when he was defeated by Michael Bloomberg. Ferrer served on the New York City Council in the 1980s and has served as chairman and vice chairman of the Metropolitan Transportation Authority.
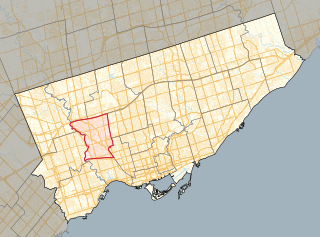
York South—Weston is a federal electoral district in Ontario, Canada, that has been represented in the House of Commons of Canada since 1979.
The New York City Council is the lawmaking body of New York City in the United States. It has 51 members from 51 council districts throughout the five boroughs.
Adam G. Vaughan is a Canadian politician who served as a Member of Parliament (MP) from 2014 until 2021. Vaughan represented the Toronto area riding of Spadina—Fort York as a member of the Liberal Party. He previously sat on Toronto City Council, representing Ward 20 Trinity—Spadina from 2006 until he resigned in 2014 to run in a federal by-election for Trinity—Spadina.
Elections to City of York Council were held on 6 May 1999. All 53 council seats in the city were up for election and the Labour Party kept overall control of the council.
Elections to City of York Council were held in 2003. The whole council was up for election. Boundary changes had reduced the number of seats from 53 to 47.
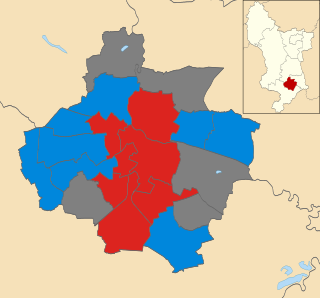
Local elections for City of York Council were held on Thursday 3 May 2007. The whole council was up for election. Of the 47 seats contested, the Liberal Democrats won 19 seats, Labour won 18 seats, Conservatives won eight seats and the Green Party won two seats. The election saw York's ruling Liberal Democrats lose ten seats and overall control of the council.
The Boston mayoral election of 1987 occurred on Tuesday, November 3, 1987, between Mayor Raymond Flynn and City Council member Joseph M. Tierney. Flynn was re-elected to his second term.
The Chicago mayoral election of 1987 saw the re-election of incumbent Democrat Harold Washington. Partisan primaries were held on February 24, followed by the general election on April 7, 1987. Washington defeated Ed Vrdolyak, the leader of the Vrdolyak 29, who ran on the Illinois Solidarity Party ticket. Former mayor Jane Byrne unsuccessfully challenged Washington in the Democratic primary.
The 2015 City of York Council election took place on 7 May 2015 to elect members of City of York Council in England. The whole council was up for election. Turnout was substantially up across the city due to the election being held on the same day as the general election and other local elections in England.
Elections to the new City of York unitary authority were held on 4 May 1995, although the new unitary authority wasn't officially created until April 1996. All 53 council seats in the city were up for election and the Labour Party won overall control of the council.
Boston City Council elections were held on November 3, 1987. Eleven seats were contested in the general election, as the incumbents in districts 3 and 6 were unopposed. Seven seats had also been contested in the preliminary election held on September 22, 1987.
Elections to City of York Council were held on 2 May 2019, as part of the United Kingdom local elections. The election resulted in substantial gains for the Liberal Democrats, who became the largest party, although no party surpassed the 24-seat majority threshold. The Conservatives suffered badly in this election, and lost 12 of the 14 seats they had won at the previous election. The Green Party held all their four seats, and surpassed the Conservatives in the popular vote. Labour gained two seats, although they failed to gain support in rural areas, where voters favoured the Liberal Democrats. On 14 May, The Liberal Democrats and the Green Party announced that they had agreed to run the council in a new 'progressive partnership' coalition, with Green Party leader Andy D'Agorne assuming the role of Deputy Leader of the Council while Liberal Democrat leader Keith Aspden succeeded Ian Gillies as Leader of the Council.
The 1991 Philadelphia mayoral election saw the election of Democrat Ed Rendell.
The 1987 Derby City Council election took place on 7 May 1987 to elect members of Derby City Council in England. Local elections were held in the United Kingdom in 1987. This was on the same day as other local elections. 15 of the council's 44 seats were up for election. The Labour Party retained control of the council.
Kevin Christopher Riley is an American politician. A Democrat, he serves as the New York City Councilmember for the 12th district. The district includes Wakefield, Olinville, Edenwald, Eastchester, Williamsbridge, Baychester, Co-op City in The Bronx.
Elections are held every two years to elect the mayor of Worcester, Massachusetts.
David Carr is an American politician serving as Council Member for the 50th Council District of the New York City Council. He is a Republican, and the Council Minority Leader.