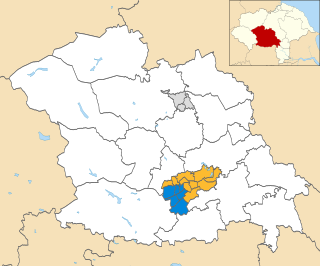
The 2003 Harrogate Council election took place on 1 May 2003 to elect members of Harrogate Borough Council in North Yorkshire, England. One third of the council was up for election and the council stayed under no overall control. [1]
After the election, the composition of the council was:
Before the election the Liberal Democrats had 27 seats on the council, the Conservatives 26 and there was 1 independent. [3] The campaign saw the national leaders of the Conservative and Liberal Democrat parties, Iain Duncan Smith and Charles Kennedy, visit Harrogate to support their parties. [4]
The Liberal Democrats defended their record in control of the council, pointing to an improvement in the council finances, providing new facilities for the area, keeping Harrogates portion of the council tax rises low and tackling anti-social behaviour. [5] However the Conservatives attacked "over intensive housing development" for causing traffic congestion, said they were the only party opposed to congestion charging, proposed to provide an hours free parking for residents and to work with police to tackle anti-social behaviour. [5]
The results saw no party win a majority on the council, but the Conservatives became the largest party with 27 seats, compared to 25 for the Liberal Democrats and 2 independents. [3] [6] The Conservatives gained Bilton and High Harrogate wards from the Liberal Democrats, the latter by 656 votes to 610 after a recount. [7] These gains came despite the Liberal Democrats winning slightly more votes overall in the election, 46.5% compared to 44.7% for the Conservatives. [3] However the Conservatives did lose one seat in Ripon Moorside, which was taken by independent Charles Powell. [7] Meanwhile, Labour failed to win any seats and only came second in Woodfield ward. [7] Overall turnout in the election was 34.7%. [3]
Following the election the Conservatives took control of the council, with Conservative Mike Gardner becoming council leader, replacing Liberal Democrat Geoff Webber. [3] Meanwhile, the outgoing mayor of Harrogate Alan Skidmore quit the Liberal Democrats after the election to become an independent, criticising the party both nationally and locally. [8]
Party | Seats | Gains | Losses | Net gain/loss | Seats % | Votes % | Votes | +/− | |
---|---|---|---|---|---|---|---|---|---|
Liberal Democrats | 10 | 0 | 2 | -2 | 52.6 | 46.5 | 12,557 | +0.2% | |
Conservative | 8 | 2 | 1 | +1 | 42.1 | 44.7 | 12,079 | -0.3% | |
Independent | 1 | 1 | 0 | +1 | 5.3 | 4.0 | 1,077 | +1.1% | |
Labour | 0 | 0 | 0 | 0 | 0 | 4.9 | 1,314 | -0.9% | |
Party | Candidate | Votes | % | ±% | |
---|---|---|---|---|---|
Conservative | Robin Adderley | 864 | 50.8 | ||
Liberal Democrats | Morris Lightfoot | 770 | 45.3 | ||
Labour | Norman Dobell | 66 | 3.9 | ||
Majority | 94 | 5.5 | |||
Turnout | 1,700 | 40.8 | +2.3 | ||
Conservative gain from Liberal Democrats | Swing | ||||
Party | Candidate | Votes | % | ±% | |
---|---|---|---|---|---|
Liberal Democrats | Margaret-Ann De Courcey-Bayley | 683 | 66.2 | ||
Conservative | Paul Needham | 261 | 25.3 | ||
Labour | David King | 87 | 8.4 | ||
Majority | 422 | 40.9 | |||
Turnout | 1,031 | 23.8 | −2.7 | ||
Liberal Democrats hold | Swing | ||||
Party | Candidate | Votes | % | ±% | |
---|---|---|---|---|---|
Conservative | Simon Theakston | 1,040 | 64.4 | ||
Liberal Democrats | Michael Kaye | 504 | 31.2 | ||
Labour | Christopher France | 71 | 4.4 | ||
Majority | 536 | 33.2 | |||
Turnout | 1,615 | 38.6 | −7.4 | ||
Conservative hold | Swing | ||||
Party | Candidate | Votes | % | ±% | |
---|---|---|---|---|---|
Conservative | Andrew Jones | 656 | 48.6 | ||
Liberal Democrats | Matthew Webber | 610 | 45.2 | ||
Labour | Eric Cunningham | 83 | 6.2 | ||
Majority | 46 | 3.4 | |||
Turnout | 1,349 | 32.1 | +4.0 | ||
Conservative gain from Liberal Democrats | Swing | ||||
Party | Candidate | Votes | % | ±% | |
---|---|---|---|---|---|
Liberal Democrats | Reginald Marsh | 945 | 56.4 | ||
Conservative | Michael Laycock | 671 | 40.0 | ||
Labour | Robert Swithinbank | 60 | 3.6 | ||
Majority | 274 | 16.3 | |||
Turnout | 1,676 | 38.8 | −2.8 | ||
Liberal Democrats hold | Swing | ||||
Party | Candidate | Votes | % | ±% | |
---|---|---|---|---|---|
Liberal Democrats | Keith Rothwell | 677 | 61.9 | ||
Conservative | Malcolm Jackson | 416 | 38.1 | ||
Majority | 261 | 23.9 | |||
Turnout | 1,093 | 28.7 | −5.5 | ||
Liberal Democrats hold | Swing | ||||
Party | Candidate | Votes | % | ±% | |
---|---|---|---|---|---|
Conservative | Diana Smith | 751 | 47.9 | ||
Liberal Democrats | Richard Hall | 719 | 45.9 | ||
Labour | Simon Hutchings | 97 | 6.2 | ||
Majority | 32 | 2.0 | |||
Turnout | 1,567 | 40.9 | −1.6 | ||
Conservative hold | Swing | ||||
Party | Candidate | Votes | % | ±% | |
---|---|---|---|---|---|
Liberal Democrats | Kevin Hawkins | 530 | 37.4 | ||
Conservative | Robert Aspin | 516 | 36.4 | ||
Independent | Andrew Wright | 373 | 26.3 | ||
Majority | 14 | 1.0 | |||
Turnout | 1,419 | 37.1 | −0.5 | ||
Liberal Democrats hold | Swing | ||||
Party | Candidate | Votes | % | ±% | |
---|---|---|---|---|---|
Conservative | Jean Butterfield | 835 | 65.5 | ||
Liberal Democrats | Michael Paszkowski | 371 | 29.1 | ||
Labour | Christine Colman | 69 | 5.4 | ||
Majority | 464 | 36.4 | |||
Turnout | 1,275 | 30.9 | −5.7 | ||
Conservative hold | Swing | ||||
Party | Candidate | Votes | % | ±% | |
---|---|---|---|---|---|
Liberal Democrats | Wendy Richards | 692 | 65.7 | ||
Conservative | David Pearson | 283 | 26.9 | ||
Labour | Mark France | 79 | 7.5 | ||
Majority | 409 | 38.8 | |||
Turnout | 1,054 | 26.5 | −1.2 | ||
Liberal Democrats hold | Swing | ||||
Party | Candidate | Votes | % | ±% | |
---|---|---|---|---|---|
Conservative | Michael Gardner | 1,287 | 64.0 | ||
Liberal Democrats | Yvonne Jones | 649 | 32.3 | ||
Labour | Cynthia Coltman | 76 | 3.8 | ||
Majority | 638 | 31.7 | |||
Turnout | 2,012 | 46.9 | −7.3 | ||
Conservative hold | Swing | ||||
Party | Candidate | Votes | % | ±% | |
---|---|---|---|---|---|
Liberal Democrats | Sidney Hawke | 751 | 68.0 | ||
Conservative | Andrew Collyer | 354 | 32.0 | ||
Majority | 397 | 35.9 | |||
Turnout | 1,105 | 29.1 | +1.7 | ||
Liberal Democrats hold | Swing | ||||
Party | Candidate | Votes | % | ±% | |
---|---|---|---|---|---|
Independent | Charles Powell | 704 | 51.5 | ||
Conservative | Anthony Simpson | 361 | 26.4 | ||
Liberal Democrats | Stephen Jones | 303 | 22.1 | ||
Majority | 343 | 25.1 | |||
Turnout | 1,368 | 35.8 | −3.1 | ||
Independent gain from Conservative | Swing | ||||
Party | Candidate | Votes | % | ±% | |
---|---|---|---|---|---|
Liberal Democrats | Paul Freeman | 683 | 53.2 | ||
Conservative | Rosemarie Curlewis | 602 | 46.8 | ||
Majority | 81 | 6.3 | |||
Turnout | 1,285 | 34.8 | −4.1 | ||
Liberal Democrats hold | Swing | ||||
Party | Candidate | Votes | % | ±% | |
---|---|---|---|---|---|
Conservative | James Clark | 1,170 | 57.5 | ||
Liberal Democrats | Leslie Parkes | 799 | 39.3 | ||
Labour | Deborah Havercroft | 66 | 3.2 | ||
Majority | 371 | 18.2 | |||
Turnout | 2,035 | 45.8 | +0.8 | ||
Conservative hold | Swing | ||||
Party | Candidate | Votes | % | ±% | |
---|---|---|---|---|---|
Liberal Democrats | Geoffrey Webber | 593 | 53.2 | ||
Conservative | Michael Harrison | 521 | 46.8 | ||
Majority | 72 | 6.5 | |||
Turnout | 1,114 | 26.3 | +1.5 | ||
Liberal Democrats hold | Swing | ||||
Party | Candidate | Votes | % | ±% | |
---|---|---|---|---|---|
Liberal Democrats | Granville Ward | 752 | 68.1 | ||
Conservative | Phillip Dixon | 242 | 21.9 | ||
Labour | Patricia Foxall | 111 | 10.0 | ||
Majority | 510 | 46.2 | |||
Turnout | 1,105 | 26.3 | −3.4 | ||
Liberal Democrats hold | Swing | ||||
Party | Candidate | Votes | % | ±% | |
---|---|---|---|---|---|
Conservative | Patricia Jones | 1,030 | 52.6 | ||
Liberal Democrats | Claudia Hartley | 869 | 44.4 | ||
Labour | Roger Newby | 59 | 3.0 | ||
Majority | 161 | 8.2 | |||
Turnout | 1,958 | 46.3 | −1.3 | ||
Conservative hold | Swing | ||||
Party | Candidate | Votes | % | ±% | |
---|---|---|---|---|---|
Liberal Democrats | John Wren | 657 | 51.9 | ||
Labour | Peter Caunt | 390 | 30.8 | ||
Conservative | Denis Muldoon | 219 | 17.3 | ||
Majority | 267 | 21.1 | |||
Turnout | 1,266 | 30.8 | −4.2 | ||
Liberal Democrats hold | Swing | ||||
The 1998 Solihull Metropolitan Borough Council election took place on 7 May 1998 to elect members of Solihull Metropolitan Borough Council in the West Midlands, England. One third of the council was up for election and the council stayed under no overall control.
The 2006 Colchester Borough Council election took place on 4 May 2006 to elect members of Colchester Borough Council in Essex, England. One third of the council was up for election and the council stayed under no overall control.
The 1998 Tunbridge Wells Borough Council election took place on 7 May 1998 to elect members of Tunbridge Wells Borough Council in Kent, England. One third of the council was up for election and the Conservative party gained overall control of the council from no overall control.
The 2003 Redditch Borough Council election took place on 1 May 2003 to elect members of Redditch Borough Council in the West Midlands region, England. One third of the council was up for election and the council stayed under no overall control.
The 2008 Solihull Metropolitan Borough Council election took place on 1 May 2008 to elect members of Solihull Metropolitan Borough Council in the West Midlands, England. One third of the council was up for election and the Conservative Party gained overall control of the council from no overall control.
The 2002 Wokingham District Council election took place on 2 May 2002 to elect members of Wokingham Unitary Council in Berkshire, England. One third of the council was up for election and the Conservative party gained overall control of the council from no overall control.
The 2006 Southend-on-Sea Council election took place on 4 May 2006 to elect members of Southend-on-Sea Unitary Council in Essex, England. One third of the council was up for election and the Conservative party stayed in overall control of the council.
The 2008 Rushmoor Council election took place on 1 May 2008 to elect members of Rushmoor Borough Council in Hampshire, England. One third of the council was up for election and the Conservative Party stayed in overall control of the council.
The 2007 Solihull Metropolitan Borough Council election took place on 4 May 2007 to elect members of Solihull Metropolitan Borough Council in the West Midlands, England. One third of the council was up for election and the Conservative Party lost overall control of the council to no overall control.
The 2002 Harrogate Council election took place on 2 May 2002 to elect members of Harrogate Borough Council in North Yorkshire, England. The whole council was up for election with boundary changes since the last election in 2000 reducing the number of seats by 5. The Liberal Democrats lost overall control of the council to no overall control.
The 2004 Harrogate Council election took place on 10 June 2004 to elect members of Harrogate Borough Council in North Yorkshire, England. One third of the council was up for election and the Conservative Party stayed in overall control of the council.
The 2006 Harrogate Council election took place on 4 May 2006 to elect members of Harrogate Borough Council in North Yorkshire, England. One third of the council was up for election and the Conservative party lost overall control of the council to no overall control.
The 2007 Harrogate Council election took place on 3 May 2007 to elect members of Harrogate Borough Council in North Yorkshire, England. One third of the council was up for election and the council stayed under no overall control.
The 2008 Harrogate Council election took place on 1 May 2008 to elect members of Harrogate Borough Council in North Yorkshire, England. One third of the council was up for election and the council stayed under no overall control.
The 2010 Harrogate Council election took place on 6 May 2010 to elect members of Harrogate Borough Council in North Yorkshire, England. One third of the council was up for election and the Conservative party gained overall control of the council from no overall control.
The 1998 Pendle Borough Council election took place on 7 May 1998 to elect members of Pendle Borough Council in Lancashire, England. One third of the council was up for election and the Liberal Democrats stayed in overall control of the council.
The 2008 Maidstone Borough Council election took place on 1 May 2008 to elect members of Maidstone Borough Council in Kent, England. One third of the council was up for election and the Conservative Party gained overall control of the council from no overall control.
The 2011 Wokingham Borough Council election took place on 5 May 2011 to elect members of Wokingham Unitary Council in Berkshire, England. One third of the council was up for election and the Conservative Party stayed in overall control of the council.
The 2008 Colchester Borough Council election took place on 1 May 2008 to elect members of Colchester Borough Council in Essex, England. One third of the council was up for election and the Conservative party lost overall control of the council to no overall control.
The 2012 Craven District Council election took place on 3 May 2012 to elect members of Craven District Council in North Yorkshire, England. One third of the council was up for election and the Conservative party stayed in overall control of the council.