Results maps
 2003 results map
 2007 results map
 2011 results map
 2015 results map
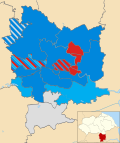 2019 results map
Selby District Council was the local authority for the district of Selby in North Yorkshire, England, from 1974 to 2023. It was elected every four years.
The first election to the council was held in 1973, initially operating as a shadow authority alongside the outgoing authorities until it came into its powers on 1 April 1974. Political control from 1974 until its abolition in 2023 was as follows: [1]
| Party in control | Years | |
|---|---|---|
| No overall control | 1974–1979 | |
| Conservative | 1979–1991 | |
| No overall control | 1991–1995 | |
| Labour | 1995–1999 | |
| No overall control | 1999–2003 | |
| Conservative | 2003–2023 | |
The leaders of the council from 2003 until the council's abolition were:
| Councillor | Party | From | To | |
|---|---|---|---|---|
| Dean Howson [2] | Labour | May 2003 | ||
| Mark Crane [3] [4] | Conservative | May 2003 | Mar 2023 | |
Other leaders included Conservative councillor Arthur Cawood in the early 1990s, [5] and Labour councillor Geoff Lynch in the mid 1990s. [6]
| Year | Conservative | Labour | Liberal Democrats | Yorkshire | Independent | Council control after election | |
|---|---|---|---|---|---|---|---|
| 1995 | 9 | 26 | 1 | 0 | 5 | Labour | |
| 1999 | 15 | 20 | 1 | 0 | 5 | No overall control | |
| 2003 | 23 | 14 | 1 | 0 | 3 | Conservative | |
| 2007 | 29 | 9 | 0 | 0 | 3 | Conservative | |
| 2011 | 29 | 10 | 0 | 0 | 2 | Conservative | |
| 2015 | 22 | 8 | 0 | 0 | 1 | Conservative | |
| 2019 | 16 | 8 | 0 | 4 | 3 | Conservative | |


| Party | Candidate | Votes | % | ±% | |
|---|---|---|---|---|---|
| Labour | Kevin Aston | 408 | 48.2 | ||
| Conservative | John Cattanach | 395 | 46.7 | ||
| Liberal Democrats | John Eastwood | 43 | 5.1 | ||
| Majority | 13 | 1.5 | |||
| Turnout | 846 | 44.0 | |||
| Labour hold | Swing | ||||
| Party | Candidate | Votes | % | ±% | |
|---|---|---|---|---|---|
| Labour | John Bedworth | 317 | 59.7 | −0.7 | |
| Conservative | Ann Spetch | 180 | 33.9 | −6.0 | |
| Liberal Democrats | John Eastwood | 34 | 6.4 | +6.4 | |
| Majority | 137 | 25.8 | |||
| Turnout | 531 | 31.8 | |||
| Labour hold | Swing | ||||
| Party | Candidate | Votes | % | ±% | |
|---|---|---|---|---|---|
| Labour | David Wilson | 205 | 30.0 | +7.7 | |
| Independent | Richard Sweeting | 204 | 29.9 | +0.3 | |
| Conservative | Terry Welsh | 172 | 25.2 | +9.8 | |
| Liberal Democrats | Roderic Parker | 102 | 14.9 | −17.3 | |
| Majority | 1 | 0.1 | |||
| Turnout | 683 | ||||
| Labour gain from Independent | Swing | ||||
| Party | Candidate | Votes | % | ±% | |
|---|---|---|---|---|---|
| Conservative | Chris Pearson | 278 | 52.3 | +18.1 | |
| Labour | J. Sutcliffe | 254 | 47.7 | +5.2 | |
| Majority | 24 | 4.6 | |||
| Turnout | 532 | 29.5 | |||
| Conservative gain from Labour | Swing | ||||
| Party | Candidate | Votes | % | ±% | |
|---|---|---|---|---|---|
| Labour | Roy Wilson | 239 | 80.2 | +2.9 | |
| Conservative | Keith Bradley | 59 | 19.8 | −2.9 | |
| Majority | 180 | 60.4 | |||
| Turnout | 298 | 26.4 | |||
| Labour hold | Swing | ||||
| Party | Candidate | Votes | % | ±% | |
|---|---|---|---|---|---|
| Labour | Rod Price | 282 | 46.6 | −6.6 | |
| Conservative | Margaret Hulme | 211 | 34.9 | −11.9 | |
| Independent | Maria Morris | 112 | 18.5 | +18.5 | |
| Majority | 71 | 11.7 | |||
| Turnout | 605 | 34.9 | |||
| Labour hold | Swing | ||||
| Party | Candidate | Votes | % | ±% | |
|---|---|---|---|---|---|
| Conservative | William Inness | 316 | 79.0 | ||
| Labour | Jean Bills | 84 | 21.0 | ||
| Majority | 232 | 58.0 | |||
| Turnout | 400 | 28.4 | |||
| Conservative gain from Independent | Swing | ||||
| Party | Candidate | Votes | % | ±% | |
|---|---|---|---|---|---|
| Conservative | Bryn Sage | 251 | 44.3 | +11.7 | |
| Labour | Steven Shaw-Wright | 224 | 39.6 | −4.4 | |
| Yorkshire First | Chris Whitwood | 91 | 16.1 | +16.1 | |
| Majority | 27 | 4.8 | |||
| Turnout | 566 | ||||
| Conservative gain from Labour | Swing | ||||
| Party | Candidate | Votes | % | ±% | |
|---|---|---|---|---|---|
| Conservative | Charles Richardson | 996 | 66.4 | +42.2 | |
| Labour | David Bowgett | 342 | 22.8 | −0.1 | |
| Green | Barry Jones | 162 | 10.8 | +10.8 | |
| Majority | 654 | 43.6 | |||
| Turnout | 1,500 | ||||
| Conservative gain from Yorkshire | Swing | ||||
| Party | Candidate | Votes | % | ±% | |
|---|---|---|---|---|---|
| Conservative | Georgina Ashton | 215 | 48.1 | +13.4 | |
| Labour | Matthew Burton | 207 | 46.3 | +26.2 | |
| Green | Cherry Waters | 25 | 5.6 | +5.6 | |
| Majority | 8 | 1.8 | |||
| Turnout | 447 | ||||
| Conservative hold | Swing | ||||