The 2004 Harrogate Council election took place on 10 June 2004 to elect members of Harrogate Borough Council in North Yorkshire, England. One third of the council was up for election and the Conservative Party stayed in overall control of the council. [1]
After the election, the composition of the council was:
Before the election the Conservatives ran the council with 28 seats, while the Liberal Democrats had 21 seats and there were 4 independents. [3] The Conservatives had gained a majority after 2 Liberal Democrats defected to the Conservatives in autumn 2003. [4] 16 seats were contested in the election, all from the rural areas of the council. [5] The candidates in the election were 16 Conservatives, 16 Liberal Democrats, 2 independents and 1 candidate from the British National Party. [5] The election was held under all postal voting, [5] for the first time in Harrogate. [6]
A significant issue in the election was the future of the Royal Hall in Harrogate. [5] The Conservative administration refused to fund the restoration of the building and said they would consider financing other projects elsewhere in the council area from the money saved. [5] However the Liberal Democrats would have put 2.6 million pounds towards restoring it, as they said future generations would have to spend even more if the council did not take action. [5]
The results saw the Conservatives stay in control, with no change in the party composition of the council. [4] The Conservatives gained Lower Nidderdale from the Liberal Democrats, but Conservative cabinet member Brian Lumsden was defeated in Boroughbridge by Liberal Democrat Peter Phillips, [4] in what had been considered a safe seat. [7] The Conservatives won 62.5% of the vote, compared to 34.2% for the Liberal Democrats. [4] As a result, the Conservatives remained on 29 seats, the Liberal Democrats on 21 and 4 independents. [8]
Meanwhile, the British National Party came in last in the only seat they contested in Nidd Valley with 131 votes, [4] with Leslie Ellington holding the seat for the Conservatives, after having defected from the Liberal Democrats since the 2003 election. [9] Overall turnout in the election was 55.2%, [4] an increase on the 34.7% in the 2003 election and the 38.7% at the 2002 election. [10]
Party | Seats | Gains | Losses | Net gain/loss | Seats % | Votes % | Votes | +/− | |
---|---|---|---|---|---|---|---|---|---|
Conservative | 13 | 1 | 1 | 0 | 81.3 | 62.5 | 12,168 | +17.8% | |
Liberal Democrats | 3 | 1 | 1 | 0 | 18.8 | 34.2 | 6,661 | -12.3% | |
Independent | 0 | 0 | 0 | 0 | 0 | 2.5 | 495 | -1.5% | |
BNP | 0 | 0 | 0 | 0 | 0 | 0.7 | 131 | +0.7% | |
Party | Candidate | Votes | % | ±% | |
---|---|---|---|---|---|
Conservative | Ian Galloway | 782 | 70.9 | +16.2 | |
Liberal Democrats | Sarah-Jane Smith | 321 | 29.1 | −16.2 | |
Majority | 461 | 41.8 | +32.4 | ||
Turnout | 1,103 | 53.0 | +3.7 | ||
Conservative hold | Swing | ||||
Party | Candidate | Votes | % | ±% | |
---|---|---|---|---|---|
Liberal Democrats | Peter Phillips | 592 | 54.2 | +19.0 | |
Conservative | Brian Lumsden | 501 | 45.8 | −10.4 | |
Majority | 91 | 8.3 | |||
Turnout | 1,093 | 48.9 | +19.3 | ||
Liberal Democrats gain from Conservative | Swing | ||||
Party | Candidate | Votes | % | ±% | |
---|---|---|---|---|---|
Conservative | William Alton | 858 | 67.3 | −2.0 | |
Liberal Democrats | Helen Lyon | 417 | 32.7 | +2.0 | |
Majority | 441 | 34.6 | −4.0 | ||
Turnout | 1,275 | 52.9 | +6.9 | ||
Conservative hold | Swing | ||||
Party | Candidate | Votes | % | ±% | |
---|---|---|---|---|---|
Conservative | Michael Harrison | 875 | 74.9 | +1.2 | |
Liberal Democrats | Pauline Watson | 293 | 25.1 | −1.2 | |
Majority | 582 | 49.8 | +2.4 | ||
Turnout | 1,168 | 52.5 | +8.2 | ||
Conservative hold | Swing | ||||
Party | Candidate | Votes | % | ±% | |
---|---|---|---|---|---|
Conservative | Margaret Atkinson | 809 | 67.8 | −1.5 | |
Liberal Democrats | John Stockdale | 384 | 32.2 | +1.5 | |
Majority | 425 | 35.6 | −2.9 | ||
Turnout | 1,193 | 54.7 | +7.5 | ||
Conservative hold | Swing | ||||
Party | Candidate | Votes | % | ±% | |
---|---|---|---|---|---|
Conservative | Elwyn Hinchcliffe | 771 | 51.7 | +2.1 | |
Liberal Democrats | Thomas Watson | 721 | 48.3 | −2.1 | |
Majority | 50 | 3.4 | |||
Turnout | 1,492 | 64.4 | +9.4 | ||
Conservative gain from Liberal Democrats | Swing | ||||
Party | Candidate | Votes | % | ±% | |
---|---|---|---|---|---|
Conservative | Julian Sturdy | 936 | 78.1 | +24.6 | |
Liberal Democrats | Richard Hall | 262 | 21.9 | −16.7 | |
Majority | 674 | 56.3 | +41.3 | ||
Turnout | 1,198 | 55.9 | +12.4 | ||
Conservative hold | Swing | ||||
Party | Candidate | Votes | % | ±% | |
---|---|---|---|---|---|
Conservative | Nigel Simms | 602 | 57.9 | −13.9 | |
Independent | Thomas Mould | 259 | 24.9 | +24.9 | |
Liberal Democrats | Bernard Bateman | 179 | 17.2 | −11.0 | |
Majority | 343 | 33.0 | −10.6 | ||
Turnout | 1,040 | 55.8 | +16.0 | ||
Conservative hold | Swing | ||||
Party | Candidate | Votes | % | ±% | |
---|---|---|---|---|---|
Conservative | Nicholas Wilson | 689 | 58.9 | −3.8 | |
Liberal Democrats | Stephen Jones | 481 | 41.1 | +3.8 | |
Majority | 208 | 17.8 | −7.5 | ||
Turnout | 1,170 | 50.4 | +17.2 | ||
Conservative hold | Swing | ||||
Party | Candidate | Votes | % | ±% | |
---|---|---|---|---|---|
Conservative | Leslie Ellington | 748 | 57.9 | +22.8 | |
Liberal Democrats | Patricia Hutchinson | 412 | 31.9 | −33.0 | |
BNP | Colin Banner | 131 | 10.1 | +10.1 | |
Majority | 336 | 26.0 | |||
Turnout | 1,291 | 63.5 | +16.8 | ||
Conservative hold | Swing | ||||
Party | Candidate | Votes | % | ±% | |
---|---|---|---|---|---|
Liberal Democrats | Christine Lewis | 743 | 53.8 | −11.1 | |
Conservative | John Savage | 637 | 46.2 | +11.1 | |
Majority | 106 | 7.7 | −22.2 | ||
Turnout | 1,380 | 61.1 | +11.0 | ||
Liberal Democrats hold | Swing | ||||
Party | Candidate | Votes | % | ±% | |
---|---|---|---|---|---|
Liberal Democrats | Stanley Beer | 615 | 51.8 | −36.2 | |
Conservative | Richard Beecroft | 572 | 48.2 | +48.2 | |
Majority | 43 | 3.6 | −72.4 | ||
Turnout | 1,187 | 58.3 | +20.6 | ||
Liberal Democrats hold | Swing | ||||
Party | Candidate | Votes | % | ±% | |
---|---|---|---|---|---|
Conservative | Caroline Bayliss | 822 | 68.1 | −3.3 | |
Liberal Democrats | Christine Willoughby | 385 | 31.9 | +3.3 | |
Majority | 437 | 36.2 | −6.5 | ||
Turnout | 1,207 | 53.2 | +16.1 | ||
Conservative hold | Swing | ||||
Party | Candidate | Votes | % | ±% | |
---|---|---|---|---|---|
Conservative | Shirley Fawcett | 869 | 64.2 | −11.1 | |
Liberal Democrats | Jayne Jackson | 249 | 18.4 | −6.3 | |
Independent | David Rimington | 236 | 17.4 | +17.4 | |
Majority | 620 | 45.8 | −4.9 | ||
Turnout | 1,354 | 57.3 | +15.0 | ||
Conservative hold | Swing | ||||
Party | Candidate | Votes | % | ±% | |
---|---|---|---|---|---|
Conservative | Richard Grange | 963 | 73.6 | −7.8 | |
Liberal Democrats | Jonathan Fox | 346 | 26.4 | +7.8 | |
Majority | 617 | 47.1 | −15.7 | ||
Turnout | 1,309 | 59.8 | +17.3 | ||
Conservative hold | Swing | ||||
Party | Candidate | Votes | % | ±% | |
---|---|---|---|---|---|
Conservative | Christopher Brown | 734 | 73.8 | ||
Liberal Democrats | John Walton | 261 | 26.2 | ||
Majority | 473 | 47.5 | |||
Turnout | 995 | 46.2 | |||
Conservative hold | Swing | ||||
One third of Harrogate Borough Council in North Yorkshire, England was elected each year, followed by one year without election. Since the last boundary changes in 2002, 54 councillors had been elected from 35 wards. The last elections were held in 2018, ahead of the abolition of Harrogate Borough Council on 31 March 2023. Its functions transferred to the new North Yorkshire Council. The first elections to the North Yorkshire Council took place on 5 May 2022, when 21 councillors were elected from 21 divisions in the Borough of Harrogate.
The 2004 Craven District Council election took place on 10 June 2004 to elect members of Craven District Council in North Yorkshire, England. One third of the council was up for election and the council stayed under no overall control.
The 2002 Wakefield Metropolitan District Council election took place on 2 May 2002 to elect members of Wakefield Metropolitan District Council in West Yorkshire, England. One third of the council was up for election and the Labour party kept overall control of the council.
The 2004 Wakefield Metropolitan District Council election took place on 10 June 2004 to elect members of Wakefield Metropolitan District Council in West Yorkshire, England. The whole council was up for election with boundary changes since the last election in 2003. The Labour party stayed in overall control of the council.
The 2004 Halton Borough Council election took place on 10 June 2004 to elect members of Halton Unitary Council in Cheshire, England. The whole council was up for election with boundary changes since the last election in 2002. The Labour Party stayed in overall control of the council.
The 2004 Solihull Metropolitan Borough Council election took place on 10 June 2004 to elect members of Solihull Metropolitan Borough Council in the West Midlands, England. The whole council was up for election with boundary changes since the last election in 2003. The Conservative Party stayed in overall control of the council.
The 1999 Harrogate Council election took place on 6 May 1999 to elect members of Harrogate Borough Council in North Yorkshire, England. One third of the council was up for election and the Liberal Democrats stayed in overall control of the council.
The 2003 Harrogate Council election took place on 1 May 2003 to elect members of Harrogate Borough Council in North Yorkshire, England. One third of the council was up for election and the council stayed under no overall control.
The 2006 Harrogate Council election took place on 4 May 2006 to elect members of Harrogate Borough Council in North Yorkshire, England. One third of the council was up for election and the Conservative party lost overall control of the council to no overall control.
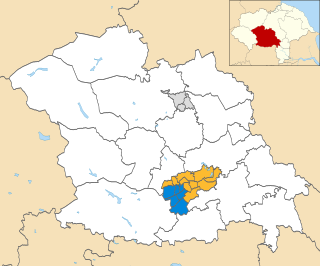
The 2007 Harrogate Council election took place on 3 May 2007 to elect members of Harrogate Borough Council in North Yorkshire, England. One third of the council was up for election and the council stayed under no overall control.
The 2008 Harrogate Council election took place on 1 May 2008 to elect members of Harrogate Borough Council in North Yorkshire, England. One third of the council was up for election and the council stayed under no overall control.
The 2010 Harrogate Council election took place on 6 May 2010 to elect members of Harrogate Borough Council in North Yorkshire, England. One third of the council was up for election and the Conservative party gained overall control of the council from no overall control.
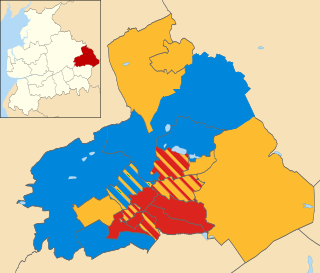
The 2002 Pendle Borough Council election took place on 2 May 2002 to elect members of Pendle Borough Council in Lancashire, England. The whole council was up for election with boundary changes since the last election in 2000 reducing the number of seats by 2. The council stayed under no overall control.
The 2004 Pendle Borough Council election took place on 10 June 2004 to elect members of Pendle Borough Council in Lancashire, England. One third of the council was up for election and the Liberal Democrats gained overall control of the council from no overall control.
The 2007 Pendle Borough Council election took place on 3 May 2007 to elect members of Pendle Borough Council in Lancashire, England. One third of the council was up for election and the Liberal Democrats stayed in overall control of the council.
The 2003 Colchester Borough Council election took place on 1 May 2003 to elect members of Colchester Borough Council in Essex, England. This was the same day as the other 2003 United Kingdom local elections. One third of the seats were up for election and the council stayed under no overall control.
The 2004 Colchester Borough Council election took place on 10 June 2004 to elect members of Colchester Borough Council in Essex, England. This was the same day as the other 2004 United Kingdom local elections and as the 2004 European Parliament Elections. One third of the seats were up for election and the council stayed under no overall control.
The 2008 Colchester Borough Council election took place on 1 May 2008 to elect members of Colchester Borough Council in Essex, England. One third of the council was up for election and the Conservative party lost overall control of the council to no overall control.
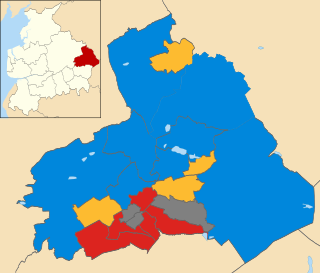
The 2011 Pendle Borough Council election took place on 5 May 2011 to elect members of Pendle Borough Council in Lancashire, England. One third of the council was up for election and the council stayed under no overall control.
The 2012 Pendle Borough Council election took place on 3 May 2012 to elect members of Pendle Borough Council in Lancashire, England. One third of the council was up for election and the council stayed under no overall control.