| |||||||||||||||||||||||||||||||||||||||||||||
All 47 seats to City of York Council 24 seats needed for a majority | |||||||||||||||||||||||||||||||||||||||||||||
---|---|---|---|---|---|---|---|---|---|---|---|---|---|---|---|---|---|---|---|---|---|---|---|---|---|---|---|---|---|---|---|---|---|---|---|---|---|---|---|---|---|---|---|---|---|
| |||||||||||||||||||||||||||||||||||||||||||||
|
Elections to City of York Council were held in 2003. The whole council was up for election. Boundary changes had reduced the number of seats from 53 to 47.
The election saw York's Labour Party lose control of the council covering central York for the first time since 1984. The Liberal Democrats won control of the council covering central York for the first time since the Liberal Party had last run the York Corporation in 1899.
The council was made up of 29 Liberal Democrats, 15 Labour, two Green and one independent. [1]
City of York Council election 2003 | |||||||||||||||
---|---|---|---|---|---|---|---|---|---|---|---|---|---|---|---|
Party | Candidates | Votes | |||||||||||||
Stood | Elected | Gained | Unseated | Net | % of total | % | No. | Net % | |||||||
Liberal Democrats | 47 | 29 | 61.7% | 49.0% | 58,239 | ||||||||||
Labour | 45 | 15 | 31.9% | 26.2% | 31,105 | ||||||||||
Green | 16 | 2 | 4.3% | 6.3% | 7,554 | ||||||||||
Independent | 7 | 1 | 2.1% | 4.7% | 5,562 | ||||||||||
Conservative | 27 | 0 | 0% | 13.5% | 16,117 | ||||||||||
Socialist Alliance | 3 | 0 | 0% | 0.2% | 302 | ||||||||||
Monster Raving Loony | 1 | 0 | 0% | 0.1% | 107 |
Party | Candidate | Votes | % | ||
---|---|---|---|---|---|
Labour | Tracey Simpson-Laing * | 1,051 | 26.3 | ||
Labour | David Horton † | 1,038 | 26.0 | ||
Liberal Democrats | Robert Anderson | 773 | 19.3 | ||
Liberal Democrats | Julie Hook | 630 | 15.8 | ||
Conservative | Valmai Galvin | 398 | 10.0 | ||
Monster Raving Loony | Graham Cambridge | 107 | 2.7 | ||
Turnout | 3,997 | 35.0 | |||
Labour win (new seat) | |||||
Labour win (new seat) |
The parishes of Acaster Malbis and Bishopthorpe
Party | Candidate | Votes | % | ||
---|---|---|---|---|---|
Liberal Democrats | David Livesley * | 989 | 58.5 | ||
Conservative | Susan Williams | 499 | 29.5 | ||
Labour | Winifred Atkinson | 202 | 12.0 | ||
Turnout | 1,690 | 53.6 | |||
Liberal Democrats win (new seat) |
Party | Candidate | Votes | % | ||
---|---|---|---|---|---|
Labour | Alan Jones * | 1,065 | 14.4 | ||
Labour | Kenneth King † | 977 | 13.2 | ||
Labour | David Scott | 825 | 11.1 | ||
Liberal Democrats | Joanna MacDonald | 807 | 10.9 | ||
Liberal Democrats | Simon Tarry ‡ | 804 | 10.8 | ||
Liberal Democrats | Samantha Waudby | 724 | 9.8 | ||
Independent | John Cook | 625 | 8.4 | ||
Independent | Leslie Marsh | 612 | 8.3 | ||
Independent | Stephen Prophet | 546 | 7.4 | ||
Green | William Shaw | 430 | 5.7 | ||
Turnout | 7,415 | 27.8 | |||
Labour win (new seat) | |||||
Labour win (new seat) |
The parishes of Dunnington, Holtby, and Kexby
Party | Candidate | Votes | % | ||
---|---|---|---|---|---|
Liberal Democrats | Janet Greenwood * | 808 | 56.6 | ||
Conservative | Jenny Brooks | 491 | 34.4 | ||
Labour | Lesley Della Gana | 128 | 9.0 | ||
Turnout | 1,427 | 48.7 | |||
Liberal Democrats win (new seat) |
Party | Candidate | Votes | % | ||
---|---|---|---|---|---|
Liberal Democrats | Ann Reid * | 2,052 | 19.5 | ||
Liberal Democrats | Susan Sunderland | 1,863 | 17.7 | ||
Liberal Democrats | Thomas Holvey | 1,704 | 16.2 | ||
Labour | Bernard Bell † | 1,009 | 9.6 | ||
Labour | Richard Cregan ‡ | 829 | 7.9 | ||
Conservative | Monica Garrity | 813 | 7.7 | ||
Labour | Gerard Hodgson | 794 | 7.5 | ||
Conservative | Alan Deanes | 755 | 7.2 | ||
Conservative | John Naylor | 703 | 6.7 | ||
Turnout | 10,522 | 41.5 | |||
Liberal Democrats win (new seat) | |||||
Liberal Democrats win (new seat) |
Party | Candidate | Votes | % | ||
---|---|---|---|---|---|
Green | Andy D'Agorne | 1,093 | 25.6 | ||
Green | Mark Hill | 1,028 | 24.1 | ||
Labour | John Boardman * | 555 | 13.0 | ||
Conservative | Robin Dickson † | 533 | 12.5 | ||
Labour | Roger Farrington ‡ | 472 | 11.1 | ||
Liberal Democrats | Karen Dunk | 321 | 7.5 | ||
Liberal Democrats | Derek Waudby | 265 | 6.2 | ||
Turnout | 4,267 | 38.0 | |||
Green win (new seat) | |||||
Green win (new seat) |
The parish of Fulford
Party | Candidate | Votes | % | ±% | |
---|---|---|---|---|---|
Liberal Democrats | Keith Aspden | 491 | 48.4 | 28.1 | |
Labour | Alan Smith | 285 | 28.1 | -17.7 | |
Conservative | Walter Davy | 162 | 16.0 | -17.8 | |
Green | Helen Kenwright | 76 | 7.5 | 7.5 | |
Turnout | 1,014 | 47.3 | 6.9 | ||
Liberal Democrats gain from Labour |
Party | Candidate | Votes | % | ||
---|---|---|---|---|---|
Labour | Janet Looker * | 664 | 22.7 | ||
Labour | Brian Watson † | 564 | 19.3 | ||
Liberal Democrats | Nicholas Blitz ‡ | 532 | 18.2 | ||
Liberal Democrats | Philip Thomas | 414 | 14.1 | ||
Conservative | Nicholas Toms | 319 | 10.9 | ||
Green | Gillian Cossham | 199 | 6.8 | ||
Green | Denise Craghill | 156 | 5.3 | ||
Socialist Alliance | Mark Russell | 78 | 2.7 | ||
Turnout | 2,926 | 28.0 | |||
Labour win (new seat) | |||||
Labour win (new seat) |
The parishes of Haxby and Wigginton
Party | Candidate | Votes | % | ||
---|---|---|---|---|---|
Liberal Democrats | Alan Hall * | 2,887 | 26.1 | ||
Liberal Democrats | Christopher Hogg † | 2,728 | 24.7 | ||
Liberal Democrats | Michael Watson ‡ | 2,528 | 22.9 | ||
Conservative | Robert Phillips | 724 | 6.6 | ||
Conservative | Gareth Dadd | 627 | 5.7 | ||
Green | Alan Robertshaw | 453 | 4.1 | ||
Labour | Doris Bell | 387 | 3.5 | ||
Labour | Stephen Burton | 383 | 3.5 | ||
Labour | David Wilson | 327 | 3.0 | ||
Turnout | 11,044 | 41.0 | |||
Liberal Democrats win (new seat) | |||||
Liberal Democrats win (new seat) |
The parish of Heslington
Party | Candidate | Votes | % | ±% | |
---|---|---|---|---|---|
Liberal Democrats | Ceredig Jamieson-Ball | 381 | 51.8 | 30.5 | |
Labour | Martin Brumby * | 155 | 21.1 | -18.3 | |
Conservative | Richard Robeson | 86 | 11.7 | -9.7 | |
Green | Candida Spillard | 82 | 11.2 | -6.7 | |
Socialist Alliance | Andrew Collingwood | 31 | 4.2 | 4.2 | |
Turnout | 735 | 19.9 | -1.5 | ||
Liberal Democrats gain from Labour |
Party | Candidate | Votes | % | ||
---|---|---|---|---|---|
Labour | Vivienne Kind * | 1,483 | 18.8 | ||
Labour | Paul Blanchard | 1,381 | 17.5 | ||
Labour | Ruth Potter † | 1,300 | 16.5 | ||
Liberal Democrats | Nigel Ayre | 1,020 | 13.0 | ||
Liberal Democrats | Matthew Reid | 924 | 11.7 | ||
Liberal Democrats | Ian Packington | 777 | 9.9 | ||
Conservative | Patricia Kay | 613 | 7.8 | ||
Green | David Layfield | 377 | 4.8 | ||
Turnout | 7,875 | 32.5 | |||
Labour win (new seat) | |||||
Labour win (new seat) |
The parish of Heworth Without
Party | Candidate | Votes | % | ||
---|---|---|---|---|---|
Liberal Democrats | Martin Lancelott | 708 | 49.9 | ||
Conservative | William Bennett | 470 | 33.1 | ||
Labour | David Thompson | 240 | 16.9 | ||
Turnout | 1,418 | 44.3 | |||
Liberal Democrats win (new seat) |
Party | Candidate | Votes | % | ||
---|---|---|---|---|---|
Liberal Democrats | Martin Bartlett | 1,626 | 17.8 | ||
Liberal Democrats | Charles Fairclough | 1,604 | 17.5 | ||
Liberal Democrats | Gilbert Nimmo | 1,392 | 15.2 | ||
Labour | Elizabeth Edge * | 1,357 | 14.8 | ||
Labour | Peter Finlay | 1,239 | 13.5 | ||
Labour | Annie Thompson | 1,074 | 11.7 | ||
Conservative | Nicholas Major | 441 | 4.8 | ||
Green | Mark Nicholson | 424 | 4.6 | ||
Turnout | 9,157 | 36.1 | |||
Liberal Democrats win (new seat) | |||||
Liberal Democrats win (new seat) |
Party | Candidate | Votes | % | ||
---|---|---|---|---|---|
Labour | Derek Smallwood * | 680 | 21.3 | ||
Labour | David Wilde † | 678 | 21.2 | ||
Independent | Gordon Campbell-Thomas | 435 | 13.6 | ||
Conservative | Duncan Flynn | 390 | 12.2 | ||
Liberal Democrats | Kevin Dunk | 360 | 11.3 | ||
Liberal Democrats | Susan Willer | 343 | 10.7 | ||
Green | John Cossham | 313 | 9.8 | ||
Turnout | 3,199 | 27.1 | |||
Labour win (new seat) | |||||
Labour win (new seat) |
The parishes of Huntington and New Earswick
Party | Candidate | Votes | % | ±% | |
---|---|---|---|---|---|
Liberal Democrats | John Orrell | 2,236 | 25.5 | 2.2 | |
Liberal Democrats | Keith Hyman | 2,186 | 24.9 | 1.6 | |
Liberal Democrats | Carol Runciman * | 1,969 | 22.4 | 1.9 | |
Conservative | Paul Tumman | 755 | 8.6 | 1.0 | |
Green | Clive Woolley | 608 | 6.9 | 6.9 | |
Labour | James Alexander | 531 | 6.1 | -3.0 | |
Labour | Geoffrey Beacon | 490 | 5.6 | -3.0 | |
Turnout | 8,775 | 34.7 | 2.5 | ||
Liberal Democrats hold | |||||
Liberal Democrats hold |
Party | Candidate | Votes | % | ||
---|---|---|---|---|---|
Labour | Alexander Fraser | 1,268 | 15.4 | ||
Labour | David Merrett * | 1,260 | 15.3 | ||
Labour | David Evans † | 1,198 | 14.5 | ||
Green | Andrew Chase | 734 | 8.9 | ||
Liberal Democrats | Simon Blackburn | 654 | 7.9 | ||
Green | Anthony Martin | 599 | 7.3 | ||
Liberal Democrats | Gillian Thompson | 599 | 7.3 | ||
Liberal Democrats | Ian Bunting | 595 | 7.2 | ||
Green | David King | 579 | 7.0 | ||
Conservative | Christopher Megone | 565 | 6.9 | ||
Socialist Alliance | Robert Looker | 193 | 2.3 | ||
Turnout | 8,224 | 32.6 | |||
Labour win (new seat) | |||||
Labour win (new seat) |
The parishes of Murton and Osbaldwick
Party | Candidate | Votes | % | ||
---|---|---|---|---|---|
Liberal Democrats | Jonathan Morley * | 514 | 50.3 | ||
Independent | Gerald Grisdale | 391 | 38.3 | ||
Labour | Andrew Garbutt | 117 | 11.4 | ||
Turnout | 1,022 | 39.5 | |||
Liberal Democrats win (new seat) |
The parishes of Askham Bryan, Askham Richard, Copmanthorpe, Hessay, Nether Poppleton, Rufforth with Knapton, and Upper Poppleton
Party | Candidate | Votes | % | ||
---|---|---|---|---|---|
Independent | Janet Hopton * | 2,100 | 19.0 | ||
Liberal Democrats | Quentin MacDonald † | 1,685 | 15.3 | ||
Liberal Democrats | Glen Bradley | 1,405 | 12.7 | ||
Conservative | Adam Sinclair | 1,336 | 12.1 | ||
Liberal Democrats | Carole Green | 1,316 | 11.9 | ||
Conservative | John Gillies | 1,212 | 11.0 | ||
Conservative | George Thomson-Smith | 1,016 | 9.2 | ||
Labour | Annette Brumby | 527 | 4.8 | ||
Labour | Iain Simpson-Laing | 440 | 4.0 | ||
Turnout | 11,037 | 43.9 | |||
Independent win (new seat) | |||||
Liberal Democrats win (new seat) | |||||
Liberal Democrats win (new seat) |
The parishes of Clifton Without, Rawcliffe, and Skelton
Party | Candidate | Votes | % | ||
---|---|---|---|---|---|
Liberal Democrats | Irene Waudby * | 1,912 | 20.8 | ||
Liberal Democrats | Mark Waudby † | 1,630 | 17.8 | ||
Liberal Democrats | Richard Moore | 1,534 | 16.7 | ||
Independent | Victor Paylor | 853 | 9.3 | ||
Labour | Anthony Ireland | 645 | 7.0 | ||
Conservative | Peter Gibson | 589 | 6.4 | ||
Conservative | Andrew Kay | 562 | 6.1 | ||
Labour | Matthew Page | 536 | 5.8 | ||
Labour | Maureen Smith | 518 | 5.6 | ||
Green | Andrew Dearden | 403 | 4.4 | ||
Turnout | 9,182 | 33.6 | |||
Liberal Democrats win (new seat) | |||||
Liberal Democrats win (new seat) |
The parishes of Earswick, Stockton-on-the-Forest, and Strensall with Towthorpe
Party | Candidate | Votes | % | ||
---|---|---|---|---|---|
Liberal Democrats | Madeleine Kirk * | 1,113 | 29.7 | ||
Liberal Democrats | Ian Cuthbertson | 996 | 26.5 | ||
Conservative | Jonathan Moore | 686 | 18.3 | ||
Conservative | William Hanbury | 599 | 16.0 | ||
Labour | Robert Guthrie | 191 | 5.1 | ||
Labour | Karl Smith | 167 | 4.5 | ||
Turnout | 3,752 | 32.3 | |||
Liberal Democrats win (new seat) | |||||
Liberal Democrats win (new seat) |
Party | Candidate | Votes | % | ||
---|---|---|---|---|---|
Liberal Democrats | Stephen Galloway * | 2,291 | 26.3 | ||
Liberal Democrats | Andrew Waller † | 2,154 | 24.7 | ||
Liberal Democrats | Susan Galloway ‡ | 2,013 | 23.1 | ||
Labour | Paul Baptie | 697 | 8.0 | ||
Labour | Thomas Gibson | 641 | 7.3 | ||
Labour | James Tipton | 613 | 7.0 | ||
Conservative | Kenneth Beavan § | 314 | 3.6 | ||
Turnout | 8,723 | 31.5 | |||
Liberal Democrats win (new seat) | |||||
Liberal Democrats win (new seat) |
The parishes of Deighton, Elvington, Naburn, and Wheldrake
Party | Candidate | Votes | % | ±% | |
---|---|---|---|---|---|
Liberal Democrats | Christian Vassie | 982 | 62.7 | 27.1 | |
Conservative | John Galvin * | 459 | 29.3 | -9.9 | |
Labour | Edward Gouge | 124 | 7.9 | -17.2 | |
Turnout | 1,565 | 50.5 | 6.5 | ||
Liberal Democrats gain from Conservative |
Haxby is a town and civil parish in the City of York district of North Yorkshire, England. According to the 2001 census the parish had a population of 8,754, reducing to 8,428 at the 2011 Census.
Huntington is a village and civil parish in the unitary authority of City of York in North Yorkshire, England. It is part of the Huntington & New Earswick ward and lies on the River Foss, to the north of York and the south of Strensall.
New Earswick is a model village and civil parish in the unitary authority of City of York in North Yorkshire, England, near the River Foss, north of York and south of Haxby. According to the 2001 census the parish had a population of 2,812, reducing to 2,737 at the 2011 Census.
Vale of York was a county constituency represented in the House of Commons of the Parliament of the United Kingdom. It elected one Member of Parliament (MP) by the first past the post system of election.
Wigginton is a village and civil parish in the unitary authority of the City of York in North Yorkshire, England. It is situated 4 miles (6.4 km) north of York. According to the 2001 census the parish had a population of 3,714, reducing to 3,610 at the 2011 Census.
The Strays of York is a collective name for four areas of open land, comprising in all over 800 acres (3.2 km2), within the City of York. Their individual names are Bootham Stray, Micklegate Stray, Monk Stray and Walmgate Stray.
The York Football League is a football competition based in North Yorkshire, England, founded in 1897. Currently it is known under the terms of a sponsorship agreement as the York Minster Engineering Football League. It is a member of the North Riding County Football Association, and the Premier Division sits at level 11 in the English football pyramid.
Elections to City of York Council were held on 6 May 1999. All 53 council seats in the city were up for election and the Labour Party kept overall control of the council.
Local elections for City of York Council were held on Thursday 3 May 2007. The whole council was up for election. Of the 47 seats contested, the Liberal Democrats won 19 seats, Labour won 18 seats, Conservatives won eight seats and the Green Party won two seats. The election saw York's ruling Liberal Democrats lose ten seats and overall control of the council.
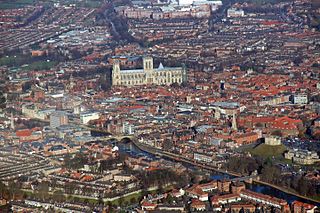
The City of York is a unitary authority area with city status in the ceremonial county of North Yorkshire, England. The district's main settlement is York, and it extends to the surrounding area including the town of Haxby and the villages of Earswick, Upper Poppleton, Nether Poppleton, Copmanthorpe, Bishopthorpe, Dunnington, Stockton on the Forest, Rufforth, Askham Bryan and Askham Richard, among other villages and hamlets. The unitary area had a population of 202,800 in the 2021 Census The City of York is administered by the City of York Council based in The Guildhall.
Elections to City of York Council were held on Thursday 5 May 2011. The whole council was up for election. The vote took place alongside the 2011 United Kingdom Alternative Vote referendum.
The 2015 City of York Council election took place on 7 May 2015 to elect members of City of York Council in England. The whole council was up for election. Turnout was substantially up across the city due to the election being held on the same day as the general election and other local elections in England.
Elections to the new City of York unitary authority were held on 4 May 1995, although the new unitary authority wasn't officially created until April 1996. All 53 council seats in the city were up for election and the Labour Party won overall control of the council.
Elections to City of York Council were held on 2 May 2019, as part of the United Kingdom local elections. The election resulted in substantial gains for the Liberal Democrats, who became the largest party, although no party surpassed the 24-seat majority threshold. The Conservatives suffered badly in this election, and lost 12 of the 14 seats they had won at the previous election. The Green Party held all their four seats, and surpassed the Conservatives in the popular vote. Labour gained two seats, although they failed to gain support in rural areas, where voters favoured the Liberal Democrats. On 14 May, The Liberal Democrats and the Green Party announced that they had agreed to run the council in a new 'progressive partnership' coalition, with Green Party leader Andy D'Agorne assuming the role of Deputy Leader of the Council while Liberal Democrat leader Keith Aspden succeeded Ian Gillies as Leader of the Council.
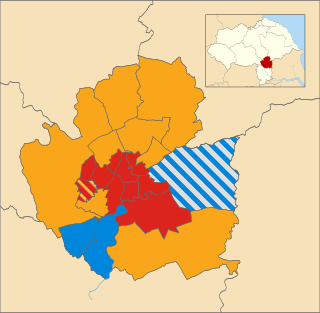
Elections to City of York Council took place on 4 May 2023, as part of the United Kingdom local elections. They were held on the same day as other local elections in England. The incumbent leader of the council and leader of the Liberal Democrats, Keith Aspden did not stand for re-election, with it being announced ahead of the elections that Nigel Ayre would be the Liberal Democrats' new leader.