| |||||||||||||||||||||||||||||||||
All 57 seats to Plymouth City Council 29 seats needed for a majority | |||||||||||||||||||||||||||||||||
---|---|---|---|---|---|---|---|---|---|---|---|---|---|---|---|---|---|---|---|---|---|---|---|---|---|---|---|---|---|---|---|---|---|
| |||||||||||||||||||||||||||||||||
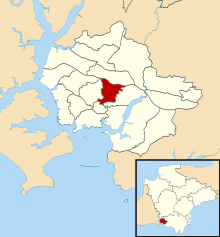
Map showing the results of contested wards in the 2003 Plymouth City Council elections. | |||||||||||||||||||||||||||||||||
|
The 2003 Plymouth City Council election was held on 1 May 2003 to elect members of Plymouth City Council in England. This was on the same day as the other local elections. The election was the first to be contested under new ward boundaries, and as a result the entire council was up for election. The Labour Party regained control of the council, which it had lost to the Conservative Party at the previous election in 2000. [1] [2] [3]
Party | Seats | Gains | Losses | Net gain/loss | Seats % | Votes % | Votes | +/− | |
---|---|---|---|---|---|---|---|---|---|
Labour | 36 | 14 | 63.2 | 43.2 | 24,849 | 7.3 | |||
Conservative | 18 | 9 | 31.6 | 32.0 | 18,421 | 16.1 | |||
Liberal Democrats | 3 | 2 | 5.3 | 18.3 | 10,515 | 3.7 | |||
Plymouth Party | 0 | 0.0 | 1.8 | 1,046 | New | ||||
Green | 0 | 0.0 | 1.7 | 976 | 1.2 | ||||
UKIP | 0 | 0.0 | 1.3 | 753 | New | ||||
Independent | 0 | 0.0 | 1.1 | 659 | 0.9 | ||||
BNP | 0 | 0.0 | 0.3 | 192 | New | ||||
Socialist Alliance (England) | 0 | 0.0 | 0.2 | 143 | New | ||||
Total | 57 | 57,303 |
Party | Candidate | Votes | % | ||
---|---|---|---|---|---|
Labour | R Simmonds | 1,487 | |||
Labour | T Coleman | 1,439 | |||
Labour | C Mavin | 1,408 | |||
Conservative | P Brookshaw | 1,092 | |||
Conservative | J Harden | 1,027 | |||
Conservative | G Horler | 1,011 | |||
Liberal Democrats | C Summerfield | 396 | |||
Liberal Democrats | J Fitzroy | 394 | |||
Liberal Democrats | R Dogan | 374 | |||
Turnout | 31.0% | ||||
Labour win (new seat) | |||||
Labour win (new seat) |
Party | Candidate | Votes | % | ||
---|---|---|---|---|---|
Conservative | D Stark | 1,458 | |||
Conservative | A Fry | 1,436 | |||
Conservative | T Savery | 1,413 | |||
Labour | S Barker | 858 | |||
Labour | S Oxenham | 825 | |||
Labour | C Rennie | 821 | |||
Liberal Democrats | R Fells | 720 | |||
Liberal Democrats | M Walker | 712 | |||
Liberal Democrats | R Casley | 710 | |||
Turnout | 32.9% | ||||
Conservative win (new seat) | |||||
Conservative win (new seat) |
Party | Candidate | Votes | % | ||
---|---|---|---|---|---|
Labour | B Brotherton | 1,421 | |||
Labour | W Stevens | 1,313 | |||
Labour | N Wildy | 1,301 | |||
Conservative | J Bell | 574 | |||
Conservative | E Gray | 537 | |||
Conservative | J Johnson | 509 | |||
Liberal Democrats | C Prigmore | 290 | |||
Liberal Democrats | T Colley | 251 | |||
Liberal Democrats | C MacCullie | 248 | |||
Independent | J Brooks | 245 | |||
BNP | G Green | 192 | |||
Plymouth Party | W Luck | 178 | |||
Turnout | 26.1% | ||||
Labour win (new seat) | |||||
Labour win (new seat) |
Party | Candidate | Votes | % | ||
---|---|---|---|---|---|
Liberal Democrats | K Gillard | 580 | |||
Liberal Democrats | D Santillo | 537 | |||
Labour | R Bellamy | 380 | |||
Labour | D Howells | 361 | |||
Conservative | P Marshall | 281 | |||
Conservative | C Miles | 272 | |||
Socialist Alliance | P Heddle | 69 | |||
Turnout | 18.6% | ||||
Liberal Democrats win (new seat) | |||||
Liberal Democrats win (new seat) |
Party | Candidate | Votes | % | ||
---|---|---|---|---|---|
Labour | B Miller | 1,784 | |||
Labour | A Kerswell | 1,766 | |||
Labour | B Vincent | 1,752 | |||
Liberal Democrats | N Sewell | 634 | |||
Liberal Democrats | D Wood | 619 | |||
Conservative | M Orchard | 613 | |||
Liberal Democrats | L Burrows | 607 | |||
Conservative | R Lloyd | 583 | |||
Conservative | R McVicar | 554 | |||
Turnout | 31.7% | ||||
Labour win (new seat) | |||||
Labour win (new seat) |
Party | Candidate | Votes | % | ||
---|---|---|---|---|---|
Labour | D Bray | 1,387 | |||
Labour | L Finn | 1,323 | |||
Labour | S Lemin | 1,278 | |||
Conservative | C Nunn | 1,182 | |||
Conservative | M Foster | 1,164 | |||
Conservative | P Rowe | 1,158 | |||
Liberal Democrats | M Bellamy | 584 | |||
Liberal Democrats | R Bellamy | 560 | |||
Liberal Democrats | T Smith | 511 | |||
Turnout | 32.5% | ||||
Labour win (new seat) | |||||
Labour win (new seat) |
Party | Candidate | Votes | % | ||
---|---|---|---|---|---|
Labour | Tudor Evans | 1,912 | |||
Labour | I Gordon | 1,784 | |||
Labour | C Pattison | 1,746 | |||
Conservative | S Ashcroft | 553 | |||
Conservative | D Bothwick | 507 | |||
Conservative | T Thomas | 503 | |||
Liberal Democrats | M Black | 407 | |||
Liberal Democrats | K Black | 394 | |||
Liberal Democrats | L Pearson | 330 | |||
Plymouth Party | S Charles | 166 | |||
Turnout | 29.9% | ||||
Labour win (new seat) | |||||
Labour win (new seat) |
Party | Candidate | Votes | % | ||
---|---|---|---|---|---|
Labour | P Carter | 1,689 | |||
Labour | P Purnell | 1,611 | |||
Labour | P Smith | 1,574 | |||
Conservative | B Baker | 520 | |||
Conservative | R Mahony | 502 | |||
Conservative | J Coope | 489 | |||
Liberal Democrats | J Crocker | 422 | |||
Liberal Democrats | M O'Neil | 374 | |||
Liberal Democrats | M Swann | 362 | |||
Turnout | 25.6% | ||||
Labour win (new seat) | |||||
Labour win (new seat) |
Party | Candidate | Votes | % | ||
---|---|---|---|---|---|
Labour | S Dann | 1,527 | |||
Labour | M Fox | 1,489 | |||
Labour | P Hutchings | 1,474 | |||
Conservative | H Ellis | 899 | |||
Conservative | J Ellis | 863 | |||
Conservative | A Sloggett | 829 | |||
Liberal Democrats | A Campbell | 491 | |||
Liberal Democrats | D Spreat | 408 | |||
Liberal Democrats | J Spreat | 401 | |||
Turnout | 30.4% | ||||
Labour win (new seat) | |||||
Labour win (new seat) |
Party | Candidate | Votes | % | ||
---|---|---|---|---|---|
Conservative | J Mahony | 1,435 | |||
Conservative | M Leaves | 1,373 | |||
Conservative | P Nicholson | 1,354 | |||
Labour | C Woodman | 1,049 | |||
Labour | C Rose | 1,002 | |||
Labour | R Sharman | 980 | |||
Liberal Democrats | V Costain | 847 | |||
Liberal Democrats | E Swann | 792 | |||
Liberal Democrats | M Shally | 763 | |||
Green | F Allen | 322 | |||
UKIP | R Sigrist | 301 | |||
UKIP | C Bragg | 284 | |||
UKIP | P Martin-Kaye | 260 | |||
Independent | A Sherry | 85 | |||
Turnout | 37.8% | ||||
Labour win (new seat) | |||||
Labour win (new seat) |
Party | Candidate | Votes | % | ||
---|---|---|---|---|---|
Conservative | G Jordan | 601 | |||
Conservative | D Salter | 572 | |||
Liberal Democrats | J Byatt | 377 | |||
Labour | P Murphy | 352 | |||
Liberal Democrats | P Hutty | 312 | |||
Labour | J Wood | 308 | |||
Independent | D Every | 211 | |||
Turnout | 23.6% | ||||
Conservative win (new seat) | |||||
Conservative win (new seat) |
Party | Candidate | Votes | % | ||
---|---|---|---|---|---|
Conservative | J Fox | 783 | |||
Liberal Democrats | E Lock | 764 | |||
Labour | R Burns | 713 | |||
Conservative | D Birkenhead | 697 | |||
Liberal Democrats | S Jennett | 668 | |||
Labour | M Robinson | 586 | |||
Turnout | 31.8% | ||||
Conservative win (new seat) | |||||
Liberal Democrats win (new seat) |
Party | Candidate | Votes | % | ||
---|---|---|---|---|---|
Conservative | P Nicholson | 1,848 | |||
Conservative | D James | 1,741 | |||
Conservative | D Ford | 1,661 | |||
Labour | J Henley | 998 | |||
Labour | V Burns | 955 | |||
Labour | S Robinson | 860 | |||
Liberal Democrats | P Fewings | 638 | |||
Liberal Democrats | A Cains | 583 | |||
Liberal Democrats | M Trench | 478 | |||
Turnout | 34.9% | ||||
Conservative win (new seat) | |||||
Conservative win (new seat) |
Party | Candidate | Votes | % | ||
---|---|---|---|---|---|
Conservative | D Viney | 1,866 | |||
Conservative | V Pengelly | 1,769 | |||
Conservative | K Wigens | 1,681 | |||
Labour | R Evans | 975 | |||
Labour | C Childs | 842 | |||
Labour | D Roche | 808 | |||
Liberal Democrats | P Jones | 482 | |||
Liberal Democrats | R Tofts | 481 | |||
Liberal Democrats | J Evans | 478 | |||
Turnout | 29.8% | ||||
Conservative win (new seat) | |||||
Conservative win (new seat) |
Party | Candidate | Votes | % | ||
---|---|---|---|---|---|
Conservative | K Foster | 1,208 | |||
Conservative | W Foster | 1,156 | |||
Conservative | M Leaves | 1,128 | |||
Labour | R Dodd | 1,123 | |||
Labour | J Clynch | 1,062 | |||
Labour | W Wraight | 844 | |||
Liberal Democrats | C Burrows | 500 | |||
UKIP | R Bullock | 452 | |||
UKIP | A Skuse | 414 | |||
UKIP | D McCallum | 408 | |||
Liberal Democrats | M Chandler | 405 | |||
Liberal Democrats | S Kendrick | 372 | |||
Turnout | 34.2% | ||||
Conservative win (new seat) | |||||
Conservative win (new seat) |
Party | Candidate | Votes | % | ||
---|---|---|---|---|---|
Labour | G Wheeler | 1,560 | |||
Labour | C Blackburn | 1,475 | |||
Labour | D Williams | 1,426 | |||
Conservative | H Plymsol | 520 | |||
Conservative | P Crolla | 513 | |||
Liberal Democrats | R McSweeney | 449 | |||
Conservative | M White | 421 | |||
Liberal Democrats | G Hirst | 379 | |||
Liberal Democrats | M Gallagher | 371 | |||
Turnout | 24.9% | ||||
Labour win (new seat) | |||||
Labour win (new seat) |
Party | Candidate | Votes | % | ||
---|---|---|---|---|---|
Labour | M King | 1,040 | |||
Labour | T Wildy | 963 | |||
Labour | V Hiromeris | 958 | |||
Conservative | F Brimacombe | 728 | |||
Conservative | A Angel | 670 | |||
Conservative | E Shillabeer | 588 | |||
Liberal Democrats | H Stone | 535 | |||
Liberal Democrats | J Newton | 475 | |||
Liberal Democrats | T Wickett | 434 | |||
Plymouth Party | K Kelway | 365 | |||
Plymouth Party | J Broughton | 264 | |||
Plymouth Party | S Billows | 242 | |||
Green | F Williamson | 172 | |||
Independent | S Ellis | 118 | |||
Turnout | 27.8% | ||||
Labour win (new seat) | |||||
Labour win (new seat) |
Party | Candidate | Votes | % | ||
---|---|---|---|---|---|
Labour | D Camp | 1,996 | |||
Labour | J Kirk | 1,728 | |||
Labour | D Weekes | 1,620 | |||
Conservative | E Willey | 836 | |||
Conservative | E Dawson | 732 | |||
Conservative | J Plymsol | 731 | |||
Liberal Democrats | T O'Connor | 372 | |||
Liberal Democrats | C Curry | 333 | |||
Liberal Democrats | B Yardley | 292 | |||
Turnout | 27.8% | ||||
Labour win (new seat) | |||||
Labour win (new seat) |
Party | Candidate | Votes | % | ||
---|---|---|---|---|---|
Labour | M Fletcher | 1,128 | |||
Labour | G Shears | 1,045 | |||
Labour | D Haydon | 1,007 | |||
Conservative | C Pascoe | 935 | |||
Conservative | Y Dawson | 926 | |||
Conservative | G Monaghan | 877 | |||
Liberal Democrats | H Guy | 506 | |||
Liberal Democrats | S Guy | 469 | |||
Liberal Democrats | N Wickett | 422 | |||
Green | J Cavanagh | 287 | |||
Plymouth Party | I Fleming | 178 | |||
Plymouth Party | K Woodward | 170 | |||
Turnout | 29.0% | ||||
Labour win (new seat) | |||||
Labour win (new seat) |
Party | Candidate | Votes | % | ||
---|---|---|---|---|---|
Labour | J Nelder | 1,470 | |||
Labour | M Aspinall | 1,452 | |||
Labour | E Rennie | 1,337 | |||
Liberal Democrats | C Brown | 521 | |||
Liberal Democrats | P York | 492 | |||
Conservative | J Parry | 489 | |||
Conservative | R Welchman | 486 | |||
Conservative | J White | 472 | |||
Liberal Democrats | G Nye | 429 | |||
Green | T Mitchell | 195 | |||
Plymouth Party | D Kelway | 159 | |||
Plymouth Party | R Brierley | 127 | |||
Socialist Alliance | R Manning | 74 | |||
Socialist Alliance | E Peonides | 69 | |||
Socialist Alliance | P Tozer | 48 | |||
Turnout | 28.0% | ||||
Labour win (new seat) | |||||
Labour win (new seat) |
Elections to Barnsley Metropolitan Borough Council were held on 7 May 1998. One third of the council was up for election and the Labour party kept overall control of the council.
Plymouth City Council is the local authority for the a unitary authority of Plymouth in Devon, England. Until 1 April 1998 it was a non-metropolitan district.
The 2010 Plymouth City Council election was held on 6 May 2010 to elect members of Plymouth City Council in England.
Plymouth City Council is the local authority for Plymouth, a unitary authority with city status in the ceremonial county of Devon, England.
The 2011 Plymouth City Council election took place on 5 May 2011 to elect members to Plymouth City Council in England. One third of the council was up for election, in addition to a by-election, making twenty seats in total. The previous election produced a majority for the Conservative Party. The election resulted in Labour gaining 5 seats with Conservatives retaining control.
The 2012 Plymouth City Council election took place on 3 May 2012 to elect members of Plymouth City Council in England. This was on the same day as other local elections. The election was won by the Labour Party, who gained control of the council from the Conservative Party.
The 2012 Exeter City Council election took place on 3 May 2012, to elect members of Exeter City Council in Devon, England. The election was held concurrently with other local elections in England. One third of the council was up for election; the seats up for election were last contested in 2008. The Labour Party gained overall control of the council, which had been under no overall control since 2003. The Liberal Party was wiped off the council.
The Devon and Cornwall Police and Crime Commissioner is the police and crime commissioner, an elected official tasked with setting out the way crime is tackled by Devon and Cornwall Police in the English counties of Devon and Cornwall. The post was created in November 2012, following an election held on 15 November 2012, and replaced the Devon and Cornwall Police Authority. The current incumbent is Alison Hernandez, who represents the Conservative Party.
The 2014 Plymouth City Council election took place on 22 May 2014 to elect members of Plymouth City Council in England. This was on the same day as other local elections. The election was won by the Labour Party, who maintained their overall majority. The UK Independence Party gained representation on the council for the first time, and this was the only election in which the party won seats in Plymouth.
The 2015 Plymouth City Council election took place on 7 May 2015 to elect members of Plymouth City Council in England.
The 2016 Plymouth City Council election took place on 5 May 2016 to elect members of Plymouth City Council in England. The Conservatives gained one seat from Labour, resulting in both parties having twenty-seven members of the council. A coalition of Conservative and UKIP members took overall control of the Council, having thirty members in total and a working majority.
Elections to Mid Bedfordshire District Council were held in May 2007. These were the last elections to council, with all 53 seats being up for election. Councillors elected would serve a two-year term, expiring in 2009, when Mid Bedfordshire District Council was replaced by Central Bedfordshire Council. The Conservative Party retained overall control of the council, winning 37 of 53 seats on the council. The Conservatives won 8 seats unopposed, as did an Independent candidate in one ward.
Elections to Mid Bedfordshire District Council were held on 1 May 2003. All 53 seats were up for election. Councillors elected would serve a four-year term, expiring in 2007. The Conservative Party retained overall control of the council, winning 37 of 53 seats on the council. The Conservatives won 7 seats unopposed.
Elections to Mid Bedfordshire District Council were held on 6 May 1999. All 53 seats were up for election. The Conservative Party gained overall control of the council, increasing their number of seats from 22 to 34, whilst the Labour Party declined from having 20 seats in 1995 to 7.
The 2018 Plymouth City Council election took place on 3 May 2018 to elect members of Plymouth City Council in England. The election was won by the Labour Party, who gained enough seats to achieve an overall majority and took control of the council.
The 2019 Plymouth City Council election was held on 2 May 2019 to elect members of Plymouth City Council in England.
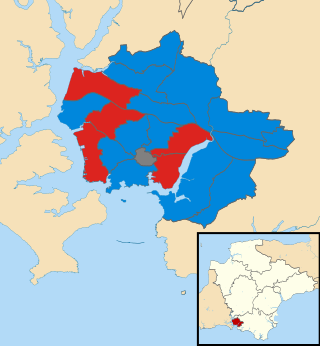
The 2008 Plymouth City Council election was held on 1 May 2008 to elect members of Plymouth City Council in England. One third of the council was up for election and the Conservative Party remained in control of the council with an increased majority.
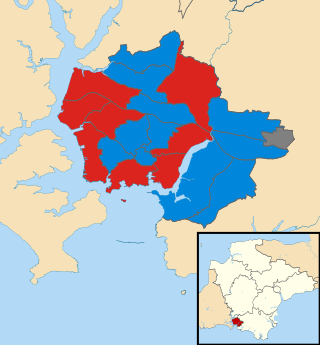
The 2007 Plymouth City Council election was held on 3 May 2007 to elect members of Plymouth City Council in England. One third of the council was up for election and the Conservative Party gained control of the council from the Labour Party.
The 2004 Plymouth City Council election was held on 10 June 2004 to elect members of Plymouth City Council in England. This was on the same day as the other local elections. One third of the council was up for election and the Labour Party remained in control of the council.
The 2003 Exeter City Council election took place on 1 May 2003, to elect members of Exeter City Council in Devon, England. The election was held concurrently with other local elections in England. One third of the council was up for election and the Labour Party lost control of the council, which it had held since 1995.