2003 Leeds City Council election

Last updated

Map of the results for the 2003 Leeds council election. Leeds UK local election 2003 map.png
Map of the results for the 2003 Leeds council election.

The 2003 Leeds City Council election took place on 1 May 2003 to elect members of City of Leeds Metropolitan Borough Council in West Yorkshire, England. One third of the council was up for election and the Labour Party stayed in overall control of the council. [1]

Contents

Election result

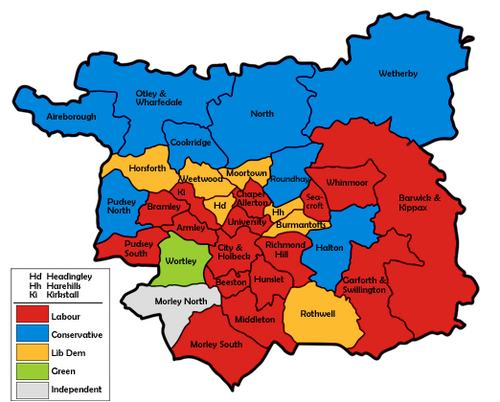
The results saw Labour just keep a majority on the council with 52 of the 99 seats. [2] They suffered a net loss of 5 seats, [2] including the leader of the council for the past 7 years, Brian Walker, who was defeated by the Liberal Democrats in Rothwell ward. [3] The Conservatives gained the most seats to become the second largest party on the council with 22 seats, after making 4 gains in Aireborough, Halton, Otley and Wharfedale and Roundhay wards. [2] As well as the gain in Rothwell, the Liberal Democrats also picked up a seat from Labour in Burmantofts but lost seats in Bramley and Otley and Wharfedale to Labour and Conservatives respectively. [2]

Elsewhere independent Tom Leadley gained a seat from Labour in Morley North, while the Greens held their seat in Wortley. [2] Turnout in the election dropped to just over 30% [4] with some wards seeing under 20% voting, while the lowest turnout came in Headingley at only 15%. [5]

Following the election the deputy leader of the council, Keith Wakefield, became leader unopposed after a meeting of the Labour group on the council. [6]

Leeds Local Election Result 2003 [7] [8]
PartySeatsGainsLossesNet gain/lossSeats %Votes %Votes+/−
  Labour 1616-548.535.555,032-5.9
  Conservative 840+424.229.145,113-0.1
  Liberal Democrats 722021.225.038,831+2.7
  Green 10003.04.36,674-0.2
  Independent 110+13.01.92,875+0.5
  BNP 00000.02.84,310+2.7
 Alliance for Green Socialism00000.01.11,633+0.3
  Socialist Alliance 00000.00.3428+0.1
  Socialist Alternative 00000.00.2234+0.1

This result had the following consequences for the total number of seats on the council after the elections: [7]

PartyPrevious councilNew council
Labour5752
Conservative1822
Liberal Democrat2020
Green33
Independent12
Total9999
Working majority 15  5 

Ward results

Aireborough [8]
PartyCandidateVotes%±%
Conservative Stuart Andrew 2,89944.0−0.4
Labour Mike King2,65240.2+2.5
Liberal Democrats Ian Hutton1,04315.8−2.1
Majority2473.8−2.9
Turnout 6,59434.0−3.9
Conservative gain from Labour Swing -1.4
Armley [8]
PartyCandidateVotes%±%
Labour Janet Harper1,67649.3−6.7
Conservative Glenn Broadbent57216.8−1.7
Liberal Democrats Stephen McBarron56216.5+3.8
Green Luke Russell52315.4+2.5
Socialist Alliance Isaac Lyne661.9+1.9
Majority1,10432.5−5.0
Turnout 3,39923.0−0.8
Labour hold Swing -2.5
Barwick & Kippax [8]
PartyCandidateVotes%±%
Labour James Lewis2,95044.2−11.6
Conservative Alec Shelbrooke 2,36435.4+3.8
Liberal Democrats Natasha De Vere6229.3+0.6
BNP Christopher Andrews5358.0+8.0
Green Elizabeth Holmes2103.1+0.3
Majority5868.8−15.4
Turnout 6,68136.0−2.3
Labour hold Swing -7.7
Beeston [8]
PartyCandidateVotes%±%
Labour Adam Ogilvie1,49244.2−7.0
Conservative William Birch98729.3−1.1
BNP Thomas Linden36810.9+10.9
Liberal Democrats Kathleen Fenton36610.9−1.6
Green Irene Draycup802.4−0.6
Socialist Alliance Philip Goodfield792.3−0.7
Majority50514.9−5.9
Turnout 3,37228.5−0.4
Labour hold Swing -2.9
Bramley [8]
PartyCandidateVotes%±%
Labour Ted Hanley1,76345.9−6.8
Liberal Democrats Julian Cummins1,52039.5+5.8
Conservative Michael Best39410.2+0.7
Green Francis Gray1674.3+0.2
Majority2436.4−12.6
Turnout 3,84423.5−0.4
Labour gain from Liberal Democrats Swing -6.3
Burmantofts [8]
PartyCandidateVotes%±%
Liberal Democrats Ralph Pryke1,70649.6+5.6
Labour Geoffrey Holloran1,53044.5−2.3
Conservative Patricia Hyde2035.9−0.2
Majority1765.1+2.3
Turnout 3,43928.3+0.9
Liberal Democrats gain from Labour Swing +3.9
Chapel Allerton [8]
PartyCandidateVotes%±%
Labour Norma Hutchinson1,69741.9−10.7
Alliance for Green SocialismGarth Frankland94723.4+2.0
Liberal Democrats Sitara Khan81620.1+8.3
Conservative Roger Illingworth59014.6+0.4
Majority75018.5−12.7
Turnout 4,05028.1−3.3
Labour hold Swing -5.3
City & Holbeck [8]
PartyCandidateVotes%±%
Labour Mohammed Iqbal1,29248.1−13.5
Liberal Democrats Eric Scott52519.5+9.0
Conservative Michael Wheeler42115.7−5.5
Socialist Alternative David Jones2348.7+2.0
Green Janet Pritchard2168.0+8.0
Majority76728.6−11.8
Turnout 2,68818.0−2.0
Labour hold Swing -11.2
Cookridge [8]
PartyCandidateVotes%±%
Conservative Barry Anderson3,33652.8−1.0
Liberal Democrats Sue Bentley1,90330.1+10.4
Labour Patrick Hennigan1,08317.1−5.7
Majority1,43322.7−8.3
Turnout 6,32238.0+1.0
Conservative hold Swing -5.7
Garforth & Swillington [8]
PartyCandidateVotes%±%
Labour Andrea Harrison2,87646.0−5.6
Conservative Robert Semple1,63126.1−4.8
Liberal Democrats Ian Dowling1,09517.5−0.1
BNP Tracy Andrews65610.5+10.5
Majority1,24519.9−0.8
Turnout 6,25833.0−0.8
Labour hold Swing -0.4
Halton [8]
PartyCandidateVotes%±%
Conservative David Schofield2,90248.2+7.1
Labour Doris McGee2,13435.4−8.0
Liberal Democrats David Hollingsworth98916.4+4.4
Majority76812.8+10.5
Turnout 6,02534.0+0.1
Conservative gain from Labour Swing +7.5
Harehills [8]
PartyCandidateVotes%±%
Liberal Democrats Alan Taylor2,68359.9+20.3
Labour John Clare1,49133.3−18.5
Conservative Karl Steenson1743.9+0.9
Alliance for Green SocialismAzar Iqbal1282.9+2.9
Majority1,19226.6+14.4
Turnout 4,47633.4−7.1
Liberal Democrats hold Swing +19.4
Headingley [8]
PartyCandidateVotes%±%
Liberal Democrats Gregory Mulholland 1,66852.4+3.7
Labour Safdar Hussain76424.0−5.8
Green Lesley Jeffries35111.0+0.9
Conservative Richard Smith2417.6+0.1
Socialist Alliance Katherine Owen1585.0+1.0
Majority90428.4+9.5
Turnout 3,18215.5−3.3
Liberal Democrats hold Swing +4.7
Horsforth [8]
PartyCandidateVotes%±%
Liberal Democrats Brian Cleasby2,40443.2−1.0
Conservative Neil Hunt1,99735.9+1.6
Labour Tony Addison88415.9−1.9
Green Andrea Binns2805.0+1.3
Majority4077.3−2.6
Turnout 5,56533.1−2.9
Liberal Democrats hold Swing -1.3
Hunslet [8]
PartyCandidateVotes%±%
Labour John Erskine1,26463.3−4.9
Liberal Democrats Ann Norman32016.0+2.5
Conservative Anthony Larvin29014.5+2.1
Green Catherine Harmer1226.1+2.3
Majority94447.3−7.4
Turnout 1,99618.6−2.0
Labour hold Swing -3.7
Kirkstall [8]
PartyCandidateVotes%±%
Labour John Illingworth1,58045.7−11.9
Liberal Democrats Toby Fursdon1,08031.2+15.4
Conservative Charles Moore40611.7−2.0
Green Martin Reed39111.3−1.6
Majority50014.5−27.4
Turnout 3,45722.9−2.1
Labour hold Swing -13.6
Middleton [8]
PartyCandidateVotes%±%
Labour Stuart Bruce1,63055.0−8.6
Conservative David Boynton69723.5+5.9
Liberal Democrats Sadie Fisher44515.0+1.9
Green Patricia Capstick1916.4+0.7
Majority93331.5−14.5
Turnout 2,96319.9−1.8
Labour hold Swing -7.2
Moortown [8]
PartyCandidateVotes%±%
Liberal Democrats Richard Harker2,63751.8−3.4
Labour David Dresser1,30325.6−0.9
Conservative Peter Knowles93618.4+2.4
Alliance for Green SocialismMichael Davies2154.2+0.9
Majority1,33426.2−2.5
Turnout 5,09131.6−3.7
Liberal Democrats hold Swing -1.2
Morley North [8]
PartyCandidateVotes%±%
Independent Thomas Leadley2,47342.3+4.5
Labour Alex Sobel 1,80930.9+1.0
Conservative Stephen Kearns1,12619.2−3.7
Liberal Democrats Christine Golton4427.6+0.7
Majority66411.4+3.5
Turnout 5,85030.3−0.2
Independent gain from Labour Swing +1.7
Morley South [8]
PartyCandidateVotes%±%
Labour Debra Coupar2,03336.3−16.9
Conservative Judith Elliott1,48426.5−2.5
BNP Christopher Beverley1,06419.0+19.0
Liberal Democrats Rochelle Harris62111.1−6.7
Independent Charles Slingsby4027.2+7.2
Majority5499.8−14.4
Turnout 5,60425.1+2.7
Labour hold Swing -7.2
North [8]
PartyCandidateVotes%±%
Conservative Ruth Feldman2,56143.5−2.2
Liberal Democrats Judith Chapman2,27238.6+3.3
Labour Doreen Illingworth95716.3−1.9
Alliance for Green SocialismBrian Jackson951.6+0.8
Majority2894.9−5.5
Turnout 5,88535.0−3.8
Conservative hold Swing -2.7
Otley & Wharfedale [8]
PartyCandidateVotes%±%
Conservative Gerard Francis2,79038.1−6.1
Liberal Democrats Graham Kirkland2,58135.2+12.0
Labour John Eveleigh1,61522.1−7.2
Green Paul Marchant3384.6+1.2
Majority2092.9−12.0
Turnout 7,32438.4−2.4
Conservative gain from Liberal Democrats Swing -9.0
Pudsey North [8]
PartyCandidateVotes%±%
Conservative Amanda Carter3,82763.2+11.1
Labour Tina Davy1,38322.8−9.4
Liberal Democrats Christine Glover85014.0+1.6
Majority2,44440.4+20.5
Turnout 6,06034.0−3.7
Conservative hold Swing +10.2
Pudsey South [8]
PartyCandidateVotes%±%
Labour Josephine Jarosz2,27042.9−5.2
Conservative Jason Aldiss1,76833.4−2.8
Liberal Democrats John Burke63712.0+0.4
BNP Richard Warrington4378.3+8.3
Green Yvonne Clarke1793.4−0.8
Majority5029.5−2.4
Turnout 5,29131.8−1.5
Labour hold Swing -1.2
Richmond Hill [8]
PartyCandidateVotes%±%
Labour Marlene Lyons1,50954.5−16.6
BNP Mark Collett 55019.9+19.9
Liberal Democrats Keith Norman48317.5+1.8
Conservative Simon Church2258.1−1.8
Majority95944.6−10.8
Turnout 2,76723.3−3.6
Labour hold Swing -18.2
Rothwell [8]
PartyCandidateVotes%±%
Liberal Democrats Steve Smith2,49549.4+1.2
Labour Brian Walker2,10941.7+0.9
Conservative Caroline Judge4518.9−2.1
Majority3867.7+0.3
Turnout 5,05531.5−2.6
Liberal Democrats gain from Labour Swing +0.1
Roundhay [8]
PartyCandidateVotes%±%
Conservative Matthew Lobley2,41739.6−1.4
Labour Michael Fox2,34738.4−1.3
Liberal Democrats John Skinner90114.8+1.0
Green Paul Ellis2604.3+0.7
Alliance for Green SocialismMalcolm Christie1802.9+1.0
Majority701.1−0.2
Turnout 6,10537.2−2.1
Conservative gain from Labour Swing -0.0
Seacroft [8]
PartyCandidateVotes%±%
Labour Brian Selby2,00366.3−13.9
Liberal Democrats Pauline Davies40313.3−5.0
BNP Alistair Ingham35611.8+11.8
Conservative Donald Townsley2618.6+7.1
Majority1,60052.9−9.0
Turnout 3,02326.0+2.5
Labour hold Swing -4.4
University [8]
PartyCandidateVotes%±%
Labour Gerald Harper1,00041.8−15.1
Liberal Democrats Joan Ewens93038.9+18.7
Conservative Robert Winfield1857.7−5.9
Green Bluebell Eikonoklastes1536.4−2.8
Socialist Alliance Steven Skinner1255.2+5.2
Majority702.9−33.8
Turnout 2,39315.3−1.3
Labour hold Swing -16.9
Weetwood [8]
PartyCandidateVotes%±%
Liberal Democrats Brian Jennings2,19645.5+0.8
Labour Dudley Parker1,33627.7−4.0
Conservative Timothy Metcalfe92219.1+1.6
Green David Webb3707.7+1.6
Majority86017.8+4.8
Turnout 4,82429.5−4.9
Liberal Democrats hold Swing +2.4
Wetherby [8]
PartyCandidateVotes%±%
Conservative Andrew Millard4,64466.0+0.0
Labour Reginald Steel1,49321.2+0.1
Liberal Democrats Edmund Conybeare89912.8+0.0
Majority3,15144.8−0.1
Turnout 7,03634.3−2.3
Conservative hold Swing -0.0
Whinmoor [8]
PartyCandidateVotes%±%
Labour Peter Gruen1,86849.7−4.8
Conservative Graeme Shaw98926.3−7.5
Liberal Democrats Colin Campbell48612.9+1.2
BNP Marten Gibson3449.2+9.2
Alliance for Green SocialismAmanda Munro681.8+1.8
Majority87923.4+2.7
Turnout 3,75530.2−2.1
Labour hold Swing +1.3
Wortley [8]
PartyCandidateVotes%±%
Green David Blackburn2,84359.8+5.8
Labour Jane Dowson1,23926.1−5.7
Conservative Victoria Richmond4238.9−1.0
Liberal Democrats Leanne Winfield2515.3+1.0
Majority1,60433.7+11.5
Turnout 4,75627.9−1.8
Green hold Swing +5.7

References

  1. "Local elections". BBC News Online . Retrieved 6 August 2018.
  2. 1 2 3 4 5 "Labour just cling on". Yorkshire Evening Post . 2 May 2003. Retrieved 6 August 2018.
  3. Hetherington, Peter (3 May 2003). "English local elections: Labour hit by tax rises and 'Baghdad backlash': England: Disaffection boosts Tories and Lib Dems". The Guardian . p. 16. ISSN   0261-3077.
  4. "Local elections 2006". BBC News Online . 27 May 2007. Retrieved 6 August 2018.
  5. "Turned out bad again...". Yorkshire Evening Post . 3 May 2003. ISSN   0963-2255.
  6. "Life force". Yorkshire Evening Post . 7 May 2003. ISSN   0963-2255.
  7. 1 2 "Local elections 2003". The Times . 2 May 2003. p. 16. ISSN   0140-0460.
  8. 1 2 3 4 5 6 7 8 9 10 11 12 13 14 15 16 17 18 19 20 21 22 23 24 25 26 27 28 29 30 31 32 33 34 "Local Elections 2003". Political Science Resources. Archived from the original on 4 March 2016. Retrieved 6 August 2018.