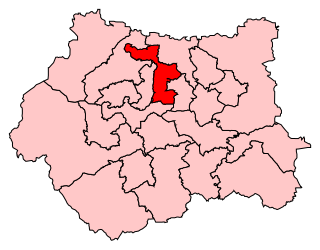
2015 Leeds City Council election

Last updated

2015 Leeds City Council election
Flag of England.svg
  2014 7 May 2015 2016  

33 of the 99 seats on Leeds City Council
50 seats needed for a majority
Turnout64.09% (TBC)
 First partySecond party
 
Leader Keith Wakefield Andrew Carter
Party Labour Conservative
Last election20 seats, 38.6%6 seats, 21.5%
Seats won227
Seats after6319
Seat changeSteady2.svgSteady2.svg
Popular vote141,85697,710
Percentage39.8%23.0%

Leeds UK local election 2015 map.svg
Labour in red (22), Conservatives in blue (7), Liberal Democrats in yellow (2), Greens in light green (1) and Morley Borough Independents in dark green (1).

Council control before election

Majority administration
Labour

Council control after election

Majority administration
Labour

The 2015 Leeds City Council election took place on Thursday 7 May 2015 to elect members of Leeds City Council in England. [1] It was held on the same day as the 2015 general election and other local elections across the UK.

Contents

As per the election cycle, one third of the council's seats were up for election. The councillors subsequently elected replaced those elected when their individual seats were previously contested in 2011.

No political party gained or lost any seats and the Labour Party retained all 22 of their contested council seats and their majority control of the council since 2011.

Election summary

Leeds City Council Election Result 2015 [2]
PartySeatsGainsLossesNet gain/lossSeats %Votes %Votes+/−
  Labour 2200Steady2.svg66.739.8141,856+1.2
  Conservative 700Steady2.svg21.227.497,710+5.9
  UKIP 000Steady2.svg012.945,953-3.8
  Green 100Steady2.svg3.08.931,657-0.2
  Liberal Democrats 200Steady2.svg6.18.429,955-1.8
  Morley Borough Independent 100Steady2.svg3.01.96,794-0.6
  TUSC 000Steady2.svg00.41,249+0.1
 Alliance for Green Socialism000Steady2.svg00.31,137-0.3
  Monster Raving Loony 000Steady2.svg00.03104+0.03
  Left Unity 000Steady2.svg00.03103+0.03
 A Voice for the Region000Steady2.svg00.0270+0.02

This result had the following consequences for the total number of seats on the council after the elections: [2] [3]

Party2014 electionNew council
Labour 6363
Conservative 1819 [lower-alpha 1]
Liberal Democrats 99
Morley Borough Independent 55
Green 33
Independent 1 [lower-alpha 2] 0
Total9999
Working majority 27  27 

Councillors who did not stand for re-election

Councillor/s who did not stand for re-election (5)
CouncillorWardFirst electedPartyReasonSuccessor
Les Carter [4] Adel & Wharfedale 1973 Conservative stood downCaroline Anderson (Conservative)
Ted Hanley [5] [6] Bramley & Stanningley 2003 Labour stood downJulie Heselwood (Labour)
Joe Marjoram [7] Calverley & Farsley 2008 (as Conservative) Independent stood downAmanda Carter (Conservative)
Katherine Mitchell Temple Newsam 2011 Labour stood downHelen Hayden (Labour)
Vonnie Morgan [8] Killingbeck & Seacroft 2006 Labour stood downCatherine Dobson (Labour)

Ward results

The electoral division results listed below [2] are based on the changes from the 2011 elections, [9] not taking into account any mid-term by-elections or party defections.

Adel & Wharfedale
PartyCandidateVotes%±%
Conservative Caroline Anderson 5,534 46.1 -4.1
Liberal Democrats Cheryl Kebede2,61121.8+0.5
Labour Mark Henley2,23618.6-2.0
UKIP Malcolm Steele9267.7+3.9
Green Emma Carter6965.8+1.7
Majority2,92324.4-4.5
Turnout 12,00375.2
Conservative hold Swing -2.3
Alwoodley
PartyCandidateVotes%±%
Conservative Dan Cohen* 6,472 51.4 -1.9
Labour Keith White3,90731.0-4.4
UKIP Carl McGuire9437.5+0.6
Liberal Democrats Simon Dowling6985.5+5.5
Green Miriam Moss4713.7+3.7
Alliance for Green SocialismBrian Jackson970.8-3.6
Majority2,56520.4+2.5
Turnout 12,58870.3
Conservative hold Swing +1.2
Ardsley & Robin Hood
PartyCandidateVotes%±%
Labour Jack Dunn* 4,301 39.5 -9.2
Conservative Timothy Atkin3,58232.9+9.4
UKIP David Daniel2,23820.5+13.9
Green Jude Omidiran3993.7+3.7
Liberal Democrats Victoria Bishop-Rowe3733.4-2.8
Majority7196.6-18.5
Turnout 10,89362.3
Labour hold Swing -9.3
Armley
PartyCandidateVotes%±%
Labour Jim McKenna* 4,612 48.3 -14.5
UKIP Dave Caldwell2,04021.3+21.3
Conservative Shane Morgan1,31413.7-2.9
Green Nick Crawley1,10811.6-2.7
Liberal Democrats Christine Glover3814.0-3.0
TUSC Carole O'Keefe1031.1+1.1
Majority2,57226.9-19.4
Turnout 9,55854.6
Labour hold Swing -17.9
Beeston & Holbeck
PartyCandidateVotes%±%
Labour Adam Ogilvie* 4,335 53.1 -8.2
UKIP Tony Roberts1,87623.0+13.9
Conservative Robert Winfield1,15814.2-3.6
Green Emma Jaynes4805.9-0.7
Liberal Democrats Kathryn Gagen2002.4-2.8
TUSC Amy Cousens1191.5+1.5
Majority2,45930.1-13.4
Turnout 8,16853.7
Labour hold Swing -11.1
Bramley & Stanningley
PartyCandidateVotes%±%
Labour Julie Heselwood 4,267 45.8 -15.0
UKIP Anne Murgatroyd2,10322.6+22.6
Conservative Alexander Nancolas1,70818.3-1.9
Green Kate Bisson7918.5-1.5
Liberal Democrats Serena Glover3894.2-4.8
TUSC Kevin Pattison600.6+0.6
Majority2,16423.2-17.3
Turnout 9,31857.3
Labour hold Swing -18.8
Burmantofts & Richmond Hill
PartyCandidateVotes%±%
Labour Asghar Khan* 4,222 53.8 +2.2
UKIP Geoff Holloran1,62220.7+20.7
Liberal Democrats David Hollingsworth7379.4-27.1
Conservative Hayley Nancolas7159.1+4.5
Green Neil Seepujak4005.1-2.2
TUSC James Ellis1501.9+1.9
Majority2,60033.1+18.0
Turnout 7,84650.9
Labour hold Swing -9.3
Calverley & Farsley
PartyCandidateVotes%±%
Conservative Amanda Carter 6,005 47.0 -1.1
Labour John Bracken4,65136.4-6.2
UKIP Joe Murgatroyd1,1198.8+8.8
Green Clive Lord 5604.4+4.4
Liberal Democrats Kate Arbuckle4313.4-5.8
Majority1,35410.6+5.1
Turnout 12,76671.2
Conservative hold Swing +2.6
Chapel Allerton
PartyCandidateVotes%±%
Labour Mohammed Rafique* 6,467 58.0 -5.6
Conservative Farzana Arif1,69215.2+1.8
Green Mags Shevlin1,56814.1+6.6
Liberal Democrats Mark Harris8767.9+0.2
Alliance for Green SocialismMike Davies5555.0-2.8
Majority4,77542.8-7.4
Turnout 11,15862.7
Labour hold Swing -3.7
City & Hunslet
PartyCandidateVotes%±%
Labour Patrick Davey* 5,292 44.9 -17.8
Green Ed Carlisle2,69422.8+22.8
Conservative Richard Salt2,32019.6+2.6
UKIP Khalil Kungulilo8086.9+6.9
Liberal Democrats Jahangir Aziz5734.9-15.4
Monster Raving Loony Christopher Worfolk1040.9+0.9
Majority2,59822.0-20.4
Turnout 11,79153.9
Labour hold Swing -20.3
Cross Gates & Whinmoor
PartyCandidateVotes%±%
Labour Pauleen Grahame* 5,012 45.8 -11.1
Conservative David Schofield2,66924.4+1.5
UKIP Darren Oddy2,36321.6+13.7
Green Ben Goldthorpe4894.5+0.6
Liberal Democrats Kate Langwick4003.7-0.5
Majority2,34321.4-12.6
Turnout 10,93361.5
Labour hold Swing -6.3
Farnley & Wortley
PartyCandidateVotes%±%
Green Ann Blackburn* 3,851 36.8 -10.6
Labour John Hardy3,20830.6-6.7
UKIP Gregory McDougall1,99119.0+19.0
Conservative Mohammed Rahman1,15611.0-1.2
Liberal Democrats Robert Jacques2122.0-1.2
TUSC Maddy Steeds580.6+0.6
Majority6436.1-4.1
Turnout 10,47658.7
Green hold Swing -2.0
Garforth & Swillington
PartyCandidateVotes%±%
Labour Mark Dobson* 6,737 57.2 -6.9
Conservative Daniel Farrell3,13726.7-5.7
UKIP Mark Maniatt1,29711.0+11.0
Green Lesley Jeffries3272.8+2.8
Liberal Democrats Mitch Galdas2702.3-1.1
Majority3,60030.6-1.1
Turnout 11,76872.4
Labour hold Swing -0.6
Gipton & Harehills
PartyCandidateVotes%±%
Labour Arif Hussain* 6,187 73.9 -6.3
UKIP Marvin Kushman90410.8+10.8
Conservative Joshua Harvey5546.6-1.1
Liberal Democrats Adam Douglas4134.9-3.5
Green Peter Phizacklea3193.8+3.8
Majority5,28363.1-8.6
Turnout 8,37751.5
Labour hold Swing -8.6
Guiseley & Rawdon
PartyCandidateVotes%±%
Conservative Paul Wadsworth* 6,268 46.6 +3.8
Labour Suzie Shepherd3,67827.3-10.0
UKIP Katherynne Taylor1,50311.2+11.2
Liberal Democrats Cindy Cleasby1,2069.0-1.2
Green Benjamin Hall7995.9-1.0
Majority2,59019.3+13.8
Turnout 13,45473.5
Conservative hold Swing +6.9
Harewood
PartyCandidateVotes%±%
Conservative Rachael Procter* 7,103 60.8 +1.3
Labour Tosin Abbey-Philip2,03517.4+1.8
UKIP Ian Greenberg1,28911.0-8.8
Liberal Democrats Christine Golton6385.5+1.3
Green Janet Heath6245.3+4.3
Majority5,06843.4-2.5
Turnout 11,68976.7
Conservative hold Swing -0.3
Headingley
PartyCandidateVotes%±%
Labour Neil Walshaw* 3,351 40.0 +0.4
Green Joe Salmon2,64731.6+14.0
Conservative Diane Fox1,04312.4+2.9
Liberal Democrats Penny Goodman1,03812.4-15.9
UKIP Claire Wilson-Sharp1621.9+0.9
TUSC Iain Dalton760.9-1.4
A Voice for the RegionBob Buxton700.8+0.8
Majority7048.4-2.9
Turnout 8,38762.7
Labour hold Swing -6.8
Horsforth
PartyCandidateVotes%±%
Conservative Dawn Collins* 5,082 40.1 +6.4
Labour Jake Kelly3,08124.3-3.6
Liberal Democrats Martin Hughes2,48019.5-11.5
UKIP Paul Hellyer1,0478.3+3.0
Green Harriet Regina Barry8736.9+6.9
TUSC Gary McVeigh-Kaye1251.0-1.1
Majority2,00115.8+13.1
Turnout 12,68873.1
Conservative hold Swing +5.0
Hyde Park & Woodhouse
PartyCandidateVotes%±%
Labour Gerry Harper* 4,344 49.7 -7.7
Green Christopher Foren2,29826.3+9.4
Conservative Edward Hardy1,16213.3+4.5
Liberal Democrats Ellen Hudspith4435.1-11.8
UKIP Thomas Aitchinson3794.3+4.3
TUSC Tanis Belsham-Wray1121.3+1.3
Majority2,04623.4-17.0
Turnout 8,73856.6
Labour hold Swing -8.6
Killingbeck & Seacroft
PartyCandidateVotes%±%
Labour Catherine Dobson 4,792 54.8 -18.7
UKIP Phil Moore2,06123.6+23.6
Conservative Beatrice Greenwood1,23514.1-2.5
Green Louise Winrow3504.0+4.0
Liberal Democrats Joanne Binns3043.5-6.4
Majority2,73131.2-25.8
Turnout 8,74253.2
Labour hold Swing -21.2
Kippax & Methley
PartyCandidateVotes%±%
Labour James Lewis* 5,639 49.5 -13.8
Conservative Thomas Crosfill2,87825.3+3.6
UKIP Tina Smith1,93417.0+7.7
Green Emma Dobson5905.2+5.2
Liberal Democrats Carmel Harrison3443.0-2.7
Majority2,76124.3-17.2
Turnout 11,38569.5
Labour hold Swing -8.7
Kirkstall
PartyCandidateVotes%±%
Labour John Illingworth* 4,957 51.7 -12.8
Green Meadow Hudson1,75518.3+8.9
Conservative Matthew Wharton1,18412.3+0.2
UKIP Paul Denner1,01710.6+10.6
Liberal Democrats Johathan Heap5485.7-5.6
TUSC Dean Meehan1331.4+1.4
Majority3,20233.4-19.0
Turnout 9,59461.6
Labour hold Swing -10.9
Middleton Park
PartyCandidateVotes%±%
Labour Judith Blake* 4,974 51.2 -13.3
UKIP Craig Sweaton2,92130.1+30.1
Conservative Zena Lopez1,19912.3-0.9
Green Fiona Love2802.9+2.9
Liberal Democrats Sadie Fisher2372.4-2.5
Left Unity Nick Jones1031.1+1.1
Majority2,05321.1-26.0
Turnout 9,71451.0
Labour hold Swing -21.7
Moortown
PartyCandidateVotes%±%
Labour Rebecca Charlwood* 5,572 44.7 +0.2
Conservative Mark Dodsworth3,47627.9+11.2
Liberal Democrats Darren Finlay1,2329.9-24.3
UKIP Ian Laidlaw9897.9+7.9
Green Benjamin Hinchliffe9797.9+7.9
Alliance for Green SocialismRos Campbell2081.7-2.9
Majority2,09616.8+6.5
Turnout 12,45670.9
Labour hold Swing -5.5
Morley North
PartyCandidateVotes%±%
Morley Borough Independent Bob Gettings* 4,271 37.3 -15.6
Labour Mark Sewards2,50521.9-1.3
Conservative Sophie Tempest2,49621.8+9.1
UKIP Samuel Stead1,48713.0+13.0
Green Deborah Fenney3543.1+3.1
Liberal Democrats Peter Andrews2632.3-0.6
TUSC Karen Cussons780.7+0.7
Majority1,76615.4-14.3
Turnout 11,45464.9
Morley Borough Independent hold Swing -7.2
Morley South
PartyCandidateVotes%±%
Labour Neil Dawson* 3,071 30.5 -2.9
Morley Borough Independent Wyn Kidger2,52325.0-7.6
Conservative Kathleen Ann Tempest2,09620.8+9.2
UKIP Lindon Dove1,70816.9+16.9
Green Claire Hawker3703.7+3.7
Liberal Democrats John Durno MacArthur2032.0-0.8
TUSC Neil Cussons1071.1+1.1
Majority5485.4+4.6
Turnout 10,07860.3
Labour hold Swing +2.4
Otley & Yeadon
PartyCandidateVotes%±%
Liberal Democrats Colin Campbell* 4,347 35.5 -3.1
Labour John Eveleigh3,19326.1-10.6
Conservative John Bale2,20018.0-6.7
UKIP Tom Hollings1,39611.4+11.4
Green Mick Bradley1,0989.0+9.0
Majority1,1549.4+7.5
Turnout 12,23469.5
Liberal Democrats hold Swing +3.8
Pudsey
PartyCandidateVotes%±%
Labour Richard Lewis* 4,935 41.6 -11.8
Conservative Simon Seary4,26635.9+7.0
UKIP Roger Tattersall1,61313.6+4.3
Green Claire Allen6295.3+0.6
Liberal Democrats Jude Arbuckle3543.0-0.8
TUSC Michael Johnson720.6+0.6
Majority6695.6-18.9
Turnout 11,86968.1
Labour hold Swing -9.4
Rothwell
PartyCandidateVotes%±%
Labour Karen Bruce* 4,206 38.6 -7.5
Conservative Steve Ellis2,71524.9+8.7
Liberal Democrats Ben Ward2,13319.6-18.1
UKIP Paul Spivey1,44713.3+13.3
Green Stephen Paul Terry4083.7+3.7
Majority1,49113.7+5.3
Turnout 10,90968.7
Labour hold Swing -8.1
Roundhay
PartyCandidateVotes%±%
Labour Christine MacNiven* 6,178 49.6 -0.7
Conservative Andy Paraskos3,50628.1-5.2
Green Paul Ellis1,0218.2+1.5
UKIP Warren Hendon7736.2+6.2
Liberal Democrats Najeeb Iqbal7025.6-1.1
Alliance for Green SocialismMalcolm Christie2772.2-1.0
Majority2,67221.4+4.4
Turnout 12,45771.5
Labour hold Swing +2.3
Temple Newsam
PartyCandidateVotes%±%
Labour Helen Hayden 4,493 42.9 -11.5
Conservative Elizabeth Hayes3,05929.2-9.6
UKIP Bruce Naylor2,09720.0+20.0
Liberal Democrats Keith Norman4204.0-2.8
Green Nathan Allen4013.8+3.8
Majority1,43413.7-1.8
Turnout 10,47063.6
Labour hold Swing -1.0
Weetwood
PartyCandidateVotes%±%
Liberal Democrats Sue Bentley* 3,790 35.3 -3.8
Labour Alison Garthwaite2,90127.0-4.1
Conservative Dorothy Flynn1,80216.7-2.6
Green Martin Hemingway1,40013.0+4.0
UKIP Mike Cullen8127.5+7.5
TUSC Max Cussons560.5+0.5
Majority8898.3+0.3
Turnout 10,76168.2
Liberal Democrats hold Swing +0.2
Wetherby
PartyCandidateVotes%±%
Conservative Alan Lamb* 6,924 58.4 -1.5
Labour John Lynch2,51721.2-4.6
UKIP Bronwen Cole1,0859.1+2.5
Liberal Democrats Sara Howell7096.0-1.7
Green Sam Murrey6315.3+5.3
Majority4,40737.1+2.9
Turnout 11,86675.3
Conservative hold Swing +1.6

Notes

  1. The Conservatives won Calverley and Farsley ward to regain all three council seats for the ward after Joe Marjoram had previously resigned from the party in July 2013.
  2. Former Conservative councillor Joe Marjoram (Calverley and Farsley) had been an independent since July 2013. He did not stand again for election in 2015.

Related Research Articles

<span class="mw-page-title-main">Pudsey (UK Parliament constituency)</span> Parliamentary constituency in the United Kingdom

Pudsey is a constituency represented in the House of Commons of the UK Parliament since 2010 by Stuart Andrew, a Conservative.

<span class="mw-page-title-main">Leeds City Council</span> Local government body in England

Leeds City Council is the local authority of the City of Leeds in West Yorkshire, England. It is a metropolitan district council, one of five in West Yorkshire and one of 36 in the metropolitan counties of England, and provides the majority of local government services in Leeds. It has the second-largest population of any council in the United Kingdom with approximately 800,000 inhabitants living within its area; only Birmingham City Council has more. Since 1 April 2014, it has been a constituent council of the West Yorkshire Combined Authority.

<span class="mw-page-title-main">2012 Leeds City Council election</span>

The 2012 Leeds City Council election took place on Thursday 3 May 2012 to elect members to Leeds City Council in England. It was held on the same day as other local elections across the UK.

<span class="mw-page-title-main">2010 Leeds City Council election</span>

The 2010 Leeds City Council election took place on Thursday 6 May 2010 to elect members of Leeds City Council in England. It was held on the same day as the 2010 general election and other local elections across the UK.

<span class="mw-page-title-main">2008 Leeds City Council election</span>

The 2008 Leeds City Council election took place on Thursday 1 May 2008 to elect members of Leeds City Council in England.

<span class="mw-page-title-main">2007 Leeds City Council election</span>

The 2007 Leeds City Council election took place on Thursday 3 May 2007 to elect members of Leeds City Council in England.

<span class="mw-page-title-main">2014 Leeds City Council election</span>

The 2014 Leeds City Council election took place on Thursday 22 May 2014 to elect members of Leeds City Council in England. It was held on the same day as the 2014 European Parliament election and other local elections across the UK.

<span class="mw-page-title-main">2016 Leeds City Council election</span>

The 2016 Leeds City Council election took place on Thursday 5 May 2016 to elect members of Leeds City Council in England. It was on the same day as other local elections.

<span class="mw-page-title-main">2018 Leeds City Council election</span>

The 2018 Leeds City Council election took place on Thursday 3 May 2018 to elect members of Leeds City Council in England. It was held on the same day as other UK local elections across England.

<span class="mw-page-title-main">Beeston and Holbeck (ward)</span> Electoral ward in Leeds, England

Beeston and Holbeck is an electoral ward of Leeds City Council in Leeds, West Yorkshire, covering the inner city areas and urban suburbs of Beeston, Cottingley and Holbeck to the south of the city centre.

<span class="mw-page-title-main">Calverley and Farsley (ward)</span> Electoral ward in Leeds, England

Calverley and Farsley is an electoral ward of Leeds City Council in west Leeds, West Yorkshire, including the village of Calverley and town of Farsley.

<span class="mw-page-title-main">Cross Gates and Whinmoor (ward)</span> Electoral ward in Leeds, England

Cross Gates and Whinmoor is an electoral ward of Leeds City Council in east Leeds, West Yorkshire, covering the outer city suburb areas of Cross Gates, Manston, Swarcliffe and Whinmoor. Austhorpe is also shared with Temple Newsam ward to the south.

<span class="mw-page-title-main">Garforth and Swillington (ward)</span> Electoral ward in Leeds, England

Garforth and Swillington is an electoral ward of Leeds City Council in east Leeds, West Yorkshire, covering the town of Garforth as well as the villages of Great Preston and Swillington.

<span class="mw-page-title-main">Hunslet and Riverside (ward)</span> Electoral ward in Leeds, England

Hunslet and Riverside is an electoral ward of Leeds City Council in Leeds, West Yorkshire, largely covering the inner city area of Hunslet to the south of the city centre. It was created in advance of the 2018 council election.

<span class="mw-page-title-main">Roundhay (ward)</span> Electoral ward in Leeds, England

Roundhay is an electoral ward of Leeds City Council in north east Leeds, West Yorkshire, covering the suburb of the same name, Gledhow and Oakwood.

<span class="mw-page-title-main">Temple Newsam (ward)</span> Electoral ward in Leeds, England

Temple Newsam is an electoral ward of Leeds City Council in east Leeds, West Yorkshire, covering the outer city suburbs of Colton, Halton, Halton Moor and Whitkirk. Austhorpe is also shared with Cross Gates and Whinmoor ward, whilst the current civil parish boundaries of Austhorpe see its eastern half lie in the western tip of Garforth and Swillington ward.

The Morley Borough Independents (MBI) are a local political party in Leeds, West Yorkshire, founded in 2004.

<span class="mw-page-title-main">2019 Leeds City Council election</span>

The 2019 Leeds City Council election took place on Thursday 2 May 2019 to elect members of Leeds City Council in England. It was held on the same day as other UK local elections across England and Northern Ireland.

<span class="mw-page-title-main">2021 Leeds City Council election</span>

The 2021 Leeds City Council election took place on Thursday 6 May 2021 to elect members of Leeds City Council in England. It was held on the same day as other local elections across England and the rest of the UK, including the inaugural West Yorkshire mayoral election.

<span class="mw-page-title-main">2022 Leeds City Council election</span>

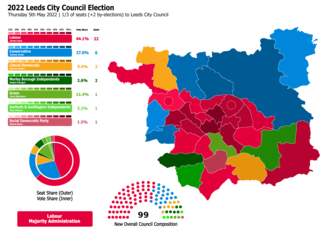
The 2022 Leeds City Council election took place on Thursday 5 May 2022 to elect members of Leeds City Council in England. It was held on the same day as other local elections across the United Kingdom.

References

  1. "Upcoming elections & referendums". The Electoral Commission . Archived from the original on 15 March 2015. Retrieved 23 March 2015.
  2. 1 2 3 "Election results - Local 2015". Leeds City Council . Retrieved 13 September 2015.
  3. Pantry, Lindsay; Roberts, John (8 May 2015). "Yorkshire's council election results in full: Success for Labour and Tories". Yorkshire Post.
  4. "Councillor John Leslie Carter". democracy.leeds.gov.uk. Leeds City Council . Retrieved 10 October 2018.
  5. "Meeting attendance of Councillor Ted Hanley". democracy.leeds.gov.uk. Leeds City Council . Retrieved 2 May 2020.
  6. "Tributes to former Leeds councillor who died aged 71". Yorkshire Evening Post . Retrieved 26 November 2018.
  7. "Councillor Joseph Marjoram". democracy.leeds.gov.uk. Leeds City Council . Retrieved 26 November 2018.
  8. "Councillor Vonnie Morgan". democracy.leeds.gov.uk. Leeds City Council . Retrieved 24 December 2018.
  9. "Election results - Local 2011". Leeds City Council. Archived from the original on 20 April 2016. Retrieved 10 April 2016.