| |||||||||||||||||||||||||||||||||||||||||||||||||||||||||||||
All 39 seats to Derbyshire Dales District Council 20 seats needed for a majority | |||||||||||||||||||||||||||||||||||||||||||||||||||||||||||||
---|---|---|---|---|---|---|---|---|---|---|---|---|---|---|---|---|---|---|---|---|---|---|---|---|---|---|---|---|---|---|---|---|---|---|---|---|---|---|---|---|---|---|---|---|---|---|---|---|---|---|---|---|---|---|---|---|---|---|---|---|---|
| |||||||||||||||||||||||||||||||||||||||||||||||||||||||||||||
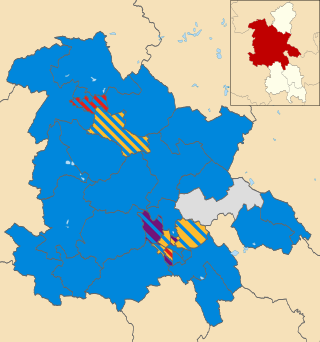
Map showing the composition of Derbyshire Dales District Council following the election. Striped wards have mixed representation. | |||||||||||||||||||||||||||||||||||||||||||||||||||||||||||||
|
The 2015 Derbyshire Dales District Council election was held on 7 May 2015 to elect all 39 members of Derbyshire Dales District Council. [1] This was on the same day as other local elections.
The Conservative Party retained control of the council for the fourth consecutive election, with a majority of 19.
Party | Candidate | Votes | % | ±% | |
---|---|---|---|---|---|
Conservative | Sue Bull | 1,210 | 64.0 | 1.9 | |
Conservative | Tony Millward | 1,035 | |||
Labour | Che Page | 681 | 36.0 | -1.9 | |
Majority | |||||
Turnout | |||||
Conservative hold | Swing | ||||
Party | Candidate | Votes | % | ±% | |
---|---|---|---|---|---|
Conservative | Phil Chell | 1,308 | 53.8 | -11.8 | |
Conservative | Tom Donnelly | 1,187 | |||
Labour | Simon Meredith | 596 | 24.5 | -11.4 | |
Green | Andy White | 527 | 21.7 | 21.7 | |
Majority | |||||
Turnout | |||||
Conservative hold | Swing | ||||
Party | Candidate | Votes | % | ±% | |
---|---|---|---|---|---|
Conservative | Alyson Hill | 1,463 | 44.3 | ||
Conservative | Helen Froggatt | 1,372 | |||
Conservative | Philippa Tilbrook | 1,298 | |||
Green | Ian Wood | 743 | 22.5 | ||
Labour | Jacob Butler | 583 | 17.7 | ||
Labour | Paul Vaughan | 525 | |||
UKIP | Sarah Lamb | 511 | 15.5 | ||
UKIP | Andy Howard | 430 | |||
UKIP | Tilly Ward | 333 | |||
Majority | |||||
Turnout | |||||
Conservative hold | Swing | ||||
Party | Candidate | Votes | % | ±% | |
---|---|---|---|---|---|
Conservative | Chris Furness | 756 | 67.0 | ||
Labour | Nicholas Whitehead | 373 | 33.0 | ||
Majority | |||||
Turnout | |||||
Conservative hold | Swing | ||||
Party | Candidate | Votes | % | ±% | |
---|---|---|---|---|---|
Conservative | Angus Jenkins | Unopposed | n/a | n/a | |
Majority | |||||
Turnout | |||||
Conservative hold | Swing | ||||
Party | Candidate | Votes | % | ±% | |
---|---|---|---|---|---|
Conservative | John Tibenham | 753 | 64.1 | ||
Labour | Barry Nottage | 421 | 35.9 | ||
Majority | |||||
Turnout | |||||
Conservative hold | Swing | ||||
Party | Candidate | Votes | % | ±% | |
---|---|---|---|---|---|
Conservative | Lewis Rose | Unopposed | n/a | n/a | |
Majority | |||||
Turnout | |||||
Conservative hold | Swing | ||||
Party | Candidate | Votes | % | ±% | |
---|---|---|---|---|---|
Conservative | Susan Hobson | Unopposed | n/a | n/a | |
Majority | |||||
Turnout | |||||
Conservative hold | Swing | ||||
Party | Candidate | Votes | % | ±% | |
---|---|---|---|---|---|
Conservative | Andrew Shirley | 727 | 60.4 | ||
Independent | Ian Bates | 298 | 24.8 | ||
UKIP | Richard Stone | 179 | 14.9 | ||
Majority | |||||
Turnout | |||||
Conservative hold | Swing | ||||
Party | Candidate | Votes | % | ±% | |
---|---|---|---|---|---|
Conservative | Jason Atkin | 1,264 | 36.6 | ||
Conservative | Andrew Statham | 1,099 | |||
Conservative | Mark Salt | 1,089 | |||
Independent | John Evans | 830 | 24.0 | ||
Labour | Julie Morrison | 766 | 22.2 | ||
Labour | Pam Butler | 731 | |||
Independent | Maresa Mellor | 637 | |||
Independent | David Smith | 610 | |||
UKIP | Michael Hancocks | 595 | 17.2 | ||
UKIP | Marco Taaffe | 359 | |||
UKIP | Martin Sneap | 349 | |||
Majority | |||||
Turnout | |||||
Conservative gain from Liberal Democrats | Swing | ||||
Conservative hold | Swing | ||||
Conservative gain from Liberal Democrats | Swing | ||||
Party | Candidate | Votes | % | ±% | |
---|---|---|---|---|---|
Conservative | Richard FitzHerbert | Unopposed | n/a | n/a | |
Majority | |||||
Turnout | |||||
Conservative hold | Swing | ||||
Party | Candidate | Votes | % | ±% | |
---|---|---|---|---|---|
Conservative | Albert Catt | 873 | 75.0 | ||
UKIP | Joe Hogan | 291 | 25.0 | ||
Majority | |||||
Turnout | |||||
Conservative hold | Swing | ||||
Party | Candidate | Votes | % | ±% | |
---|---|---|---|---|---|
Conservative | David Chapman | Unopposed | n/a | n/a | |
Majority | |||||
Turnout | |||||
Conservative hold | Swing | ||||
Party | Candidate | Votes | % | ±% | |
---|---|---|---|---|---|
Conservative | Jean Monks | 1,232 | 55.3 | ||
Conservative | Vicky Massey | 1,228 | |||
Labour | Elizabeth Coe | 998 | 44.7 | ||
Labour | Peter O'Brien | 971 | |||
Majority | |||||
Turnout | |||||
Conservative hold | Swing | ||||
Party | Candidate | Votes | % | ±% | |
---|---|---|---|---|---|
Conservative | Richard Bright | Unopposed | n/a | n/a | |
Majority | |||||
Turnout | |||||
Conservative hold | Swing | ||||
Party | Candidate | Votes | % | ±% | |
---|---|---|---|---|---|
Independent | Graham Elliott | 582 | 62.3 | ||
Independent | David Frederickson | 352 | 37.7 | ||
Majority | |||||
Turnout | |||||
Independent gain from Independent | Swing | ||||
Party | Candidate | Votes | % | ±% | |
---|---|---|---|---|---|
Conservative | Neil Horton | Unopposed | n/a | n/a | |
Majority | |||||
Turnout | |||||
Conservative hold | Swing | ||||
Party | Candidate | Votes | % | ±% | |
---|---|---|---|---|---|
Conservative | Garry Purdy | 946 | 56.1 | ||
Labour | Joyce Pawley | 741 | 43.9 | ||
Conservative | Richard Walsh | 686 | |||
Labour | Ian Page | 653 | |||
Majority | |||||
Turnout | |||||
Conservative hold | Swing | ||||
Labour hold | Swing | ||||
Party | Candidate | Votes | % | ±% | |
---|---|---|---|---|---|
Liberal Democrats | Susan Burfoot | 1,341 | 42.2 | ||
Liberal Democrats | Martin Burfoot | 1,164 | |||
Conservative | Ann Elliott | 1,065 | 33.6 | ||
Conservative | Geoff Stevens | 1,044 | |||
Conservative | Sam Gregory | 948 | |||
Liberal Democrats | David Jones | 849 | |||
Labour | Jane Littlechilds | 768 | 24.2 | ||
Labour | John Cowings | 763 | |||
Majority | |||||
Turnout | |||||
Liberal Democrats hold | Swing | ||||
Liberal Democrats gain from Conservative | Swing | ||||
Conservative hold | Swing | ||||
Party | Candidate | Votes | % | ±% | |
---|---|---|---|---|---|
Liberal Democrats | Steve Flitter | 1,061 | 31.3 | ||
Labour | Deborah Botham | 959 | 28.3 | ||
Conservative | Jacquie Stevens | 924 | 27.3 | ||
Conservative | Dan Hopkinson | 840 | |||
Liberal Democrats | Derek Woodward | 738 | |||
Labour | Isobel Fisher | 711 | |||
Conservative | Jeff Sterland | 711 | |||
Labour | James Ilott | 689 | |||
Liberal Democrats | Barry Hopkinson | 683 | |||
UKIP | Fred Richardson | 444 | 13.1 | ||
UKIP | Adrian Ward | 365 | |||
UKIP | Rachel Roberts | 311 | |||
Majority | |||||
Turnout | |||||
Liberal Democrats hold | Swing | ||||
Labour gain from Conservative | Swing | ||||
Conservative hold | Swing | ||||
Party | Candidate | Votes | % | ±% | |
---|---|---|---|---|---|
Conservative | Tony Morley | 799 | 76.8 | ||
UKIP | Michael Cruddas | 241 | 23.2 | ||
Majority | |||||
Turnout | |||||
Conservative hold | Swing | ||||
Party | Candidate | Votes | % | ±% | |
---|---|---|---|---|---|
Conservative | Jo Wild | Unopposed | n/a | n/a | |
Majority | |||||
Turnout | |||||
Conservative hold | Swing | ||||
Party | Candidate | Votes | % | ±% | |
---|---|---|---|---|---|
Conservative | Jennifer Bower | 655 | 62.1 | ||
Labour | Angus McLardy | 400 | 37.9 | ||
Majority | |||||
Turnout | |||||
Conservative hold | Swing | ||||
Party | Candidate | Votes | % | ±% | |
---|---|---|---|---|---|
Independent | Colin Swindell | Unopposed | n/a | n/a | |
Majority | |||||
Turnout | |||||
Independent gain from Labour | Swing | ||||
Party | Candidate | Votes | % | ±% | |
---|---|---|---|---|---|
Labour | Irene Ratcliffe | 1,642 | 41.2 | ||
Labour | Mike Ratcliffe | 1,353 | |||
Labour | Pete Slack | 1,237 | |||
Conservative | Gladwyn Gratton | 1,096 | 27.5 | ||
Green | Josh Stockwell | 668 | 16.8 | ||
Green | Ivan Dixon | 599 | |||
UKIP | Michael Hawley | 578 | 14.5 | ||
Green | John Youatt | 280 | |||
Majority | |||||
Turnout | |||||
Labour hold | Swing | ||||
Party | Candidate | Votes | % | ±% | |
---|---|---|---|---|---|
Conservative | Dermot Murphy | 495 | 46.2 | -7.6 | |
Liberal Democrats | Rebecca Goodall | 334 | 31.2 | +31.2 | |
Labour | Andy White | 242 | 22.6 | -1.9 | |
Majority | 161 | 15.0 | |||
Turnout | 1,071 | ||||
Conservative hold | Swing | ||||
South Staffordshire District Council elections are held every four years. South Staffordshire District Council is the local authority for the non-metropolitan district of South Staffordshire in Staffordshire, England. Since the last boundary changes in 2023, 42 councillors have been elected from 20 wards.
Maldon District Council in Essex, England is elected every four years.
Lichfield District Council elections are held every four years. Lichfield District Council is the local authority for the non-metropolitan district of Lichfield in Staffordshire, England. Since the last boundary changes in 2015, 47 councillors have been elected from 22 wards.
Ashfield District Council elections are held every four years. Ashfield District Council is the local authority for the non-metropolitan district of Ashfield in Nottinghamshire, England. Since the last boundary changes in 2015, 35 councillors are elected from 23 wards.
Aylesbury Vale District Council was the council for the non-metropolitan district of Aylesbury Vale in Buckinghamshire, England, which existed as a local government area from 1974 to 2020. The council was elected every four years from 1973 until 2020. At the time of its abolition, the council had 59 councillors, elected from 33 wards.
Broxtowe Borough Council elections are held every four years. Broxtowe Borough Council is the local authority for the non-metropolitan district of Borough of Broxtowe in Nottinghamshire, England. Since the full review of boundaries in 2015, 44 councillors are elected from 20 wards.
Staffordshire Moorlands District Council elections are held every four years. Staffordshire Moorlands District Council is the local authority for the non-metropolitan district of Staffordshire Moorlands in Staffordshire, England. Since the last boundary changes in 2003, 56 councillors have been elected from 27 wards.
Mansfield District Council elections are held every four years. Mansfield District Council is the local authority for the non-metropolitan district of Mansfield in Nottinghamshire, England. Since 2002 Mansfield has also had a directly elected mayor. Since the last boundary changes in 2023, 36 councillors have been elected from 36 wards.
South Derbyshire District Council elections are held every four years. South Derbyshire District Council is the local authority for the non-metropolitan district of South Derbyshire in Derbyshire, England. Since the last boundary changes in 2011, 36 councillors have been elected from 15 wards.
North East Derbyshire District Council elections are held every four years. North East Derbyshire District Council is the local authority for the non-metropolitan district of North East Derbyshire in Derbyshire, England. Since the last boundary changes in 2019, 53 councillors have been elected from 24 wards.
North Kesteven District Council in Lincolnshire, England is elected every four years.
South Ribble Borough Council elections are held every four years. South Ribble Borough Council is the local authority for the non-metropolitan district of South Ribble in Lancashire, England. Since the last boundary changes in 2015, 50 councillors have been elected from 23 wards. The next borough council elections are due to take place in 2027 as part of the wider 2027 United Kingdom local elections.
Mid Sussex District Council is elected every four years.
East Staffordshire Borough Council elections are held every four years. East Staffordshire is a non-metropolitan district with borough status in Staffordshire, England. The Borough Council area of East Staffordshire covers three main settlements such as Burton-Upon-Trent, Uttoxeter and Tutbury, as well several rural towns and villages, such as Barton-under-Needwood, Stramshall, Weaver, Draycott in the Clay, Rolleston-on-Dove, Needwood and Abbots Bromley.
Newcastle-under-Lyme Borough Council elections are held every four years. Newcastle-under-Lyme Borough Council is the local authority for the non-metropolitan district of Newcastle-under-Lyme in Staffordshire, England. Since the last boundary changes in 2018, 47 councillors have been elected from 21 wards. Prior to 2018 elections were held three years out of every four, with a third of the council elected each time.
Rushcliffe Borough Council elections are held every four years. Rushcliffe Borough Council is the local authority for the non-metropolitan district of Rushcliffe in Nottinghamshire, England. Since the last boundary changes in 2023 the council has comprised 44 councillors representing 24 wards, with each ward electing one, two or three councillors.
Erewash Borough Council elections are held every four years. Erewash Borough Council is the local authority for the non-metropolitan district of Erewash in Derbyshire, England. Since the last boundary changes in 2015, 47 councillors are elected from 19 wards.
Nottingham City Council elections are held every four years. Nottingham City Council is the local authority for the unitary authority of Nottingham in Nottinghamshire, England. Until 1 April 1998 it was a non-metropolitan district. Since the last boundary changes in 2019, 55 councillors are elected from 20 wards.
North Warwickshire Borough Council elections are held every four years. North Warwickshire Borough Council is the local authority for the non-metropolitan district of North Warwickshire in Warwickshire, England. Since the last boundary changes in 2003, 35 councillors have been elected from 17 wards.
The 2019 Derbyshire Dales District Council election was held on 2 May 2019 to elect all 39 councillors for Derbyshire Dales District Council. This was on the same day as other local elections.