This article needs additional citations for verification .(March 2023) |
![]() | |||||||||||||||||||||||||
| |||||||||||||||||||||||||
15 of 45 seats for Amber Valley Borough Council 23 seats needed for a majority | |||||||||||||||||||||||||
---|---|---|---|---|---|---|---|---|---|---|---|---|---|---|---|---|---|---|---|---|---|---|---|---|---|
| |||||||||||||||||||||||||
![]() Map of the results of the 2016 Amber Valley Borough council election. Labour in red and Conservatives in blue. Blank wards were not contested in 2016. |
Elections to Amber Valley Borough Council in Derbyshire, England took place on Thursday 5 May 2016. One third of the council seats were up for election and after the election the Conservative Party continued to hold overall control of the council. [1]
After the election, the composition of the council was:
Party | Seats | Gains | Losses | Net gain/loss | Seats % | Votes % | Votes | +/− | |
---|---|---|---|---|---|---|---|---|---|
Labour | 11 | 2 | 1 | +1 | 73.3 | 40.6 | 9,800 | ||
Conservative | 4 | 1 | 2 | -1 | 27.7 | 34.9 | 8,418 | ||
UKIP | 0 | 0 | 0 | 0 | 0 | 16.8 | 4,047 | ||
Green | 0 | 0 | 0 | 0 | 0 | 4.6 | 1,101 | ||
Liberal Democrats | 0 | 0 | 0 | 0 | 0 | 2.5 | 592 | ||
Independent | 0 | 0 | 0 | 0 | 0 | 0.5 | 131 | ||
National Front | 0 | 0 | 0 | 0 | 0 | 0.1 | 29 | ||
Source: [2]
Percentage change in party votes are from the last time the ward was contested. This is either 2014 or 2015.
Party | Candidate | Votes | % | ±% | |
---|---|---|---|---|---|
Labour | Marlene Bennett | 981 | 53.2 | +7.6 | |
Conservative | Kat Moss | 360 | 19.5 | -8.1 | |
UKIP | Pete Twiname | 342 | 18.6 | -1.6 | |
Liberal Democrats | Henry Foulds | 91 | 4.9 | +1.5 | |
Green | Leo Swarvett | 53 | 2.9 | -0.3 | |
Rejected ballots | 15 | ||||
Majority | 621 | 33.7 | |||
Turnout | 1842 | ||||
Labour hold | Swing | ||||
Party | Candidate | Votes | % | ±% | |
---|---|---|---|---|---|
Labour | Maurice Neville | 761 | 41.7 | +10.4 | |
Conservative | John Nelson | 627 | 34.4 | -8.4 | |
Green | Dave Wells | 151 | 8.3 | -4.6 | |
UKIP | John Young | 149 | 8.2 | -4.8 | |
Independent | Dave Fisher | 131 | 7.2 | +7.2 | |
Rejected ballots | 4 | ||||
Majority | 134 | 7.3 | |||
Turnout | 1823 | ||||
Labour gain from Conservative | Swing | ||||
Party | Candidate | Votes | % | ±% | |
---|---|---|---|---|---|
Labour | Ben Bellamy | 662 | 37.8 | +12.7 | |
Conservative | Alan Cox | 576 | 32.9 | -9.1 | |
Green | Sue MacFarlane | 307 | 17.5 | -0.1 | |
UKIP | Dennis Smith | 160 | 9.1 | -6.2 | |
Liberal Democrats | Richard Salmon | 35 | 2.0 | +2.0 | |
Rejected ballots | 11 | ||||
Majority | 86 | 4.9 | |||
Turnout | 1751 | ||||
Labour gain from Conservative | Swing | ||||
Party | Candidate | Votes | % | ±% | |
---|---|---|---|---|---|
Labour | Christopher Emmas-Williams | 702 | 53.4 | +11.5 | |
Conservative | Linda Edwards-Milsom | 337 | 25.6 | +0.8 | |
UKIP | Gaz Smith | 212 | 16.1 | -12.1 | |
Green | Jackie Blackett | 37 | 2.8 | +2.8 | |
Liberal Democrats | Fay Whitehead | 21 | 1.6 | -0.7 | |
Rejected ballots | 5 | ||||
Majority | 365 | 27.8 | |||
Turnout | 1314 | ||||
Labour hold | Swing | ||||
Party | Candidate | Votes | % | ±% | |
---|---|---|---|---|---|
Conservative | Angela Ward | 749 | 46.7 | +4.5 | |
Labour | Paul Lobley | 579 | 36.1 | +1.4 | |
UKIP | Ian Gillatt | 168 | 10.5 | -4.2 | |
Green | William MacFarlane | 69 | 4.3 | -1.1 | |
Liberal Democrats | Audrey Wootton | 36 | 2.2 | -0.8 | |
Rejected ballots | 3 | ||||
Majority | 170 | 10.6 | |||
Turnout | 1604 | ||||
Conservative hold | Swing | ||||
Party | Candidate | Votes | % | ±% | |
---|---|---|---|---|---|
Labour | Kieran Hill | 541 | 40.1 | -0.1 | |
UKIP | Geoffrey Aldwinckle | 370 | 27.4 | -6.9 | |
Conservative | Julie Whitmore | 349 | 25.9 | +3.4 | |
Green | James Brooks | 42 | 3.1 | +3.1 | |
Liberal Democrats | James Morton | 37 | 2.7 | -0.3 | |
Rejected ballots | 9 | ||||
Majority | 171 | 12.7 | |||
Turnout | 1348 | ||||
Labour hold | Swing | ||||
Party | Candidate | Votes | % | ±% | |
---|---|---|---|---|---|
Labour | Sheila Oakes | 536 | 38.2 | -4.8 | |
Conservative | Mark Burrell | 425 | 30.3 | +4.3 | |
UKIP | Philip Rose | 342 | 24.4 | -3.7 | |
Green | Julie Wozniczka | 49 | 3.5 | +3.5 | |
Liberal Democrats | George White | 42 | 3.0 | 0.0 | |
Rejected ballots | 10 | ||||
Majority | 111 | 7.9 | |||
Turnout | 1404 | ||||
Labour hold | Swing | ||||
Party | Candidate | Votes | % | ±% | |
---|---|---|---|---|---|
Labour | Teresa Curran | 597 | 42.2 | +1.8 | |
Conservative | Steven Grainger | 401 | 28.4 | +5.4 | |
UKIP | Chris Flude | 325 | 23.0 | -9.5 | |
Liberal Democrats | Joel Hunt | 43 | 3.0 | -1.1 | |
Green | Mike Jones | 38 | 2.7 | +2.7 | |
Rejected ballots | 10 | ||||
Majority | 196 | 13.8 | |||
Turnout | 1414 | ||||
Labour hold | Swing | ||||
Party | Candidate | Votes | % | ±% | |
---|---|---|---|---|---|
Conservative | Jack Brown | 630 | 40.7 | +8.8 | |
Labour | Paul Wardle | 616 | 39.8 | -8.1 | |
UKIP | Stuart Bent | 227 | 14.7 | -3.2 | |
Green | Steve Kennedy | 37 | 2.4 | +2.4 | |
Liberal Democrats | Ollie Smith | 30 | 1.9 | -0.4 | |
Rejected ballots | 8 | ||||
Majority | 14 | 0.9 | |||
Turnout | 1548 | ||||
Conservative gain from Labour | Swing | ||||
Party | Candidate | Votes | % | ±% | |
---|---|---|---|---|---|
Conservative | Charles Norman Bull | 1086 | 47.5 | -2.2 | |
Labour | Christine Venables | 691 | 30.2 | +3.0 | |
UKIP | Roy Snape | 312 | 13.6 | -1.3 | |
Green | Kate Howard | 102 | 4.5 | -0.1 | |
Liberal Democrats | Ron Welsby | 90 | 3.9 | +0.2 | |
Rejected ballots | 7 | ||||
Majority | 395 | 17.3 | |||
Turnout | 2288 | ||||
Conservative hold | Swing | ||||
Party | Candidate | Votes | % | ±% | |
---|---|---|---|---|---|
Labour | Brian Gration | 486 | 43.5 | -0.1 | |
Conservative | Rosie Webster | 363 | 32.5 | +8.7 | |
UKIP | Tony Warren | 219 | 19.6 | -10.6 | |
Green | Christina Smith | 15 | 1.3 | +1.3 | |
Liberal Democrats | Ruth Thornton | 14 | 1.3 | -1.2 | |
National Front | Timothy Knowles | 14 | 1.3 | +1.3 | |
Rejected ballots | 5 | ||||
Majority | 123 | 11.0 | |||
Turnout | 1116 | ||||
Labour hold | Swing | ||||
Party | Candidate | Votes | % | ±% | |
---|---|---|---|---|---|
Labour | Mick Wilson | 640 | 41.9 | +5.6 | |
Conservative | Matt Murray | 560 | 36.6 | -5.9 | |
UKIP | John Pass | 237 | 15.5 | +0.3 | |
Green | Tony Youens | 46 | 3.0 | -0.6 | |
Liberal Democrats | Clym Stock-Williams | 25 | 1.6 | -0.8 | |
National Front | Michael Sharpe | 15 | 1.0 | +1.0 | |
Rejected ballots | 5 | ||||
Majority | 80 | 5.3 | |||
Turnout | 1528 | ||||
Labour hold | Swing | ||||
Party | Candidate | Votes | % | ±% | |
---|---|---|---|---|---|
Labour | Tony Holmes | 869 | 40.1 | +5.4 | |
Conservative | Sean Carter | 845 | 39.0 | -1.6 | |
UKIP | Paula Parkin | 345 | 15.9 | -2.0 | |
Green | Phil Taylor | 55 | 2.5 | -1.1 | |
Liberal Democrats | Peter Jelf | 43 | 2.0 | -1.1 | |
Rejected ballots | 8 | ||||
Majority | 24 | 1.1 | |||
Turnout | 2165 | ||||
Labour hold | Swing | ||||
Party | Candidate | Votes | % | ±% | |
---|---|---|---|---|---|
Conservative | Alex Stevenson | 945 | 51.6 | +10.8 | |
Labour | Antony Tester | 404 | 22.1 | +1.7 | |
UKIP | Ade Nathan | 348 | 19.0 | -9.2 | |
Green | Matt McGuinness | 68 | 3.7 | +3.7 | |
Liberal Democrats | Kate Smith | 56 | 3.1 | -2.0 | |
Rejected ballots | 10 | ||||
Majority | 541 | 29.5 | |||
Turnout | 1831 | ||||
Conservative hold | Swing | ||||
Party | Candidate | Votes | % | ±% | |
---|---|---|---|---|---|
Labour | John McCabe | 735 | 58.4 | +1.5 | |
UKIP | Paul Price | 291 | 23.1 | -1.5 | |
Conservative | Colin Boyce | 165 | 13.1 | -2.0 | |
Green | Steve Elliott | 32 | 2.5 | +2.5 | |
Liberal Democrats | Elsie Situnayake | 29 | 2.3 | -1.0 | |
Rejected ballots | 6 | ||||
Majority | 444 | 25.3 | |||
Turnout | 1258 | ||||
Labour hold | Swing | ||||
Amber Valley is a local government district with borough status in the east of Derbyshire, England, taking its name from the River Amber. Its council is based in Ripley. The district covers a semi-rural area lying to the north of the city of Derby. The district contains four main towns whose economy was based on coal mining and remains to some extent influenced by engineering, distribution and manufacturing, holding for instance the headquarters and production site of Thorntons confectionery.
Amber Valley is a constituency in Derbyshire, represented in the House of Commons of the UK Parliament since 2010 by Nigel Mills, a Conservative.
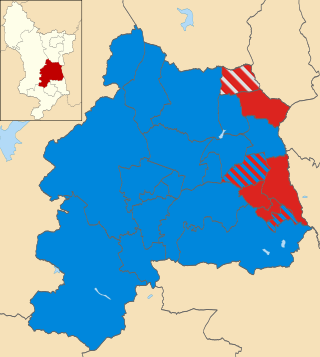
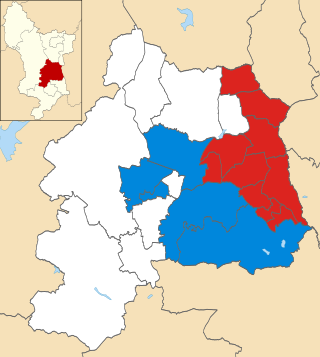
Amber Valley Borough Council elections are held every four years to elect councillors to Amber Valley Borough Council, the local authority for the non-metropolitan district of Amber Valley in Derbyshire, England. Since the last boundary changes in 2023, 42 councillors have been elected to represent 18 wards. Prior to 2023 a third of the council was elected three years out of every four.
Derbyshire County Council is the upper-tier local authority for the non-metropolitan county of Derbyshire in England. The council is based at County Hall in Matlock. Since 2017 the council has been under Conservative majority control.
The 1999 Amber Valley Borough Council election took place on 6 May 1999 to elect members of Amber Valley Borough Council in Derbyshire, England. One third of the council was up for election and the Labour Party stayed in overall control of the council.
The 2000 Amber Valley Borough Council election took place on 4 May 2000 to elect members of Amber Valley Borough Council in Derbyshire, England. The whole council was up for election with boundary changes since the last election in 1999 increasing the number of seats by 2. The Conservative Party gained control of the council from the Labour Party.
Elections to Amber Valley Borough Council were held on 2 May 2002. One third of the council was up for election and the Conservative Party held overall control of the council.
Elections to Amber Valley Borough Council were held on 1 May 2003. One third of the council was up for election and the Conservative Party held overall control of the council.
Elections to Amber Valley Borough Council were held on 10 June 2004. One third of the council was up for election and the Conservative Party held overall control of the council. Overall turnout was 44%.
Elections to Amber Valley Borough Council were held on 4 May 2006. One third of the council was up for election and the Conservative Party held overall control of the council. Overall turnout was 34%.
Elections to Amber Valley Borough Council were held on 3 May 2007. One third of the council was up for election and the Conservative Party held overall control of the council. Overall turnout was 37.7%.
Elections to Amber Valley Borough Council in Derbyshire, England were held on 1 May 2008. One third of the council was up for election and the Conservative Party held overall control of the council.
Local elections were held in the United Kingdom in 1980. These were the first annual local elections for the new Conservative Prime Minister Margaret Thatcher. Though the Conservatives in government lost seats, the projected share of the vote was close: Labour Party 42%, Conservative Party 40%, Liberal Party 13%. Labour were still being led by the former prime minister James Callaghan, who resigned later in the year to be succeeded by Michael Foot.
The 2010 Amber Valley Borough Council election took place on 6 May 2010 to elect members of Amber Valley Borough Council in Derbyshire, England. One third of the council was up for election and the Conservative Party stayed in overall control of the council.
The 2011 Amber Valley Borough Council election took place on 5 May 2011 to elect members of Amber Valley Borough Council in Derbyshire, England. One third of the council was up for election and the Conservative Party stayed in overall control of the council.
Elections to Amber Valley Borough Council in Derbyshire, England took place on Thursday 3 May 2012. One third of the council was up for election and the Conservative Party held overall control of the council. Overall turnout in this election was 33.28 per cent.
The 2015 Amber Valley Borough Council election took place on 7 May 2015 to elect members of Amber Valley Borough Council in England. This was on the same day as other local elections. The Conservatives gained two seats and thereby retook control of the council.
Elections to Amber Valley Borough Council in Derbyshire, England took place on Thursday 2 May 2019. One third of the council seats were up for election. The Labour Party gained overall control of the council, taking a total of five seats from the Conservatives. In addition, the Green Party gained representation for the first time. After the election, the composition of the council was:-
The 2021 elections to Amber Valley Borough Council were held on Wednesday 5th May 2021, 16 seats in the council were up for election. The Conservative Party retook control of the council from The Labour Party after losing control in 2019. These seats were due to have been contested in 2020, but the elections were delayed by a year due to the COVID-19 pandemic along with other elections.
The elections to Amber Valley Borough Council in Derbyshire, England took place on Thursday 5th May 2022. One third of the council were up for election. The Conservatives increased their majority on the council whilst the Green Party also gained seats.