| |||||||||||||||||||||||||||||
| |||||||||||||||||||||||||||||
Turnout | 31.8% | ||||||||||||||||||||||||||||
---|---|---|---|---|---|---|---|---|---|---|---|---|---|---|---|---|---|---|---|---|---|---|---|---|---|---|---|---|---|
| |||||||||||||||||||||||||||||
Map showing the results of the 2016 NBBC election | |||||||||||||||||||||||||||||
|
The 2016 Nuneaton and Bedworth Borough Council election was held on 5 May 2016 as part of the 2016 United Kingdom local elections and alongside the 2016 Warwickshire Police and Crime Commissioner election. [1] As part of the staggered four-year election cycle, half of the borough council was up for re-election in addition to a vacant seat in the Exhall ward. Overall this meant that eighteen council seats were contested. [2]
Prior to the election, Nuneaton and Bedworth was seen to be a "swing council" that was expected to see a drop in support for the Labour Party due to the perceived unpopularity of party leader Jeremy Corbyn. Despite losing some seats and seeing a reduced share of the popular vote, Labour retained their majority on the council. [3] Among the seats up for election, they won twelve. The Conservative Party won five and the Green Party won one.
Total voting figures reflect that voters in the Exhall ward were entitled to cast two ballots. Change is compared to the 2012 Nuneaton and Bedworth Borough Council election but includes the vacant Exhall seat last elected in the 2014 election.
Party | Seats | Gains | Losses | Net gain/loss | Seats % | Votes % | Votes | +/− | |
---|---|---|---|---|---|---|---|---|---|
Labour | 12 | 0 | 3 | 3 | 66.7 | 40.3 | 12,835 | ||
Conservative | 5 | 3 | 0 | 3 | 27.8 | 32.7 | 10,409 | ||
Green | 1 | 0 | 0 | 5.6 | 11.0 | 3,512 | |||
UKIP | 0 | 0 | 0 | 0.0 | 14.8 | 4,699 | |||
TUSC | 0 | 0 | 0 | 0.0 | 0.6 | 193 | |||
English Democrat | 0 | 0 | 0 | 0.0 | 0.2 | 63 | |||
Independent | 0 | 0 | 0 | 0.0 | 0.4 | 124 |
Despite losing, the Labour Party retained their major and control of the council.
After 2014 election | After 2016 election | ||||
---|---|---|---|---|---|
Party | Seats | Party | Seats | ||
Labour | 28 | Labour | 25 | ||
Conservative | 3 | Conservative | 6 | ||
Green | 2 | Green | 2 | ||
Independent | 1 | Independent | 1 |
Turnout figures exclude invalid ballots. Swing is calculated between the winning candidate and the candidate finishing second.
Party | Candidate | Votes | % | ±% | |
---|---|---|---|---|---|
Labour | Jill Sheppard | 1,055 | 55.1 | 10.8 | |
Conservative | Sajid Sayed | 339 | 17.7 | 0.9 | |
UKIP | Susan Edwards | 311 | 16.3 | 16.3 | |
Green | Sophie Bonner | 141 | 7.4 | 2.0 | |
TUSC | George Clark | 67 | 3.5 | 3.5 | |
Majority | 716 | 37.4 | |||
Turnout | 1,913 | 31.8 | |||
Labour hold | Swing | 4.9 | |||
Party | Candidate | Votes | % | ±% | |
---|---|---|---|---|---|
Conservative | Clare Golby | 701 | 43.3 | 10.7 | |
Labour | Jack Bonner | 578 | 35.7 | 21.7 | |
UKIP | Andrew Hutchings | 249 | 15.4 | 15.4 | |
Green | Andrew Saffrey | 90 | 5.6 | 4.4 | |
Majority | 123 | 7.6 | |||
Turnout | 1,618 | 30.8 | |||
Conservative gain from Labour | Swing | 16.2 | |||
Party | Candidate | Votes | % | ±% | |
---|---|---|---|---|---|
Labour | June Tandy | 627 | 38.8 | 12.6 | |
Conservative | Jamie Cummings | 617 | 38.2 | 2.1 | |
UKIP | Andrew Arnold | 251 | 15.6 | 15.6 | |
Green | Margaret Morrissey | 93 | 5.8 | 5.8 | |
English Democrat | Stephen Paxton | 26 | 1.6 | 1.6 | |
Majority | 10 | 0.6 | |||
Turnout | 1614 | 29.1 | |||
Labour hold | Swing | 5.3 | |||
Party | Candidate | Votes | % | ±% | |
---|---|---|---|---|---|
Labour | Gwynne Pomfrett | 677 | 47.2 | 8.9 | |
Conservative | Jeffrey Clarke | 429 | 29.9 | 13.7 | |
UKIP | Dean Buffin | 254 | 17.7 | 17.7 | |
Green | Theresa Brookes | 73 | 5.1 | 5.1 | |
Majority | 248 | 17.3 | |||
Turnout | 1,433 | 26.7 | |||
Labour hold | Swing | 11.3 | |||
Party | Candidate | Votes | % | ±% | |
---|---|---|---|---|---|
Labour | William Hancox | 922 | 56.5 | 13.9 | |
UKIP | Craig Carpenter | 339 | 20.8 | 20.8 | |
Conservative | Damon Brown | 333 | 20.4 | 6.8 | |
English Democrat | David Lane | 37 | 2.3 | 4.9 | |
Majority | 583 | 35.7 | |||
Turnout | 1,631 | 32.3 | |||
Labour hold | Swing | 17.3 | |||
Party | Candidate | Votes | % | ±% | |
---|---|---|---|---|---|
Labour | John Beaumont | 810 | 40.9 | 9.9 | |
Conservative | Hayden Walmsley | 726 | 36.7 | 12.5 | |
UKIP | Trevor Beard | 444 | 22.4 | 22.4 | |
Majority | 84 | 4.2 | |||
Turnout | 1,980 | 39.6 | |||
Labour hold | Swing | 1.3 | |||
Party | Candidate | Votes | % | ±% | |
---|---|---|---|---|---|
Labour | Ian Lloyd | 649 | 48.7 | 15.0 | |
UKIP | John Allbright | 337 | 25.3 | 25.3 | |
Conservative | Thomas Porter | 236 | 17.7 | 0.4 | |
Green | Edward Johnson | 70 | 5.3 | 5.3 | |
TUSC | Paul Reilly | 40 | 3.0 | 6.7 | |
Majority | 312 | 23.4 | |||
Turnout | 1,332 | 23.4 | |||
Labour hold | Swing | 20.1 | |||
Exhall elected two councillors at this election. Doughty was elected to a four-year term and Pomfrett was elected to a two-year term. The percentage figures given reflect that voters could cast two ballots (i.e. they are not a percentage of every vote cast) and will add up to 200% as a result. Due to the nature of the election, swing calculations are not possible.
Party | Candidate | Votes | % | ±% | |
---|---|---|---|---|---|
Labour | Sara Doughty | 838 | 51.1 | ||
Labour | Margaret Pomfrett | 720 | 43.9 | ||
UKIP | Michael Gee | 452 | 27.6 | ||
Conservative | Barry Hallam-Lobbett | 353 | 21.5 | ||
Conservative | Peter Woodward Gregg | 324 | 19.8 | ||
UKIP | Tracy Powis | 299 | 18.2 | ||
Green | Merle Gering | 229 | 14.0 | ||
TUSC | Margaret Hunter | 65 | 4.0 | ||
Majority | 7.2 | ||||
Turnout | 1,640 | 26.9 | |||
Labour hold | Swing | ||||
Party | Candidate | Votes | % | ±% | |
---|---|---|---|---|---|
Conservative | Daniel Gissane | 609 | 36.7 | 9.3 | |
Labour | Paul Hickling | 565 | 34.1 | 19.9 | |
UKIP | Anthony Grant | 407 | 24.5 | 24.5 | |
Green | Christopher Brookes | 78 | 4.7 | 4.7 | |
Majority | 44 | 2.6 | |||
Turnout | 1,659 | 27.7 | |||
Conservative gain from Labour | Swing | 5.3 | |||
Party | Candidate | Votes | % | ±% | |
---|---|---|---|---|---|
Labour | Georgina Daffern | 902 | 52.2 | 15.5 | |
Conservative | Bradley Price | 597 | 34.5 | 7.0 | |
Green | Michael Cull-Dodd | 229 | 13.3 | 13.3 | |
Majority | 305 | 17.7 | |||
Turnout | 1,728 | 30.6 | |||
Labour hold | Swing | 11.3 | |||
Party | Candidate | Votes | % | ±% | |
---|---|---|---|---|---|
Labour | Barry Longden | 642 | 49.2 | 17.4 | |
UKIP | Joy Bent | 294 | 22.5 | 22.5 | |
Conservative | Neal Pointon | 286 | 21.9 | 11.5 | |
Green | Amanda Holtey | 61 | 4.7 | 4.7 | |
TUSC | Catherine Mosey | 21 | 1.6 | 1.6 | |
Majority | 348 | 23.4 | |||
Turnout | 1,304 | 26.1 | |||
Labour hold | Swing | 20.0 | |||
Party | Candidate | Votes | % | ±% | |
---|---|---|---|---|---|
Labour | John Glass | 1,133 | 72.3 | 3.4 | |
Conservative | Roger Rowland | 433 | 27.7 | 7.4 | |
Majority | 700 | 44.6 | |||
Turnout | 1,566 | 27.2 | |||
Labour hold | Swing | 2.0 | |||
Party | Candidate | Votes | % | ±% | |
---|---|---|---|---|---|
Conservative | Sebastian Gran | 852 | 42.7 | 21.5 | |
Labour | Dianne Fowler | 617 | 31.0 | 22.4 | |
UKIP | Andrew Wilson | 400 | 20.1 | 20.1 | |
Independent | John Ison | 124 | 6.2 | 11.3 | |
Majority | 235 | 11.8 | |||
Turnout | 1,993 | 37.2 | |||
Conservative gain from Labour | Swing | 22.0 | |||
Party | Candidate | Votes | % | ±% | |
---|---|---|---|---|---|
Conservative | Kathryn Brindley | 1,140 | 48.1 | 1.0 | |
Green | Michele Kondakor | 879 | 37.1 | 17.5 | |
Labour | Andrew Crichton | 350 | 14.8 | 7.9 | |
Majority | 261 | 11.0 | |||
Turnout | 2,369 | 42.6 | |||
Conservative hold | Swing | 9.2% | |||
Party | Candidate | Votes | % | ±% | |
---|---|---|---|---|---|
Green | Keith Kondakor | 1,351 | 55.4 | 8.4 | |
Conservative | Bethan Eddy | 760 | 31.2 | 0.9 | |
Labour | Brian Walmsley | 328 | 13.4 | 9.3 | |
Majority | 591 | 24.2 | |||
Turnout | 2,439 | 41.8 | |||
Green hold | Swing | 3.8% | |||
Party | Candidate | Votes | % | ±% | |
---|---|---|---|---|---|
Labour | Julie Jackson | 967 | 62.8 | 9.6 | |
Conservative | Andrew Sargeant | 248 | 16.1 | 0.9 | |
UKIP | Wendy Beard | 235 | 15.2 | 15.2 | |
Green | Michael Wright | 91 | 5.9 | 2.1 | |
Majority | 719 | 46.7 | |||
Turnout | 1,541 | 29.1 | |||
Labour hold | Swing | 4.4 | |||
Party | Candidate | Votes | % | ±% | |
---|---|---|---|---|---|
Conservative | Julian Gutteridge | 1,426 | 58.6 | 7.0 | |
Labour | Stephen Hey | 455 | 18.7 | 15.7 | |
UKIP | Alwyn Waine | 427 | 17.5 | 17.5 | |
Green | Laurel Brindley | 127 | 5.2 | 5.2 | |
Majority | 971 | 39.9 | |||
Turnout | 2,435 | 43.7 | |||
Conservative hold | Swing | 4.3 | |||
Nuneaton and Bedworth is a local government district with borough status, in northern Warwickshire, England, consisting of the towns of Nuneaton and Bedworth as well as villages such as Bulkington, Ash Green, Exhall, Galley Common and Barnacle. The borough had a population of 129,883 in a 2019-estimate.
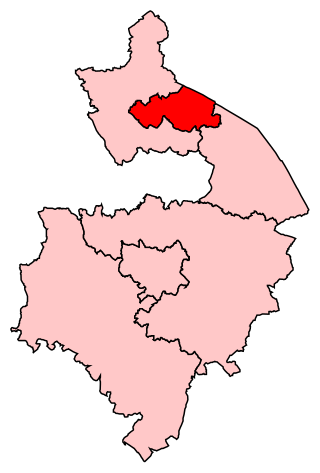
Nuneaton is a constituency represented in the House of Commons of the UK Parliament since 2010 by Marcus Jones, a Conservative. Since 1997, the seat has been seen as an important national bellwether.
North Warwickshire is a constituency represented in the House of Commons of the UK Parliament since 2015 by Craig Tracey, a Conservative.
The 2006 United Kingdom local elections were held on Thursday 4 May 2006.
Elections to the Borough Council in Slough, England, were held on 3 May 2007. One third of the council was up for election. This was the 122nd Slough general local authority election since Slough became a local government unit in 1863.
Nuneaton and Bedworth Borough Council elections are held every other year, with half the council being elected each time. Nuneaton and Bedworth Borough Council is the local authority for the non-metropolitan district of Nuneaton and Bedworth in Warwickshire, England. Since the last boundary changes in 2002, 34 councillors have been elected from 17 wards. Prior to 2002 elections were held three years out of every four, with a third of the council elected each time.
Elections to the Borough Council in Slough, England, were held on 1 May 2008. This was the 123rd Slough general local authority election since Slough became a local government unit in 1863.
The 2007 council elections in Guildford saw the Conservatives retain control over Guildford Borough Council. Full results for each ward can be found at Guildford Council election, full results, 2007.
An election for the Borough Council in Slough, England, was held on 6 May 2010. This was the 124th Slough general local authority election since Slough became a local government unit in 1863.
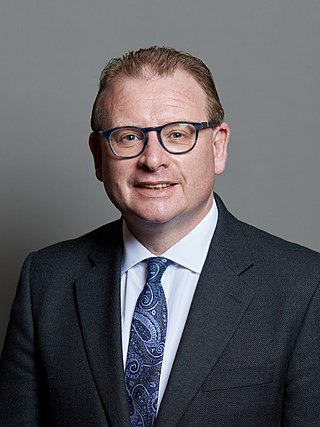
Marcus Charles Jones is an English Conservative Party politician who has been the Member of Parliament (MP) for Nuneaton since 2010. Previously he had been the Leader of Nuneaton and Bedworth Borough Council. He has been serving as Government Deputy Chief Whip and Treasurer of the Household since October 2022.
Elections to North Warwickshire District Council were held on Thursday 5 May 2011.
The 2011 council elections in Guildford saw the Conservatives retain control over Guildford Borough Council with an increased majority of 20 seats. Full results for each ward can be found at Guildford Council election, full results, 2011.
The 2015 United Kingdom local elections were held on Thursday 7 May 2015, the same day as the general election for the House of Commons of the United Kingdom.
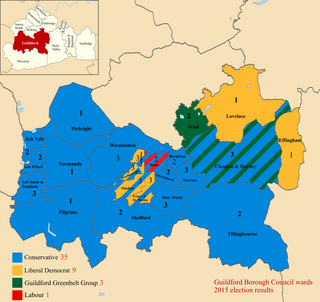
The 2015 Guildford Borough Council election took place on 7 May 2015 to elect members of Guildford Borough Council in England as one of the 2015 local elections, held simultaneously with the General Election.
Elections to Mid Bedfordshire District Council were held in May 2007. These were the last elections to council, with all 53 seats being up for election. Councillors elected would serve a two-year term, expiring in 2009, when Mid Bedfordshire District Council was replaced by Central Bedfordshire Council. The Conservative Party retained overall control of the council, winning 37 of 53 seats on the council. The Conservatives won 8 seats unopposed, as did an Independent candidate in one ward.
Elections to Mid Bedfordshire District Council were held on 1 May 2003. All 53 seats were up for election. Councillors elected would serve a four-year term, expiring in 2007. The Conservative Party retained overall control of the council, winning 37 of 53 seats on the council. The Conservatives won 7 seats unopposed.
The 2018 Nuneaton and Bedworth Borough Council election was held on 3 May 2018, as part of 2018 United Kingdom local elections. Half of the council was up for election and the Labour Party lost overall control of the council to no overall control.
The 2021 Nuneaton and Bedworth Borough Council election was held on 6 May 2021 as part of the 2021 United Kingdom local elections and alongside elections for Warwickshire County Council and Warwickshire Police and Crime Commissioner. Half of the borough council seats were up for election and the results provided the Conservative Party with a majority on the council, with the party winning all but two seats up for election.
The 2022 Calderdale Metropolitan Borough Council election took place on 5 May 2022 to elect members of Calderdale Metropolitan Borough Council in England. One third of councillors — 17 out of 51, plus one vacancy in Ovenden ward were up for election. The election took place alongside other local elections across the United Kingdom.
The 2022 Nuneaton and Bedworth Borough Council election was held on 5 May 2022 to elect members of Nuneaton and Bedworth Borough Council. Seventeen seats of the thirty-four seats on the council were elected, as part of the wider 2022 local elections.