| |||||||||||||||||||||||||||||||||||||||||||||||||||||||||||||
All 44 seats to Warwick District Council 23 seats needed for a majority | |||||||||||||||||||||||||||||||||||||||||||||||||||||||||||||
---|---|---|---|---|---|---|---|---|---|---|---|---|---|---|---|---|---|---|---|---|---|---|---|---|---|---|---|---|---|---|---|---|---|---|---|---|---|---|---|---|---|---|---|---|---|---|---|---|---|---|---|---|---|---|---|---|---|---|---|---|---|
| |||||||||||||||||||||||||||||||||||||||||||||||||||||||||||||
Winner of each seat at the 2019 Warwick District Council election | |||||||||||||||||||||||||||||||||||||||||||||||||||||||||||||
Composition of the council after the election | |||||||||||||||||||||||||||||||||||||||||||||||||||||||||||||
|
The 2019 Warwick District Council election took place on 2 May 2019 to elect members of Warwick District Council in England. [1] This was on the same day as other local elections. The whole council was up for election on new boundaries. [2] The Conservative Party lost control of the council.
2019 Warwick District Council election | ||||||||||
---|---|---|---|---|---|---|---|---|---|---|
Party | Candidates | Seats | Gains | Losses | Net gain/loss | Seats % | Votes % | Votes | +/− | |
Conservative | 44 | 19 | 0 | 0 | 12 | 43.2 | 29.4 | 30,953 | –13.9 | |
Liberal Democrats | 29 | 9 | 0 | 0 | 7 | 20.5 | 23.5 | 24,730 | +10.4 | |
Green | 41 | 8 | 0 | 0 | 7 | 18.2 | 22.5 | 23,722 | +9.1 | |
Labour | 32 | 5 | 0 | 0 | 4 | 11.4 | 19.5 | 20,534 | –3.2 | |
Whitnash Residents | 3 | 3 | 0 | 0 | 6.8 | 3.9 | 4,123 | +0.2 | ||
UKIP | 6 | 0 | 0 | 0 | 0.0 | 1.2 | 1,285 | –1.1 |
Party | Candidate | Votes | % | ±% | |
---|---|---|---|---|---|
Conservative | Andrew Day* | 518 | 49.4 | ||
Conservative | David Norris | 430 | 41.0 | ||
Labour | Martin Drew | 422 | 40.2 | ||
Green | Pippa Austin | 165 | 15.7 | ||
Liberal Democrats | Deborah Pittarello | 140 | 13.5 | ||
Green | Alison Firth | 130 | 12.4 | ||
Majority | 8 | 0.8 | |||
Turnout | 1,059 | 33.9 | |||
Conservative hold | |||||
Conservative win (new seat) |
Party | Candidate | Votes | % | ±% | |
---|---|---|---|---|---|
Conservative | Alan Rhead* | 1,129 | 55.6 | ||
Conservative | Jan Matecki | 991 | 48.8 | ||
Green | Pam Lunn | 538 | 26.5 | ||
Green | David Armstrong | 471 | 23.2 | ||
Labour | Felix Ling | 326 | 16.0 | ||
UKIP | Terry Court | 257 | 12.6 | ||
Majority | 453 | 22.3 | |||
Turnout | 2,051 | 41.8 | |||
Conservative hold | |||||
Party | Candidate | Votes | % | ±% | |
---|---|---|---|---|---|
Conservative | Pamela Redford* | 856 | 51.8 | ||
Conservative | Trevor Wright* | 848 | 51.4 | ||
Labour | Josh Payne | 408 | 24.7 | ||
Labour | Nicholas Hoten | 404 | 24.5 | ||
Green | Chris Philpott | 357 | 21.6 | ||
Green | Anthony O'Brien | 308 | 18.7 | ||
Majority | 440 | 26.7 | |||
Turnout | 1,676 | 36.9 | |||
Conservative win (new seat) | |||||
Conservative win (new seat) |
Party | Candidate | Votes | % | ±% | |
---|---|---|---|---|---|
Conservative | John Cooke* | 1,357 | 48.4 | ||
Conservative | Richard Hales | 1,346 | 48.0 | ||
Conservative | George Illingworth* | 1,334 | 47.5 | ||
Liberal Democrats | Pat Ryan | 655 | 23.3 | ||
Green | James Harrison | 628 | 22.4 | ||
Liberal Democrats | Alan Chalmers | 610 | 21.7 | ||
Liberal Democrats | Andy Tulloch | 562 | 20.0 | ||
Green | George Martin | 544 | 19.4 | ||
Green | Peter Jones | 481 | 17.1 | ||
Labour | Peter Shiels | 302 | 10.8 | ||
Majority | 679 | 24.2 | |||
Turnout | 2,856 | 38.0 | |||
Conservative win (new seat) | |||||
Conservative win (new seat) |
Party | Candidate | Votes | % | ±% | |
---|---|---|---|---|---|
Green | Alix Dearing | 1,629 | 50.2 | ||
Green | Alistair Kennedy | 1,483 | 45.7 | ||
Green | John Dearing | 1,477 | 45.6 | ||
Conservative | Dave Shilton* | 1,177 | 36.3 | ||
Conservative | Felicity Bunker* | 1,097 | 33.8 | ||
Conservative | Andrew Mobbs* | 1,041 | 32.1 | ||
Liberal Democrats | Jack Worrall | 345 | 10.6 | ||
Liberal Democrats | Samantha Cooke | 338 | 10.4 | ||
Labour | Audrey Mullender | 286 | 8.8 | ||
Labour | Andrew Roadnight | 268 | 8.3 | ||
Labour | Stephen Snart | 220 | 6.8 | ||
Majority | 300 | 9.3 | |||
Turnout | 3,293 | 41.9 | |||
Green win (new seat) | |||||
Green win (new seat) |
Party | Candidate | Votes | % | ±% | |
---|---|---|---|---|---|
Liberal Democrats | Richard Dickson | 2,299 | 66.8 | ||
Liberal Democrats | Kate Dickson | 2,292 | 66.6 | ||
Liberal Democrats | Andrew Milton | 2,061 | 59.9 | ||
Conservative | Richard Davies* | 1,125 | 32.7 | ||
Conservative | Marilyn Bates | 1,100 | 32.0 | ||
Conservative | Pat Cain* | 1,078 | 31.3 | ||
Majority | 936 | 27.2 | |||
Turnout | 3,512 | 45.3 | |||
Liberal Democrats win (new seat) | |||||
Liberal Democrats win (new seat) |
Party | Candidate | Votes | % | ±% | |
---|---|---|---|---|---|
Green | Amy Evans | 1,241 | 56.3 | ||
Green | Ian Davison* | 1,223 | 55.5 | ||
Green | Naveen Tangri | 1,111 | 50.4 | ||
Labour | Kristie Naimo* | 846 | 38.4 | ||
Labour | Jojo Norris | 774 | 35.1 | ||
Labour | Alec Roberts | 625 | 28.4 | ||
Conservative | James Butler | 192 | 8.7 | ||
Conservative | Tom Peake | 142 | 6.4 | ||
Conservative | David Stevens | 127 | 5.8 | ||
Liberal Democrats | George Begg | 101 | 4.6 | ||
Majority | 265 | 12.0 | |||
Turnout | 2,222 | 30.0 | |||
Green win (new seat) | |||||
Green win (new seat) |
Party | Candidate | Votes | % | ±% | |
---|---|---|---|---|---|
Labour | Geraldine Cullinan | 1,021 | 36.6 | ||
Labour | Jonathan Nicholls | 977 | 35.0 | ||
Labour | Jerry Weber | 896 | 32.1 | ||
Liberal Democrats | Perjit Aujla | 873 | 31.3 | ||
Liberal Democrats | John Kelly | 817 | 29.3 | ||
Liberal Democrats | Charles Turner | 784 | 28.1 | ||
Conservative | Daniel Simpson | 520 | 18.6 | ||
Conservative | Thomas Thorp | 520 | 18.6 | ||
Conservative | John Tweedy | 504 | 18.1 | ||
Green | Tony Ross | 360 | 12.9 | ||
Green | Niqui Townsend | 357 | 12.8 | ||
Green | Bernie McCullagh | 332 | 11.9 | ||
UKIP | James Chalmers | 188 | 6.7 | ||
Majority | 23 | 0.8 | |||
Turnout | 2,798 | 35.9 | |||
Labour win (new seat) | |||||
Labour win (new seat) |
Party | Candidate | Votes | % | ±% | |
---|---|---|---|---|---|
Liberal Democrats | Alan Boad* | 1,698 | 49.7 | ||
Liberal Democrats | Heather Calver | 1,505 | 44.1 | ||
Liberal Democrats | Phil Kohler | 1,464 | 42.9 | ||
Labour | Stef Parkins* | 773 | 22.6 | ||
Labour | Pip Burley | 760 | 22.3 | ||
Labour | Paul Gillett | 700 | 20.5 | ||
Conservative | Jacqueline David | 606 | 17.8 | ||
Conservative | Gordon Cain* | 532 | 15.6 | ||
Conservative | Bryan Poole | 485 | 14.2 | ||
Green | James Barrett | 448 | 13.1 | ||
Green | Marcia Watson | 408 | 12.0 | ||
Green | Angela Smith | 362 | 10.6 | ||
Majority | 691 | 20.3 | |||
Turnout | 3,414 | 37.7 | |||
Liberal Democrats win (new seat) | |||||
Liberal Democrats win (new seat) |
Party | Candidate | Votes | % | ±% | |
---|---|---|---|---|---|
Liberal Democrats | Bill Gifford* | 2,131 | 62.8 | ||
Liberal Democrats | Carolyn Gifford | 1,718 | 50.7 | ||
Liberal Democrats | Sidney Syson | 1,583 | 46.7 | ||
Conservative | Hayley Grainger* | 852 | 25.1 | ||
Conservative | Robert Old | 727 | 21.4 | ||
Conservative | Jake Sargent | 628 | 18.5 | ||
Labour | Susan Rasmussen | 609 | 18.0 | ||
Green | Alison Chakir | 500 | 14.7 | ||
Green | Charles Atkin | 468 | 13.8 | ||
Green | Andrew Stevenson | 349 | 10.3 | ||
Majority | 731 | 21.6 | |||
Turnout | 3,415 | 45.5 | |||
Liberal Democrats win (new seat) | |||||
Liberal Democrats win (new seat) |
Party | Candidate | Votes | % | ±% | |
---|---|---|---|---|---|
Green | Martin Luckhurst | 1,517 | 53.2 | ||
Green | Will Roberts | 1,184 | 41.5 | ||
Labour | Mini Mangat | 1,118 | 39.2 | ||
Green | Peggy Wiseman | 1,108 | 38.9 | ||
Labour | John Barrott* | 1,083 | 38.0 | ||
Labour | Colin Quinney* | 1,049 | 36.8 | ||
Conservative | Stacey Calder | 260 | 9.1 | ||
Conservative | Luke Shortland | 212 | 7.4 | ||
Conservative | Joe Quick | 206 | 7.2 | ||
Liberal Democrats | David Alexander | 205 | 7.2 | ||
UKIP | Gerry Smith | 126 | 4.4 | ||
Majority | 10 | 0.3 | |||
Turnout | 2,867 | 36.5 | |||
Green win (new seat) | |||||
Labour win (new seat) |
Party | Candidate | Votes | % | ±% | |
---|---|---|---|---|---|
Conservative | Valerie Leigh-Hunt | 504 | 48.5 | ||
Liberal Democrats | Helen James | 213 | 20.5 | ||
Green | Tracey Drew | 175 | 16.8 | ||
Labour | Martin McMahon | 147 | 14.2 | ||
Majority | 291 | 28.0 | |||
Turnout | 1,055 | 40.3 | |||
Conservative win (new seat) |
Party | Candidate | Votes | % | ±% | |
---|---|---|---|---|---|
Conservative | Moira-Ann Grainger* | 1,050 | 38.9 | ||
Conservative | Jody Tracey | 1,049 | 38.9 | ||
Conservative | Oliver Jacques | 919 | 34.1 | ||
Labour | Jackie D'Arcy* | 892 | 33.1 | ||
Labour | Curtis Oliver-Smith | 800 | 29.7 | ||
Labour | John Sullivan | 768 | 28.5 | ||
Green | Simon Barrow | 462 | 17.1 | ||
Green | Julia Hart | 434 | 16.1 | ||
Liberal Democrats | John Cooper | 343 | 12.7 | ||
Green | Samuel Porter | 333 | 12.3 | ||
UKIP | Martin Mackenzie | 325 | 12.0 | ||
Majority | 27 | 1.0 | |||
Turnout | 2,741 | 37.1 | |||
Conservative win (new seat) | |||||
Conservative win (new seat) |
Party | Candidate | Votes | % | ±% | |
---|---|---|---|---|---|
Conservative | Liam Bartlett | 668 | 39.9 | ||
Conservative | Martyn Ashford* | 661 | 39.5 | ||
Labour | Daniel Browne | 515 | 30.8 | ||
Labour | Belinda Pyke | 514 | 30.7 | ||
Green | Juliet Nickels | 263 | 15.7 | ||
Liberal Democrats | Timothy Davis | 256 | 15.3 | ||
Green | James Alty | 234 | 14.0 | ||
Liberal Democrats | David Fisher | 160 | 9.6 | ||
Majority | 146 | 8.7 | |||
Turnout | 1,705 | 33.3 | |||
Conservative win (new seat) | |||||
Conservative win (new seat) |
Party | Candidate | Votes | % | ±% | |
---|---|---|---|---|---|
Conservative | Mary Noone | 808 | 41.4 | ||
Conservative | Neale Murphy* | 807 | 41.4 | ||
Conservative | Sukhi Sanghera | 756 | 38.8 | ||
Labour | Viv Kaliczak | 549 | 28.2 | ||
Liberal Democrats | Kelvin Lambert | 489 | 25.1 | ||
Green | Jonathan Hofstetter | 457 | 23.4 | ||
Liberal Democrats | Nicholas Pittarello | 456 | 23.4 | ||
Green | Andrew Barker | 454 | 23.3 | ||
Green | Thomas Hudson | 442 | 22.7 | ||
Majority | 207 | 10.6 | |||
Turnout | 1,989 | 34.5 | |||
Conservative win (new seat) | |||||
Conservative win (new seat) |
Party | Candidate | Votes | % | ±% | |
---|---|---|---|---|---|
Conservative | Terry Morris* | 692 | 34.2 | ||
Labour | Dave Skinner | 679 | 33.5 | ||
Labour | Nic Ruch | 624 | 30.8 | ||
Conservative | Llywelyn Colnet | 602 | 29.7 | ||
Green | David Cumner | 318 | 15.7 | ||
Liberal Democrats | Antony Butcher | 261 | 12.9 | ||
Green | Matt Swift | 252 | 12.4 | ||
Liberal Democrats | Alan Beddow | 211 | 10.4 | ||
UKIP | Jennifer Instone | 195 | 9.6 | ||
Majority | 55 | 2.7 | |||
Turnout | 2,044 | 36.4 | |||
Conservative win (new seat) | |||||
Labour win (new seat) |
Party | Candidate | Votes | % | ±% | |
---|---|---|---|---|---|
Whitnash Residents | Judy Falp* | 1,487 | 60.7 | ||
Whitnash Residents | Tony Heath* | 1,376 | 56.2 | ||
Whitnash Residents | Robert Margrave* | 1,260 | 51.4 | ||
Labour | William Clemmey | 661 | 27.0 | ||
Labour | Liam Jackson | 536 | 21.9 | ||
Green | Eloise Chilvers | 317 | 12.9 | ||
Green | Bob Edge | 202 | 8.2 | ||
Green | Bronwen Reid | 200 | 8.2 | ||
Conservative | Christine Cross | 198 | 8.1 | ||
UKIP | Laurie Steele | 194 | 7.9 | ||
Conservative | Sarah Sabin | 157 | 6.4 | ||
Liberal Democrats | Ajay Pandey | 150 | 6.1 | ||
Conservative | Thomas Raynor | 142 | 5.8 | ||
Majority | 599 | 24.4 | |||
Turnout | 2,461 | 32.5 | |||
Whitnash Residents hold | |||||
Party | Candidate | Votes | % | ±% | |
---|---|---|---|---|---|
Liberal Democrats | Daniel Russell | 1,296 | 55.3 | +7.1 | |
Conservative | Hayley Key | 664 | 28.3 | +11.1 | |
Labour | Luc Lowndes | 384 | 16.4 | –5.5 | |
Majority | 632 | 27.0 | |||
Turnout | 2,358 | 26.3 | |||
Registered electors | 8,971 | ||||
Liberal Democrats hold | Swing | 2.0 | |||
Party | Candidate | Votes | % | ±% | |
---|---|---|---|---|---|
Conservative | Jacqui Grey | 1,710 | 39.3 | +4.2 | |
Labour | Curtis Oliver-Smith | 1,079 | 24.8 | +1.0 | |
Green | Paul Atkins | 812 | 18.7 | –1.1 | |
Liberal Democrats | Hugh Foden | 644 | 14.8 | –6.4 | |
Independent | Bob Dhillon | 103 | 2.4 | N/A | |
Majority | 631 | 14.5 | |||
Turnout | 4,371 | 74.9 | |||
Registered electors | 5,839 | ||||
Conservative hold | Swing | 1.6 | |||
Party | Candidate | Votes | % | ±% | |
---|---|---|---|---|---|
Labour | Colin Quinney | 1,370 | 42.6 | +8.0 | |
Conservative | Frances Lasok | 761 | 23.6 | +6.0 | |
Liberal Democrats | Hugh Foden | 539 | 16.7 | –12.8 | |
Green | Ignaty Dyakov-Richmond | 431 | 13.4 | +1.2 | |
Independent | Hafeez Ahmed | 103 | 3.2 | N/A | |
SDP | Joshua Payne | 16 | 0.5 | N/A | |
Majority | 609 | 29.0 | |||
Turnout | 3,247 | 43.2 | |||
Registered electors | 7,521 | ||||
Labour hold | Swing | 1.0 | |||
Party | Candidate | Votes | % | ±% | |
---|---|---|---|---|---|
Whitnash Residents | Adrian Barton | 835 | 55.2 | +5.7 | |
Labour | Lucy Phillips | 431 | 28.5 | +6.5 | |
Conservative | John Kane | 127 | 8.4 | +1.8 | |
Green | Sarah Richards | 88 | 5.8 | -4.7 | |
Liberal Democrats | Trevor Barr | 32 | 2.1 | -2.9 | |
Majority | 404 | 26.7 | |||
Turnout | 1,526 | 20.6 | |||
Whitnash Residents hold | Swing | 0.4 | |||
Party | Candidate | Votes | % | ±% | |
---|---|---|---|---|---|
Labour | Christopher King | 1,064 | 49.0 | +14.5 | |
Liberal Democrats | Justine Ragany | 612 | 28.2 | –1.3 | |
Conservative | Frances Lasok | 365 | 16.8 | –0.8 | |
Green | Ignaty Dyakov-Richmond | 105 | 4.8 | –7.4 | |
UKIP | Gerald Smith | 24 | 1.1 | –5.2 | |
Majority | 452 | 20.8 | |||
Turnout | 2,176 | 28.8 | |||
Registered electors | 7,566 | ||||
Labour hold | Swing | 7.9 | |||
Royal Leamington Spa, commonly known as Leamington Spa or simply Leamington, is a spa town and civil parish in Warwickshire, England. Originally a small village called Leamington Priors, it grew into a spa town in the 18th century following the popularisation of its water which was reputed to have medicinal qualities. In the 19th century, the town experienced one of the most rapid expansions in England. It is named after the River Leam, which flows through the town.
Warwick is a market town, civil parish and the county town of Warwickshire in the Warwick District in England, adjacent to the River Avon. It is 9 miles (14 km) south of Coventry, and 19 miles (31 km) south-east of Birmingham. It is adjoined with Leamington Spa and Whitnash.
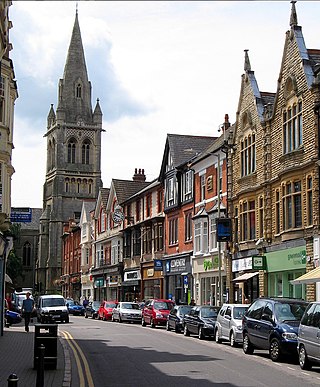
The Borough of Rugby is a local government district with borough status in Warwickshire, England. The borough comprises the town of Rugby where the council has its headquarters, and the rural areas surrounding the town. At the 2021 census the borough had a population of 114,400, of which 78,125 lived in the built-up area of Rugby itself and the remainder were in the surrounding areas.
Warwickshire is a ceremonial county in the West Midlands of England. It is bordered by Staffordshire and Leicestershire to the north, Northamptonshire to the east, Oxfordshire and Gloucestershire to the south, and Worcestershire and the West Midlands county to the west. The largest settlement is Nuneaton and the county town is Warwick.
Melton is a local government district with borough status in north-eastern Leicestershire, England. It is named after its only town, Melton Mowbray. The borough also includes numerous villages and surrounding rural areas. The north of the district includes part of the Vale of Belvoir. Melton is the least populous district of its type and the fourth least populous district in England overall.
Stratford-on-Avon is a local government district in Warwickshire, England. The district is named after its largest town of Stratford-upon-Avon, but with a change of preposition; the town uses "upon" and the district uses "on". The council is based in Stratford-upon-Avon and the district, which is predominantly rural, also includes the towns of Alcester, Shipston-on-Stour and Southam, and the large villages of Bidford-on-Avon, Studley and Wellesbourne, plus numerous other smaller villages and hamlets and surrounding rural areas. The district covers the more sparsely populated southern part of Warwickshire, and contains nearly half the county's area. The district includes part of the Cotswolds, a designated Area of Outstanding Natural Beauty.
Warwick is a local government district in Warwickshire, England. It is named after the historic county town of Warwick, which is the district's second largest town; the largest town is Royal Leamington Spa, where the council is based. The district also includes the towns of Kenilworth and Whitnash and surrounding villages and rural areas. Leamington Spa, Warwick and Whitnash form a conurbation which has about two thirds of the district's population.
Warwick and Leamington is a constituency represented in the House of Commons of the UK Parliament since the 2017 general election by Matt Western, of the Labour Party.
Warwick is a town and locality in southeast Queensland, Australia, lying 130 kilometres (81 mi) south-west of Brisbane. It is the administrative centre of the Southern Downs Region local government area. The surrounding Darling Downs have fostered a strong agricultural industry for which Warwick, together with the larger city of Toowoomba, serve as convenient service centres. The town had an urban population of 15,380 as at June 2018, having declined slightly at an average annual rate of –0.15% year-on-year over the preceding five years.
Warwick District Council elections are held every four years. Warwick District Council is the local authority for the non-metropolitan district of Warwick in Warwickshire, England. Since the last boundary changes in 2019, 44 councillors have been elected from 17 wards.
Kenilworth and Southam is a constituency in Warwickshire, England represented in the House of Commons of the UK Parliament since 2010 by Jeremy Wright, a Conservative who served as Culture Secretary until 24 July 2019, having previously served as Attorney General for England and Wales from 2014 to 2018.
The City and County of Swansea Council, or simply Swansea Council, is the local authority for the city and county of Swansea, one of the principal areas of Wales. The principal area also includes rural areas to the north of the built-up area of Swansea and the Gower Peninsula to the west. The council consists of 75 councillors representing 32 electoral wards.
Warwickshire County Council is the county council that governs the non-metropolitan county of Warwickshire in England. Its headquarters are at Shire Hall in the centre of Warwick, the county town. The council's principal functions are county roads and rights of way, social services, education and libraries, but it also provides numerous other local government services in its area.
Rotorua Lakes District or Rotorua District is a territorial authority district in the North Island of New Zealand. It has one urban area of significant size, the city of Rotorua. The district is governed by Rotorua Lakes Council, which is headquartered in Rotorua and is headed by a mayor. The district falls within two regional council areas, with the majority of the area and Rotorua city in the Bay of Plenty Region and the rest in the Waikato region. Tania Tapsell has been the mayor of Rotorua since the 2022 local elections.
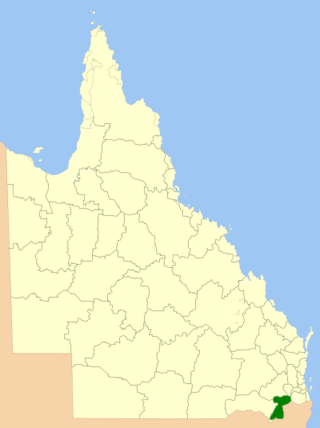
The Southern Downs Region is a local government area in the Darling Downs region of Queensland, Australia, along the state's boundary with New South Wales. It was created in 2008 from a merger of the Shire of Warwick and the Shire of Stanthorpe.
Elections to Warwick District Council took place on Thursday 5 May 2011.
The 2014 United States Senate election in Rhode Island was held on November 4, 2014 to elect a member of the United States Senate from the State of Rhode Island, concurrently with the election of the governor of Rhode Island, as well as other elections to the United States Senate in other states and elections to the United States House of Representatives and various state and local elections.
Elections to Warwick District Council took place on Thursday 7 May 2015, with votes counted and declared on Saturday 9 May 2015.
The 2011 West Oxfordshire District Council election took place on 5 May 2011 to elect members of West Oxfordshire District Council in Oxfordshire, England. One third of the council was up for election and the Conservative Party stayed in overall control of the council.
Matthew Raymond Western is a British Labour Party politician who has been the Member of Parliament (MP) for Warwick & Leamington since the snap 2017 general election. He was re-elected in the 2019 general election.