Results maps
 2003 results map
 2007 results map
 2011 results map
 2015 results map
 2019 results map
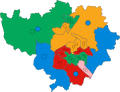 2023 results map
Warwick District Council elections are held every four years. Warwick District Council is the local authority for the non-metropolitan district of Warwick in Warwickshire, England. Since the last boundary changes in 2019, 44 councillors have been elected from 17 wards. [1]


| Party | Candidate | Votes | % | ±% | |
|---|---|---|---|---|---|
| Labour | 2,401 | 49.1 | −9.4 | ||
| Conservative | 1,820 | 37.2 | +13.7 | ||
| Liberal Democrats | 666 | 13.6 | +1.8 | ||
| Majority | 581 | 11.9 | |||
| Turnout | 4,887 | ||||
| Labour hold | Swing | ||||
| Party | Candidate | Votes | % | ±% | |
|---|---|---|---|---|---|
| Conservative | 560 | 59.4 | +7.6 | ||
| Labour | 224 | 23.8 | −24.4 | ||
| Liberal Democrats | 159 | 16.9 | +16.9 | ||
| Majority | 336 | 35.6 | |||
| Turnout | 943 | 42.0 | |||
| Conservative hold | Swing | ||||
| Party | Candidate | Votes | % | ±% | |
|---|---|---|---|---|---|
| Labour | Misan McFarland | 2,236 | 52.4 | −3.7 | |
| Conservative | 1,320 | 30.9 | +4.7 | ||
| Liberal Democrats | 545 | 12.8 | +1.8 | ||
| Green | 167 | 3.9 | −2.8 | ||
| Majority | 916 | 21.5 | |||
| Turnout | 4,268 | ||||
| Labour hold | Swing | ||||
| Party | Candidate | Votes | % | ±% | |
|---|---|---|---|---|---|
| Labour | 1,837 | 48.7 | +0.5 | ||
| Conservative | 1,336 | 35.4 | +7.9 | ||
| Liberal Democrats | 430 | 11.4 | −1.2 | ||
| Green | 167 | 4.4 | −7.2 | ||
| Majority | 441 | 13.3 | |||
| Turnout | 3,770 | ||||
| Labour hold | Swing | ||||
| Party | Candidate | Votes | % | ±% | |
|---|---|---|---|---|---|
| Labour | 1,440 | 38.2 | +11.4 | ||
| Residents | 1,194 | 31.6 | −25.1 | ||
| Conservative | 761 | 20.2 | +9.5 | ||
| Liberal Democrats | 255 | 6.8 | +6.8 | ||
| Green | 123 | 3.3 | −2.5 | ||
| Majority | 246 | 6.6 | |||
| Turnout | 3,773 | ||||
| Labour gain from Independent | Swing | ||||
| Party | Candidate | Votes | % | ±% | |
|---|---|---|---|---|---|
| Conservative | 983 | 56.2 | +2.0 | ||
| Labour | 516 | 29.5 | +5.1 | ||
| Liberal Democrats | 249 | 14.2 | −2.0 | ||
| Majority | 467 | 26.7 | |||
| Turnout | 1,748 | 24.0 | |||
| Conservative hold | Swing | ||||
| Party | Candidate | Votes | % | ±% | |
|---|---|---|---|---|---|
| Conservative | Anne Mellor | 1,059 | 56.4 | +27.4 | |
| Liberal Democrats | David Manuel | 426 | 22.7 | +9.2 | |
| Labour | John Barrott | 300 | 16.0 | +1.7 | |
| Green | Juliet Nickels | 94 | 5.0 | −4.9 | |
| Majority | 633 | 33.7 | |||
| Turnout | 1,879 | 25.0 | |||
| Conservative hold | Swing | ||||
| Party | Candidate | Votes | % | ±% | |
|---|---|---|---|---|---|
| Conservative | Norman Vincett | 890 | 48.8 | +6.9 | |
| Liberal Democrats | Shirley Shilton | 674 | 37.0 | +19.1 | |
| Labour | Jeremy Eastaugh | 206 | 11.3 | −6.8 | |
| Independent | Brian Hadland | 52 | 2.9 | −10.2 | |
| Majority | 216 | 11.8 | |||
| Turnout | 1,822 | 31.3 | |||
| Conservative hold | Swing | ||||
| Party | Candidate | Votes | % | ±% | |
|---|---|---|---|---|---|
| Labour | Alan Wilkinson | 605 | 35.8 | −9.1 | |
| Conservative | Didar Kundi | 428 | 25.3 | +3.8 | |
| Liberal Democrats | Charlotte Farrington | 216 | 12.8 | −4.3 | |
| Green | Rebecca Knight | 209 | 12.4 | −4.1 | |
| BNP | Martin Smallwood | 136 | 8.0 | +8.0 | |
| Whitnash Residents | Clive Taylor | 96 | 5.7 | +5.7 | |
| Majority | 177 | 10.5 | |||
| Turnout | 1,690 | 29.0 | |||
| Labour hold | Swing | ||||
| Party | Candidate | Votes | % | ±% | |
|---|---|---|---|---|---|
| Conservative | Linda Bromley | 1,107 | 54.0 | +0.2 | |
| Labour | Chris McKeown | 648 | 31.6 | +13.3 | |
| Liberal Democrats | Chris Spedding | 294 | 14.3 | +0.2 | |
| Majority | 459 | 22.4 | |||
| Turnout | 2,049 | ||||
| Conservative hold | Swing | ||||
| Party | Candidate | Votes | % | ±% | |
|---|---|---|---|---|---|
| Conservative | Mary Noone | 488 | 53.6 | +2.5 | |
| Liberal Democrats | Nick Solman | 228 | 25.0 | +16.3 | |
| Labour | Ben Wesson | 194 | 21.3 | +21.3 | |
| Majority | 260 | 28.6 | +12.2 | ||
| Turnout | 910 | 22.3 | −53.3 | ||
| Conservative hold | Swing | ||||
| Party | Candidate | Votes | % | ±% | |
|---|---|---|---|---|---|
| Conservative | Trevor Wright | 502 | 52.6 | +13.0 | |
| Labour | Josh Payne | 311 | 32.6 | +15.1 | |
| Liberal Democrats | Richard Dickson | 113 | 11.8 | +11.8 | |
| Green | Chris Philpott | 29 | 3.0 | −10.3 | |
| Majority | 191 | 20.0 | |||
| Turnout | 955 | ||||
| Conservative hold | Swing | ||||
| Party | Candidate | Votes | % | ±% | |
|---|---|---|---|---|---|
| Liberal Democrats | Daniel Russell | 1,296 | 55.3 | +7.1 | |
| Conservative | Hayley Key | 664 | 28.3 | +11.1 | |
| Labour | Luc Lowndes | 384 | 16.4 | −5.5 | |
| Majority | 632 | 27.0 | |||
| Turnout | 2,344 | ||||
| Liberal Democrats hold | Swing | ||||
| Party | Candidate | Votes | % | ±% | |
|---|---|---|---|---|---|
| Conservative | Jacqui Grey | 1,710 | 39.3 | +4.2 | |
| Labour | Curtis Oliver-Smith | 1,079 | 24.8 | +1.0 | |
| Green | Paul Atkins | 812 | 18.7 | −1.1 | |
| Liberal Democrats | Hugh Foden | 644 | 14.8 | −6.4 | |
| Independent | Bob Dhillon | 103 | 2.4 | +2.4 | |
| Majority | 631 | 14.5 | |||
| Turnout | 4,348 | ||||
| Conservative hold | Swing | ||||
| Party | Candidate | Votes | % | ±% | |
|---|---|---|---|---|---|
| Labour | Colin Quinney | 1,370 | 42.5 | +8.0 | |
| Conservative | Frances Lasok | 761 | 23.6 | +6.0 | |
| Liberal Democrats | Hugh Foden | 539 | 16.7 | −12.8 | |
| Green | Ignaty Dyakov-Richmond | 431 | 13.4 | +1.2 | |
| Independent | Hafeez Ahmed | 103 | 3.2 | +3.2 | |
| SDP | Josh Payne | 16 | 0.5 | +0.5 | |
| Majority | 609 | 18.9 | |||
| Turnout | 3,220 | ||||
| Labour hold | Swing | ||||
| Party | Candidate | Votes | % | ±% | |
|---|---|---|---|---|---|
| Whitnash Residents | Adrian Barton | 835 | 55.2 | +5.7 | |
| Labour | Lucy Phillips | 431 | 28.5 | +6.5 | |
| Conservative | John Kane | 127 | 8.4 | +1.8 | |
| Green | Sarah Richards | 88 | 5.8 | −4.7 | |
| Liberal Democrats | Trevor Barr | 32 | 2.1 | −2.9 | |
| Majority | 404 | 26.7 | |||
| Turnout | 1,513 | ||||
| Whitnash Residents hold | Swing | ||||
| Party | Candidate | Votes | % | ±% | |
|---|---|---|---|---|---|
| Labour | Christopher King | 1,064 | 49.0 | +14.5 | |
| Liberal Democrats | Justine Ragany | 612 | 28.2 | −1.3 | |
| Conservative | Frances Lasok | 365 | 16.8 | −0.8 | |
| Green | Ignaty Dyakov-Richmond | 105 | 4.8 | −7.4 | |
| UKIP | Gerald Smith | 24 | 1.1 | −5.2 | |
| Majority | 452 | 20.8 | |||
| Turnout | 2,170 | ||||
| Labour hold | Swing | ||||
| Party | Candidate | Votes | % | ±% | |
|---|---|---|---|---|---|
| Labour | Claire Wightman | 961 | 52.5 | ||
| Conservative | Jody Tracey | 687 | 37.5 | ||
| Liberal Democrats | Laurence Byrne | 183 | 10.0 | ||
| Majority | 274 | 15.0 | |||
| Turnout | 1,831 | ||||
| Labour hold | Swing | ||||
| Party | Candidate | Votes | % | ±% | |
|---|---|---|---|---|---|
| Labour | Helen Adkins | 1,267 | 51.7 | ||
| Conservative | Moira-Ann Grainger | 407 | 16.6 | ||
| Liberal Democrats | John Kelly | 365 | 14.9 | ||
| Green | Amanda Dyakov-Richmond | 362 | 14.8 | ||
| UKIP | Gerald Smith | 50 | 2.0 | ||
| Majority | 860 | 35.1 | |||
| Turnout | 2,451 | ||||
| Labour hold | Swing | ||||
| Party | Candidate | Votes | % | ±% | |
|---|---|---|---|---|---|
| Green | Sam Jones | 719 | 34.9 | ||
| Reform UK | Nigel Clarke | 450 | 21.8 | ||
| Labour | Cora-Laine Moynihan | 399 | 19.4 | ||
| Conservative | Jody Tracey | 383 | 18.6 | ||
| Liberal Democrats | Laurence Byrne | 110 | 5.3 | ||
| Majority | 269 | 13.1 | |||
| Turnout | 2,061 | ||||
| Green gain from Labour | Swing | ||||
| Party | Candidate | Votes | % | ±% | |
|---|---|---|---|---|---|
| Green | Alison Firth | 1,007 | 40.3 | ||
| Conservative | Malcolm Graham | 588 | 23.6 | ||
| Reform UK | Timothy Wade | 447 | 18.1 | ||
| Liberal Democrats | John Dubber | 344 | 13.9 | ||
| Labour | Nicola Jones | 81 | 3.3 | ||
| Majority | 419 | 16.7 | |||
| Turnout | 2,469 | 31.5 | |||
| Green hold | Swing | ||||
| Party | Candidate | Votes | % | ±% | |
|---|---|---|---|---|---|
| Labour | Chris Knight | 574 | 30.3 | ||
| Liberal Democrats | Raina Deo | 561 | 29.6 | ||
| Reform UK | Nigel Clarke | 309 | 16.3 | ||
| Green | Abi Underwood | 240 | 12.7 | ||
| Conservative | Dominic Smith | 140 | 7.4 | ||
| Independent | Megan Clarke | 72 | 3.8 | ||
| Majority | 13 | 0.7 | |||
| Turnout | 1,896 | 25.2 | |||
| Labour hold | Swing | ||||