| |||||||||||||||||||||||||
All 35 seats to North Warwickshire Borough Council 18 seats needed for a majority | |||||||||||||||||||||||||
---|---|---|---|---|---|---|---|---|---|---|---|---|---|---|---|---|---|---|---|---|---|---|---|---|---|
Turnout | 43.7% 4.9 pp | ||||||||||||||||||||||||
| |||||||||||||||||||||||||
Results of the 2011 North Warwickshire Borough council election. Conservatives in blue and Labour in red. | |||||||||||||||||||||||||
Composition of the council after the election. | |||||||||||||||||||||||||
|
Elections to North Warwickshire District Council were held on Thursday 5 May 2011.
A total of 35 seats were up for election, all councillors from all wards. The previous election produced a majority for the Conservative Party. [1]
These elections saw Labour narrowly win with a majority of just one seat but losing the overall popular vote to the Conservatives. The number of close results in so many wards perhaps is the reason for this.
The Conservatives lost four seats at these elections, in the following wards.
The number of seats could have flipped the other way if the Conservatives managed to have won in Atherstone North, where both of the Conservative candidates received 522 votes, which was 32 votes behind taking the second seat in that ward, which bizarrely wasn't one of the four seats the Conservatives lost at these elections. Even more astonishingly, Atherstone North had never elected a Conservative councillor in the entirety of the borough council's existence, and would not do so until the following elections in 2015, which coincided with the North Warwickshire parliamentary constituency, which incorporates all of the North Warwickshire borough except for 2 wards (Arley & Whitacre and Hartshill), as well as five Nuneaton and Bedworth wards (Bede, Exhall, Heath, Poplar, and Slough) being held by the Conservatives with an increased majority at the general election on the same day. [2] [3] [4] [5]
Party | Candidate | Votes | % | ±% | |
---|---|---|---|---|---|
Conservative | Karen Barber | 852 | |||
Conservative | Pam Coton | 730 | |||
Conservative | Carol Fox | 788 | |||
Independent | Richard John Hancocks | 252 | |||
Labour | Sharon Jane Moss | 770 | |||
Labour | Harry Thomas George Taylor | 770 | |||
Labour | Nigel Ivor Turley | 823 | |||
Majority | |||||
Turnout | |||||
Swing | |||||
Party | Candidate | Votes | % | ±% | |
---|---|---|---|---|---|
Conservative | Denise Sandra Clews | ||||
Labour | Lorna Elizabeth Dirveiks | ||||
Labour | Neil Adrian David Dirveiks | ||||
Conservative | Tony Wright | ||||
Majority | |||||
Turnout | |||||
Swing | |||||
Party | Candidate | Votes | % | ±% | |
---|---|---|---|---|---|
Conservative | Gill Davis | ||||
Labour | Anne Forwood | ||||
Labour | Derek Nicholas Alfred Pickard | ||||
Conservative | Martin George Shaw | ||||
Majority | |||||
Turnout | |||||
Swing | |||||
Party | Candidate | Votes | % | ±% | |
---|---|---|---|---|---|
Conservative | Martin Cyril Davis | ||||
Conservative | Lorraine Freer | ||||
Labour | Ray Jarvis | ||||
Labour | Ceri Short | ||||
Majority | |||||
Turnout | |||||
Swing | |||||
Party | Candidate | Votes | % | ±% | |
---|---|---|---|---|---|
Conservative | Margaret Anne Manley | ||||
Labour | John Sidney Moore | ||||
Conservative | Mel Smith | ||||
Labour | Ray Sweet | ||||
Majority | |||||
Turnout | |||||
Swing | |||||
Party | Candidate | Votes | % | ±% | |
---|---|---|---|---|---|
Conservative | Jeremy Bowden | ||||
Labour | Adam Joseph Farrell | ||||
Labour | Dominic Charles Ferro | ||||
Conservative | Peter John Fowler | ||||
Majority | |||||
Turnout | |||||
Swing | |||||
Party | Candidate | Votes | % | ±% | |
---|---|---|---|---|---|
Labour | Christopher David Bain | ||||
Labour | Claire Breeze | ||||
Conservative | Gordon James Thomas Sherratt | ||||
Conservative | Andrew Watkins | ||||
Majority | |||||
Turnout | |||||
gain from | Swing | ||||
Party | Candidate | Votes | % | ±% | |
---|---|---|---|---|---|
Labour | Celia Banner | ||||
Labour | Mike Banner | ||||
Conservative | Joan Lea | ||||
Conservative | Mark Simpson | ||||
Majority | |||||
Turnout | |||||
Swing | |||||
Party | Candidate | Votes | % | ±% | |
---|---|---|---|---|---|
UKIP | Steve Fowler | ||||
Conservative | Dave Hanratty | ||||
Conservative | Sue Hanratty | ||||
Labour | Peter Frank Morson | ||||
Labour | John George Winter | ||||
Majority | |||||
Turnout | |||||
Swing | |||||
Party | Candidate | Votes | % | ±% | |
---|---|---|---|---|---|
Labour | Roger Ball | ||||
Conservative | Colin Charles Hayfield | ||||
Labour | Mary Phillips | ||||
Conservative | Leslie John Smith | ||||
Majority | |||||
Turnout | |||||
Swing | |||||
Party | Candidate | Votes | % | ±% | |
---|---|---|---|---|---|
Conservative | Kath Johnston | ||||
Labour | Carmel Mary Morson | ||||
Labour | Kieren Luke Moss | ||||
Conservative | Tim Wykes | ||||
Majority | |||||
Turnout | |||||
gain from | Swing | ||||
Party | Candidate | Votes | % | ±% | |
---|---|---|---|---|---|
Conservative | Richard Freer | ||||
Labour | Ann Lewis | ||||
Independent | Tony Moppett | ||||
Labour | Hayden Albert Phillips | ||||
Conservative | Howard Smith | ||||
Independent | Ian Frederick Thomas | ||||
Majority | |||||
Turnout | |||||
gain from | Swing | ||||
Party | Candidate | Votes | % | ±% | |
---|---|---|---|---|---|
Independent | Carol Ann Ayasamy | ||||
Independent | Andrew Roy Jenns | ||||
Conservative | Dave Moffatt | ||||
Labour | Brian Peter Moss | ||||
Labour | Margaret Ceridwen Moss | ||||
Conservative | Stuart Swan | ||||
Majority | |||||
Turnout | |||||
gain from | Swing | ||||
Party | Candidate | Votes | % | ±% | |
---|---|---|---|---|---|
Conservative | David John Humphreys | ||||
Conservative | Tilly May | ||||
Labour | Owen George Phillips | ||||
Labour | Eleanor Mary Pugh | ||||
Majority | |||||
Turnout | |||||
Swing | |||||
Party | Candidate | Votes | % | ±% | |
---|---|---|---|---|---|
Conservative | Karen Marie Mercer-West | ||||
Conservative | Colin Walter Peat | ||||
Labour | Mick Stanley | ||||
Labour | Yvette Karen Stanley | ||||
Majority | |||||
Turnout | |||||
Swing | |||||
Party | Candidate | Votes | % | ±% | |
---|---|---|---|---|---|
Labour | Dave Butcher | ||||
Conservative | Lee Clarke | ||||
Conservative | Wendy Christine Smitten | ||||
Labour | Alison Helen Stanley | ||||
Majority | |||||
Turnout | |||||
Swing | |||||
Party | Candidate | Votes | % | ±% | |
---|---|---|---|---|---|
Labour | Tom Foley | ||||
Labour | Dan Hodkinson | ||||
Conservative | Allan Francis Holland | ||||
Conservative | Ray Pyne | ||||
Majority | |||||
Turnout | |||||
gain from | Swing | ||||
North Warwickshire is a local government district with borough status in Warwickshire, England. The borough includes the two towns of Atherstone and Coleshill, and the large villages of Polesworth, Kingsbury, Hartshill and Water Orton along with smaller villages and surrounding rural areas.
The 1964 Southwark Council election took place on 7 May 1964 to elect members of Southwark London Borough Council in London, England. The whole council was up for election and the Labour party gained control of the council.
The 1990 Newham London Borough Council election to the Newham London Borough Council was held on 3 May 1990. The whole council was up for election. turnout no change was 33.0%. Labour maintained its overwhelming majority.
The 1964 Lewisham Council election took place on 7 May 1964 to elect members of Lewisham London Borough Council in London, England. The whole council was up for election and the Labour Party gained control of the council.
The 1990 United Kingdom local elections were held on Thursday 3 May 1990. They were the last local elections held before the resignation of Prime Minister Margaret Thatcher in November 1990.
Local elections were held in the United Kingdom in 1974, during the life of the minority Labour government of Harold Wilson. Elections were held in all the boroughs of London.
Local elections were held in the United Kingdom in 1978. Elections took place in the London boroughs and metropolitan districts.
Local elections were held in the United Kingdom on 3 May 1979. The results provided some source of comfort to the Labour Party, who recovered some lost ground from local election reversals in previous years, despite losing the general election to the Conservative Party on the same day. The Liberals also gained councillors and a council.
Local elections were held in the United Kingdom in 1980. These were the first annual local elections for the new Conservative Prime Minister Margaret Thatcher. Though the Conservatives in government lost seats, the projected share of the vote was close: Labour Party 42%, Conservative Party 40%, Liberal Party 13%. Labour were still being led by the former prime minister James Callaghan, who resigned later in the year to be succeeded by Michael Foot.
Local elections were held in the United Kingdom in 1982. The elections coincided with rising popularity of the Conservative government and Prime Minister Margaret Thatcher, which was mostly attributed to the Falklands War. The projected share of the vote was Conservatives 40%, Labour 29%, Liberal-SDP Alliance 27%.
The 1986 United Kingdom local elections were held on Thursday 8 May 1986. There was a 3% reduction in the number of councillors, owing to the abolition of the Greater London Council and the Metropolitan County Councils.
The 1987 United Kingdom local elections were held on Thursday 7 May 1987. It was the first time since 1983 that the Conservatives had enjoyed the largest share of the vote in local council elections.
Elections for the London Borough of Merton were held on 3 May 1990 to elect members of Merton London Borough Council in London, England. This was on the same day as other local elections in England and Scotland.
Elections to City of York Council were held on 2 May 2019, as part of the United Kingdom local elections. The election resulted in substantial gains for the Liberal Democrats, who became the largest party, although no party surpassed the 24-seat majority threshold. The Conservatives suffered badly in this election, and lost 12 of the 14 seats they had won at the previous election. The Green Party held all their four seats, and surpassed the Conservatives in the popular vote. Labour gained two seats, although they failed to gain support in rural areas, where voters favoured the Liberal Democrats. On 14 May, The Liberal Democrats and the Green Party announced that they had agreed to run the council in a new 'progressive partnership' coalition, with Green Party leader Andy D'Agorne assuming the role of Deputy Leader of the Council while Liberal Democrat leader Keith Aspden succeeded Ian Gillies as Leader of the Council.
The 1975 Sunderland Metropolitan Borough Council election was held on 1 May 1975. A third of the seats on the Council were up for election, with each of the 26 council wards returning one councillor by first-past-the-post. The election was held on the same day as other local elections.
On 3 May 2007, an election was held to elect councillors to the North Warwickshire Borough Council on the same day as other local elections in the UK. It resulted in the Conservative Party gaining control of the council. The previous election resulted in no overall control with the Labour Party having the highest number of seats at 16.
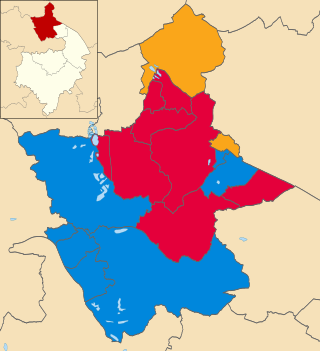
On 1 May 2003, an election was held to elect councillors to the North Warwickshire Borough Council on the same day as other local elections in the UK. It was the first election to take place under the new ward boundaries, with one extra seat from the previous 34 seats added. All 35 seats were up for election and the result was no overall control with the Labour Party having the most seats at 16. The previous election had resulted in the council being controlled by Labour.
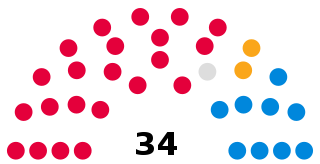
On 6 May 1999, an election was held to elect councillors to the North Warwickshire Borough Council on the same day as other local elections in the UK. It resulted in the Labour Party keeping control of the council. All 34 seats were up for election in all wards.
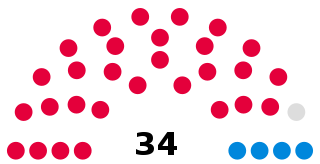
An election was held on 4 May 1995 to elect all 34 members of the North Warwickshire Borough Council in England. It resulted in the Labour Party retaining control of the council.
The 2022 London local elections took place on 5 May 2022, as part of the 2022 United Kingdom local elections. All London borough councillor seats were up for election. Mayoral elections took place in Hackney, Lewisham, Newham and Tower Hamlets, with Croydon electing a mayor for the first time following a local referendum in October 2021.