| ||||||||||||||||||||||||||||||||||||||||||||||||||||||||||||||||
All 30 seats to Newry and Mourne District Council 16 seats needed for a majority | ||||||||||||||||||||||||||||||||||||||||||||||||||||||||||||||||
---|---|---|---|---|---|---|---|---|---|---|---|---|---|---|---|---|---|---|---|---|---|---|---|---|---|---|---|---|---|---|---|---|---|---|---|---|---|---|---|---|---|---|---|---|---|---|---|---|---|---|---|---|---|---|---|---|---|---|---|---|---|---|---|---|
| ||||||||||||||||||||||||||||||||||||||||||||||||||||||||||||||||
Party with the most votes by district. |
Elections to Newry and Mourne District Council were held on 5 May 2011 on the same day as the other Northern Irish local government elections. The election used five district electoral areas to elect a total of 30 councillors.
Party | Seats | Gains | Losses | Net gain/loss | Seats % | Votes % | Votes | +/− | |
---|---|---|---|---|---|---|---|---|---|
Sinn Féin | 14 | 1 | 0 | 1 | 46.7 | 45.2 | 17,877 | 3.1 | |
SDLP | 9 | 1 | 1 | 0 | 30.0 | 28.9 | 11,443 | 0.6 | |
UUP | 3 | 1 | 1 | 0 | 10.0 | 10.3 | 4,078 | 0.5 | |
Independent | 2 | 1 | 1 | 0 | 6.7 | 5.7 | 2,262 | 3.2 | |
UKIP | 1 | 1 | 0 | 1 | 3.3 | 4.8 | 1,910 | New | |
DUP | 1 | 0 | 1 | 1 | 3.3 | 3.0 | 1,172 | 3.7 | |
TUV | 0 | 0 | 0 | 0 | 0.0 | 1.0 | 408 | New | |
Green (NI) | 0 | 0 | 1 | 1 | 0.0 | 1.0 | 382 | 1.0 |
Note: "Votes" are the first preference votes.
Ward | % | Cllrs | % | Cllrs | % | Cllrs | % | Cllrs | % | Cllrs | % | Cllrs | Total Cllrs |
---|---|---|---|---|---|---|---|---|---|---|---|---|---|
Sinn Féin | SDLP | UUP | UKIP | DUP | Others | ||||||||
Crotlieve | 38.1 | 3 | 46.1 | 4 | 7.6 | 0 | 0.0 | 0 | 0.0 | 0 | 8.2 | 0 | 7 |
Newry Town | 43.8 | 3 | 27.2 | 2 | 5.6 | 0 | 0.0 | 0 | 0.0 | 0 | 23.4 | 2 | 7 |
Slieve Gullion | 78.0 | 4 | 22.0 | 1 | 0.0 | 0 | 0.0 | 0 | 0.0 | 0 | 0.0 | 0 | 5 |
The Fews | 46.2 | 2 | 23.3 | 1 | 23.9 | 2 | 0.0 | 0 | 4.3 | 0 | 2.3 | 0 | 6 |
The Mournes | 19.5 | 1 | 20.7 | 1 | 15.6 | 1 | 27.7 | 1 | 12.2 | 1 | 4.3 | 0 | 5 |
Total | 45.2 | 14 | 28.9 | 9 | 10.3 | 3 | 4.8 | 1 | 3.0 | 1 | 7.8 | 2 | 30 |
2005: 3 x SDLP, 2 x Sinn Féin, 1 x Green, 1 x Independent
2011: 4 x SDLP, 3 x Sinn Féin
2005-2011 Change: SDLP and Sinn Féin gain from Green and Independent
Party | Candidate | FPv% | Count | |||||
---|---|---|---|---|---|---|---|---|
1 | 2 | 3 | 4 | 5 | ||||
Sinn Féin | Michael Ruane* | 16.90% | 1,640 | |||||
SDLP | Declan McAteer | 15.12% | 1,467 | |||||
SDLP | Michael Carr* | 13.42% | 1,302 | |||||
Sinn Féin | Mick Murphy * | 12.99% | 1,261 | |||||
SDLP | Sean O'Hare | 12.48% | 1,211 | 1,251.6 | ||||
Sinn Féin | Peter Kearney | 8.24% | 800 | 1,118.36 | 1,158.56 | 1,198.24 | 1,283.24 | |
SDLP | Connaire McGreevey | 5.05% | 490 | 517.16 | 696.36 | 817.88 | 1,031.56 | |
UUP | William Mitchell | 7.55% | 733 | 733.84 | 736.84 | 765.04 | 787.64 | |
Independent | Jarlath Tinnelly | 5.09% | 494 | 517.24 | 530.84 | 584.36 | ||
Green (NI) | Bonnie Anley | 3.16% | 307 | 317.08 | 330.08 | |||
Electorate: 17,357 Valid: 9,705 (55.91%) Spoilt: 154 Quota: 1,214 Turnout: 9,859 (56.80%) |
2005: 3 x Sinn Féin, 3 x SDLP, 1 x Independent
2011: 3 x Sinn Féin, 2 x SDLP, 2 x Independent
2005-2011 Change: Independent gain from SDLP
Party | Candidate | FPv% | Count | ||||||
---|---|---|---|---|---|---|---|---|---|
1 | 2 | 3 | 4 | 5 | 6 | ||||
Sinn Féin | Charlie Casey* | 16.89% | 1,280 | ||||||
Independent | Davy Hyland | 13.29% | 1,007 | ||||||
SDLP | John McArdle* | 10.94% | 829 | 846.28 | 949.28 | ||||
Independent | Jack Patterson* | 9.91% | 751 | 763.96 | 778.31 | 969.31 | |||
Sinn Féin | Valerie Harte | 11.76% | 891 | 930.69 | 935.5 | 937.5 | 947.58 | 986.58 | |
SDLP | Frank Feely * | 5.29% | 401 | 411.8 | 562.23 | 619.23 | 624.72 | 968.72 | |
Sinn Féin | Brendan Curran* | 8.34% | 632 | 722.72 | 740.12 | 743.39 | 756.8 | 822.04 | |
Sinn Féin | Marian O'Reilly* | 6.84% | 518 | 654.08 | 660.16 | 662.16 | 673.14 | 687.49 | |
SDLP | Gary Stokes* | 6.84% | 518 | 523.4 | 542.67 | 585.67 | 601.15 | ||
UUP | Colin McElroy | 5.60% | 424 | 425.35 | 426.35 | ||||
SDLP | Joe Coyle | 4.18% | 317 | 330.23 | |||||
Independent | James Malone | 0.13% | 10 | 10.81 | |||||
Electorate: 13,721 Valid: 7,578 (55.23%) Spoilt: 153 Quota: 948 Turnout: 7,731 (56.34%) |
2005: 4 x Sinn Féin, 1 x SDLP
2011: 4 x Sinn Féin, 1 x SDLP
2005-2011 Change: No change
Party | Candidate | FPv% | Count | ||
---|---|---|---|---|---|
1 | 2 | ||||
SDLP | Geraldine Donnelly* | 22.05% | 1,681 | ||
Sinn Féin | Terry Hearty* | 17.31% | 1,320 | ||
Sinn Féin | Colman Burns* | 17.21% | 1,312 | ||
Sinn Féin | Anthony Flynn* | 15.28% | 1,165 | 1,327.87 | |
Sinn Féin | Patrick McDonald* | 15.29% | 1,166 | 1,295.93 | |
Sinn Féin | Padra McNamee | 12.85% | 980 | 1,094.07 | |
Electorate: 11,983 Valid: 7,624 (63.62%) Spoilt: 150 Quota: 1,271 Turnout: 7,774 (64.88%) |
2005: 3 x Sinn Féin, 1 x UUP, 1 x SDLP, 1 x DUP
2011: 3 x Sinn Féin, 2 x UUP, 1 x SDLP
2005-2011 Change: UUP gain from DUP
Party | Candidate | FPv% | Count | ||||||
---|---|---|---|---|---|---|---|---|---|
1 | 2 | 3 | 4 | 5 | 6 | ||||
UUP | Andy Moffett* | 18.41% | 1,421 | ||||||
Sinn Féin | Turlough Murphy | 16.83% | 1,299 | ||||||
Sinn Féin | Patrick McGinn* | 15.60% | 1,204 | ||||||
SDLP | John Feehan* | 15.43% | 1,191 | ||||||
Sinn Féin | Jimmy McCreesh* | 13.80% | 1,065 | 1,066.15 | 1,242.95 | ||||
UUP | David Taylor | 5.51% | 425 | 667.42 | 667.58 | 667.74 | 668.49 | 1,146.39 | |
SDLP | Kevin O'Hare | 7.85% | 606 | 611.75 | 621.99 | 654.47 | 749.47 | 759.79 | |
DUP | Glenn Oliver* | 4.29% | 331 | 368.49 | 369.13 | 369.61 | 370.61 | ||
TUV | Barrie Halliday | 2.31% | 178 | 203.3 | 203.62 | 204.1 | 204.85 | ||
Electorate: 12,613 Valid: 7,720 (61.21%) Spoilt: 167 Quota: 1,103 Turnout: 7,887 (62.53%) |
2005: 2 x UUP, 1 x DUP, 1 x SDLP, 1 x Sinn Féin
2011: 1 x UKIP, x UUP, 1 x DUP, 1 x SDLP, 1 x Sinn Féin
2005-2011 Change: UKIP gain from UUP
Party | Candidate | FPv% | Count | ||||||
---|---|---|---|---|---|---|---|---|---|
1 | 2 | 3 | 4 | 5 | 6 | ||||
UKIP | Henry Reilly * | 27.66% | 1,910 | ||||||
Sinn Féin | Sean Doran | 19.46% | 1,344 | ||||||
SDLP | Seán Rogers | 14.34% | 990 | 999.6 | 1,110.94 | 1,133.43 | 1,533.43 | ||
DUP | William Burns* | 11.35% | 784 | 972.4 | 973.16 | 1,124.96 | 1,136.17 | 1,151.17 | |
UUP | Harold McKee * | 8.47% | 585 | 846.2 | 846.2 | 966 | 975.48 | 992.48 | |
UUP | David McCauley | 7.10% | 490 | 641.2 | 642.34 | 724.33 | 731.68 | 768.68 | |
SDLP | Theresa McLaverty | 6.37% | 440 | 445.6 | 513.62 | 544.98 | |||
TUV | Arthur Coulter | 3.33% | 230 | 323.6 | 323.98 | ||||
DUP | Michelle Burns | 0.83% | 57 | 89.4 | 90.35 | ||||
Green (NI) | Heather McDermott | 1.09% | 75 | 79.4 | 88.52 | ||||
Electorate: 11,005 Valid: 6,905 (62.74%) Spoilt: 99 Quota: 1,151 Turnout: 7,004 (63.64%) |
Elections to Belfast City Council were held on 5 May 2011 on the same day as the other Northern Irish local government elections. The election used nine district electoral areas to elect a total of 51 councillors, most representing the more heavily populated north and west.
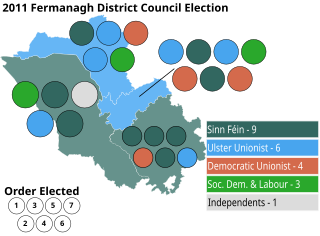
Elections to Fermanagh District Council were held on 5 May 2011 on the same day as the other Northern Irish local government elections. The election used four district electoral areas to elect a total of 23 councillors.
The 2019 election to the Newry, Mourne and Down District Council, part of the Northern Ireland local elections that were held on 2 May 2019 returned 41 members to the council via Single Transferable Vote.
Elections to Newtownabbey Borough Council were held on 5 May 2011 on the same day as the other Northern Irish local government elections. The election used four district electoral areas to elect a total of 25 councillors.
Elections to Ballymena Borough Council were held on 5 May 2011 on the same day as the other Northern Irish local government elections. The election used four district electoral areas to elect a total of 24 councillors.
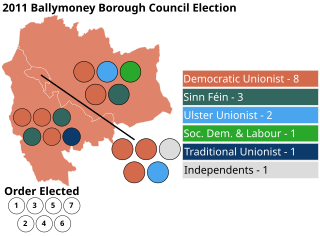
Elections to Ballymoney Borough Council were held on 5 May 2011 on the same day as the other Northern Irish local government elections. The election used three district electoral areas to elect a total of 16 councillors.
Elections to Craigavon Borough Council were held on 5 May 2011 on the same day as the other Northern Irish local government elections. The election used four district electoral areas to elect a total of 26 councillors.
Elections to Armagh City and District Council were held on 5 May 2011 on the same day as the other Northern Irish local government elections. The election used four district electoral areas to elect a total of 22 councillors.
Elections to Newry and Mourne District Council were held on 5 May 2005 on the same day as the other Northern Irish local government elections. The election used five district electoral areas to elect a total of 30 councillors.
Elections to Newry and Mourne District Council were held on 7 June 2001 on the same day as the other Northern Irish local government elections. The election used five district electoral areas to elect a total of 30 councillors.
Elections to Newry and Mourne District Council were held on 21 May 1997 on the same day as the other Northern Irish local government elections. The election used five district electoral areas to elect a total of 30 councillors.
Elections to Newry and Mourne District Council were held on 19 May 1993 on the same day as the other Northern Irish local government elections. The election used five district electoral areas to elect a total of 30 councillors.
Elections to Newry and Mourne District Council were held on 17 May 1989 on the same day as the other Northern Irish local government elections. The election used five district electoral areas to elect a total of 30 councillors.
Elections to Strabane District Council were held on 5 May 2011 on the same day as the other Northern Irish local government elections. The election used three district electoral areas to elect a total of 16 councillors.
Portadown is one of the seven district electoral areas (DEA) in Armagh City, Banbridge and Craigavon, Northern Ireland. The district elects six members to Armagh City, Banbridge and Craigavon Borough Council and contains the wards of Ballybay, Corcrain, Killycomain, Loughgall, Mahon and The Birches. Portadown forms part of the Upper Bann constituencies for the Northern Ireland Assembly and UK Parliament.
The Mournes is one of the seven district electoral areas (DEA) in Newry, Mourne and Down, Northern Ireland. The district elects seven members to Newry, Mourne and Down District Council and contains the wards of Annalong, Binnian, Donard, Kilkeel, Lisnacree, Murlough and Tollymore. The Mournes forms part of the South Down constituencies for the Northern Ireland Assembly and UK Parliament.
Crotlieve is one of the seven district electoral areas (DEA) in Newry, Mourne and Down, Northern Ireland. The district elects six members to Newry, Mourne and Down District Council and contains the wards of Burren, Derryleckagh, Hilltown, Mayobridge, Rostrevor and Warrenpoint. Crotlieve forms part of the South Down constituencies for the Northern Ireland Assembly and UK Parliament.
Newry is one of the seven district electoral areas (DEA) in Newry, Mourne and Down, Northern Ireland. The district elects six members to Newry, Mourne and Down District Council and contains the wards of Abbey, Ballybot, Damolly, Drumalane, Fathom and St. Patrick's. Newry forms part of the Newry and Armagh constituencies for the Northern Ireland Assembly and UK Parliament.
Slieve Gullion is one of the seven district electoral areas (DEA) in Newry, Mourne and Down, Northern Ireland. The district elects seven members to Newry, Mourne and Down District Council and contains the wards of Bessbrook, Camlough, Crossmaglen, Forkhill, Mullaghbane, Newtownhamilton and Whitecross. Slieve Gullion forms part of the Newry and Armagh constituencies for the Northern Ireland Assembly and UK Parliament.
The Fews was one of the three district electoral areas in Newry and Mourne, Northern Ireland which existed from 1985 to 2014. The district elected six members to Newry and Mourne District Council, and formed part of the Newry and Armagh constituencies for the Northern Ireland Assembly and UK Parliament.