| |||||||||||||||||||||||||||||||||||||||||||||||||||||||||||||
All 23 seats to Castlereagh Borough Council 12 seats needed for a majority | |||||||||||||||||||||||||||||||||||||||||||||||||||||||||||||
---|---|---|---|---|---|---|---|---|---|---|---|---|---|---|---|---|---|---|---|---|---|---|---|---|---|---|---|---|---|---|---|---|---|---|---|---|---|---|---|---|---|---|---|---|---|---|---|---|---|---|---|---|---|---|---|---|---|---|---|---|---|
| |||||||||||||||||||||||||||||||||||||||||||||||||||||||||||||
2011 Castlereagh City Council Election Results, shaded by First Preference Votes. |
Elections to Castlereagh Borough Council were held on 5 May 2011 on the same day as the other Northern Irish local government elections. The election used four district electoral areas to elect a total of 23 councillors.
Party | Seats | Gains | Losses | Net gain/loss | Seats % | Votes % | Votes | +/− | |
---|---|---|---|---|---|---|---|---|---|
DUP | 11 | 0 | 2 | 2 | 47.8 | 42.6 | 10,390 | 3.9 | |
Alliance | 6 | 2 | 0 | 2 | 26.1 | 25.2 | 6,142 | 9.0 | |
UUP | 3 | 0 | 1 | 1 | 13.0 | 11.2 | 2,717 | 6.6 | |
SDLP | 2 | 0 | 0 | 8.7 | 11.0 | 2,681 | 1.0 | ||
Green (NI) | 1 | 1 | 0 | 1 | 4.3 | 2.9 | 716 | 2.9 | |
Sinn Féin | 0 | 0 | 0 | 0.0 | 3.0 | 735 | 1.5 | ||
PUP | 0 | 0 | 0 | 0.0 | 1.3 | 323 | 0.8 | ||
TUV | 0 | 0 | 0 | 0.0 | 1.0 | 245 | New | ||
BNP | 0 | 0 | 0 | 0.0 | 0.8 | 205 | New | ||
NI Conservatives | 0 | 0 | 0 | 0.0 | 0.5 | 120 | 0.5 | ||
People Before Profit | 0 | 0 | 0 | 0.0 | 0.4 | 93 | New |
Note: "Votes" are the first preference votes.
Ward | % | Cllrs | % | Cllrs | % | Cllrs | % | Cllrs | % | Cllrs | % | Cllrs | Total Cllrs |
---|---|---|---|---|---|---|---|---|---|---|---|---|---|
DUP | Alliance | UUP | SDLP | Green | Others | ||||||||
Castlereagh Central | 41.4 | 3 | 28.8 | 2 | 12.9 | 1 | 5.7 | 0 | 0.0 | 0 | 11.2 | 0 | 6 |
Castlereagh East | 56.0 | 4 | 26.3 | 2 | 5.6 | 1 | 0.0 | 0 | 7.7 | 1 | 4.4 | 0 | 7 |
Castlereagh South | 36.5 | 2 | 19.6 | 1 | 12.0 | 1 | 22.6 | 0 | 0.0 | 0 | 9.3 | 0 | 5 |
Castlereagh West | 32.7 | 2 | 27.0 | 1 | 16.1 | 1 | 17.3 | 1 | 0.0 | 0 | 6.9 | 0 | 5 |
Total | 42.6 | 11 | 25.2 | 6 | 11.2 | 3 | 11.0 | 2 | 2.9 | 1 | 7.1 | 0 | 23 |
2005: 4 x DUP, 1 x Alliance, 1 x UUP
2011: 3 x DUP, 2 x Alliance, 1 x UUP
2005-2011 Change: Alliance gain from DUP
Party | Candidate | FPv% | Count | ||||||||
---|---|---|---|---|---|---|---|---|---|---|---|
1 | 2 | 3 | 4 | 5 | 6 | 7 | 8 | ||||
Alliance | Michael Long * | 18.14% | 919 | ||||||||
DUP | Vivienne McCoy | 14.21% | 720 | 727.35 | |||||||
UUP | Michael Copeland * | 12.91% | 654 | 667.65 | 763.65 | ||||||
Alliance | Carole Howard | 10.64% | 539 | 676.34 | 696.23 | 706.43 | 926.43 | ||||
DUP | Tommy Sandford | 12.51% | 634 | 639.46 | 675.88 | 688.12 | 692.75 | 700.75 | 943.75 | ||
DUP | Denny Vitty | 8.64% | 438 | 439.47 | 453.47 | 457.55 | 457.55 | 457.55 | 508.37 | 723.97 | |
PUP | Jason Burke | 6.37% | 323 | 326.36 | 353.36 | 362.2 | 369.67 | 394.67 | 401.67 | 405.59 | |
DUP | Sharon Skillen | 6.08% | 308 | 310.31 | 324.31 | 328.39 | 329.81 | 329.81 | |||
SDLP | Rosaleen Hughes | 5.66% | 287 | 300.23 | 303.44 | 303.44 | |||||
TUV | Alan Carson | 4.84% | 245 | 247.94 | |||||||
Electorate: 9,341 Valid: 5,067 (54.24%) Spoilt: 104 Quota: 724 Turnout: 5,171 (55.36%) |
2005: 5 x DUP, 1 x Alliance, 1 x UUP
2011: 4 x DUP, 2 x Alliance, 1 x Green
2005-2011 Change: Alliance and Green gain from DUP and UUP
Party | Candidate | FPv% | Count | |||||||
---|---|---|---|---|---|---|---|---|---|---|
1 | 2 | 3 | 4 | 5 | 6 | 7 | ||||
DUP | Gareth Robinson* | 24.25% | 1,804 | |||||||
Alliance | Judith Cochrane * | 17.60% | 1,309 | |||||||
DUP | Jim White* | 5.93% | 441 | 939.5 | ||||||
Alliance | Tim Morrow | 8.74% | 650 | 676 | 986.01 | |||||
DUP | Tommy Jeffers* | 10.22% | 760 | 920.5 | 928.62 | 962.62 | ||||
DUP | David Drysdale* | 8.72% | 649 | 720.5 | 730.07 | 780.02 | 786.18 | 796.18 | 900.04 | |
Green (NI) | Martin Gregg | 7.72% | 574 | 599 | 620.46 | 684.99 | 713.34 | 716.34 | 870.15 | |
DUP | Aileen Graham | 6.86% | 510 | 572 | 575.48 | 588.27 | 591.14 | 598.14 | 687 | |
UUP | Hazel Legge | 5.61% | 417 | 433 | 444.6 | 553 | 565.04 | 570.04 | ||
BNP | Ann Cooper | 2.76% | 205 | 216 | 219.19 | |||||
NI Conservatives | Terry Dick | 1.61% | 120 | 122.5 | 129.46 | |||||
Electorate: 14,291 Valid: 7,439 (52.05%) Spoilt: 118 Quota: 930 Turnout: 7,557 (52.88%) |
2005: 2 x DUP, 1 x SDLP, 1 x Alliance, 1 x UUP
2011: 2 x DUP, 1 x SDLP, 1 x Alliance, 1 x UUP
2005-2011 Change: No change
Party | Candidate | FPv% | Count | ||||||
---|---|---|---|---|---|---|---|---|---|
1 | 2 | 3 | 4 | 5 | 6 | ||||
DUP | James Spratt * | 23.75% | 1,535 | ||||||
Alliance | Geraldine Rice* | 19.64% | 1,269 | ||||||
DUP | John Beattie* | 12.74% | 823 | 1,229.8 | |||||
SDLP | Brian Hanvey* | 14.67% | 948 | 949.8 | 993.49 | 996.37 | 1,041.66 | 1,289.66 | |
UUP | Michael Henderson* | 9.15% | 591 | 610.8 | 648.54 | 748.22 | 1,022.29 | 1,024.92 | |
SDLP | Sean Mullan | 7.89% | 510 | 513 | 542.58 | 543.22 | 584.68 | 759.44 | |
Sinn Féin | James Irwin | 7.10% | 459 | 460.5 | 464.75 | 464.91 | 478.94 | ||
UUP | Barbara McBurney | 2.86% | 185 | 201.5 | 229.89 | 268.93 | |||
Green (NI) | Rebecca Volley | 2.20% | 142 | 143.8 | 190.04 | 195.8 | |||
Electorate: 12,061 Valid: 6,462 (53.58%) Spoilt: 90 Quota: 1,078 Turnout: 6,552 (54.32%) |
2005: 2 x DUP, 1 x Alliance, 1 x SDLP, 1 x UUP
2011: 2 x DUP, 1 x Alliance, 1 x SDLP, 1 x UUP
2005-2011 Change: No change
Party | Candidate | FPv% | Count | |||||
---|---|---|---|---|---|---|---|---|
1 | 2 | 3 | 4 | 5 | ||||
Alliance | Sara Duncan* | 26.97% | 1,456 | |||||
DUP | Ann-Marie Beattie* | 21.08% | 1,138 | |||||
SDLP | Peter O'Reilly | 17.34% | 936 | |||||
DUP | Myreve Chambers* | 11.67% | 630 | 726 | 948.6 | |||
UUP | Cecil Hall* | 11.13% | 601 | 768.5 | 777.11 | 811.61 | 850.67 | |
UUP | Bill White | 4.98% | 269 | 370.5 | 374.07 | 397.78 | 405.22 | |
Sinn Féin | Laura Keenan | 5.11% | 276 | 340 | 340.21 | 386.71 | 387.13 | |
People Before Profit | Gordon Hewitt | 1.72% | 93 | 215 | 215.21 | |||
Electorate: 10,045 Valid: 5,399 (53.75%) Spoilt: 100 Quota: 900 Turnout: 5,499 (54.74%) |
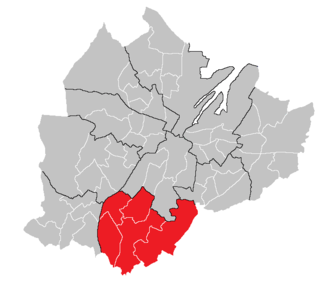
Balmoral is the most southern of ten district electoral areas (DEA) in Belfast, Northern Ireland. The district elects five members to Belfast City Council and contains the wards of Belvoir; Finaghy; Malone; Musgrave; Windsor; and Upper Malone. Balmoral, along with neighbouring Botanic, forms the greater part of the Belfast South constituencies for the Northern Ireland Assembly and UK Parliament.
Elections to Belfast City Council were held on 5 May 2011 on the same day as the other Northern Irish local government elections. The election used nine district electoral areas to elect a total of 51 councillors, most representing the more heavily populated north and west.
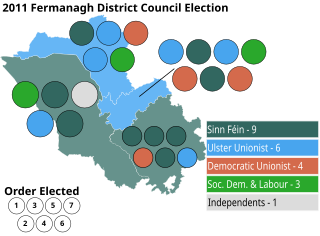
Elections to Fermanagh District Council were held on 5 May 2011 on the same day as the other Northern Irish local government elections. The election used four district electoral areas to elect a total of 23 councillors.
Elections to Ards Borough Council were held on 5 May 2011 on the same day as the other Northern Irish local government elections. The election used four district electoral areas to elect a total of 23 councillors.
Elections to Castlereagh Borough Council were held on 5 May 2005 on the same day as the other Northern Irish local government elections. The election used four district electoral areas to elect a total of 23 councillors.
Elections to Lisburn City Council were held on 5 May 2011 on the same day as the other Northern Irish local government elections. The election used five district electoral areas to elect a total of 30 councillors.
Elections to Newtownabbey Borough Council were held on 5 May 2011 on the same day as the other Northern Irish local government elections. The election used four district electoral areas to elect a total of 25 councillors.
Elections to Antrim Borough Council were held on 5 May 2011 on the same day as the other Northern Irish local government elections. The election used three district electoral areas to elect a total of 19 councillors.
Elections to Larne Borough Council were held on 5 May 2011 on the same day as the other Northern Irish local government elections. The election used three district electoral areas to elect a total of 15 councillors.
Elections to Ballymena Borough Council were held on 5 May 2011 on the same day as the other Northern Irish local government elections. The election used four district electoral areas to elect a total of 24 councillors.
Elections to Coleraine Borough Council were held on 5 May 2011 on the same day as the other Northern Irish local government elections. The election used four district electoral areas to elect a total of 22 councillors.
Elections to Craigavon Borough Council were held on 5 May 2011 on the same day as the other Northern Irish local government elections. The election used four district electoral areas to elect a total of 26 councillors.
Elections to Banbridge District Council were held on 5 May 2011 on the same day as the other Northern Irish local government elections. The election used three district electoral areas to elect a total of 17 councillors.
Elections to Armagh City and District Council were held on 5 May 2011 on the same day as the other Northern Irish local government elections. The election used four district electoral areas to elect a total of 22 councillors.
Elections to Down District Council were held on 5 May 2011 on the same day as the other Northern Irish local government elections. The election used four district electoral areas to elect a total of 23 councillors.
Elections to Newry and Mourne District Council were held on 5 May 2011 on the same day as the other Northern Irish local government elections. The election used five district electoral areas to elect a total of 30 councillors.
Castlereagh South is one of the seven district electoral areas (DEA) in Lisburn and Castlereagh, Northern Ireland. The district elects five members to Lisburn and Castlereagh City Council and contains the wards of Beechill, Cairnshill, Carryduff East, Carryduff West, Galwally, Knockbracken and Newtownbreda. Castlereagh South forms part of the Belfast South constituencies for the Northern Ireland Assembly and UK Parliament.
Castlereagh West was one of the four district electoral areas in Castlereagh, Northern Ireland which existed from 1993 to 2014. The district elected five members to Castlereagh Borough Council, and formed part of Belfast South constituencies for the Northern Ireland Assembly and UK Parliament.
Lisburn North is one of the seven district electoral areas (DEA) in Lisburn and Castlereagh, Northern Ireland. The district elects six members to Lisburn and Castlereagh City Council and contains the wards of Derryaghy, Harmony Hill, Hilden, Lambeg, Magheralave and Wallace Park. Lisburn North forms part of the Lagan Valley constituencies for the Northern Ireland Assembly and UK Parliament.
Killultagh is one of the seven district electoral areas (DEA) in Lisburn and Castlereagh, Northern Ireland. The district elects five members to Lisburn and Castlereagh City Council and contains the wards of Ballinderry, Glenavy, Maghaberry, Stonyford and White Mountain. Killultagh forms part of the Lagan Valley constituencies for the Northern Ireland Assembly and UK Parliament, and part of the South Antrim constituencies for the Northern Ireland Assembly and UK Parliament.