The 2011 Pendle Borough Council election took place on 5 May 2011 to elect members of Pendle Borough Council in Lancashire, England. One third of the council was up for election and the council stayed under no overall control. [1]
After the election, the composition of the council was
Before the election there were 17 Conservatives, 16 Liberal Democrats, 13 Labour, 2 British National Party and 1 independent councillors. [3] At the last election in 2010 the Liberal Democrats lost the leadership of the council and an agreement between the Conservative and Labour parties took control of the council, with Conservative Mike Blomeley becoming leader of the council, after attempts at forming an all party cabinet failed. [3] However Labour withdrew from the agreement with the Conservatives in February 2011. [4]
17 seats were contested at the election, with 6 sitting councillors standing down, Martin Bell from Craven ward, Carol Belshaw from Foulridge ward, Gary Bird from Clover Hill ward, Allan Buck from Coates ward, Sonia Robinson from Southfield ward and Violet Vaughan from Boulsworth ward. [3]
After having run the council until the 2010 election, the Liberal Democrats fell to third on the council with 12 seats, behind the Conservatives on 18 seats and Labour on 16 seats. [4] The Liberal Democrats lost 4 seats, Craven and Vivary Bridge to the Conservatives, and Clover Hill and Southfield to Labour, with the Liberal Democrat leader on the council John David holding his seat in Old Laund Booth by only 10 votes. [4] Labour picked up 3 seats, taking Reedley from the Conservatives, in addition to the party's 2 gains from the Liberal Democrats, while the Conservatives ended up with 1 extra seat on the council. [4] Overall turnout at the election was 43.7%. [5]
Following the election, Conservative Mike Blomeley remained as leader of the council with an all Conservative cabinet, [6] meanwhile Liberal Democrat Nadeem Ahmed became the youngest mayor of Pendle at the age of 32. [7]
Party | Seats | Gains | Losses | Net gain/loss | Seats % | Votes % | Votes | +/− | |
---|---|---|---|---|---|---|---|---|---|
Conservative | 8 | 2 | 1 | +1 | 47.1 | 41.2 | 10,577 | +7.1% | |
Labour | 5 | 3 | 0 | +3 | 29.4 | 37.2 | 9,551 | +9.2% | |
Liberal Democrats | 4 | 0 | 4 | -4 | 23.5 | 18.0 | 4,618 | -11.3% | |
BNP | 0 | 0 | 0 | 0 | 0 | 1.8 | 452 | -6.2% | |
English Democrat | 0 | 0 | 0 | 0 | 0 | 1.0 | 263 | +1.0% | |
England First | 0 | 0 | 0 | 0 | 0 | 0.7 | 172 | +0.0% | |
UKIP | 0 | 0 | 0 | 0 | 0 | 0.2 | 62 | +0.2% | |
Party | Candidate | Votes | % | ±% | |
---|---|---|---|---|---|
Conservative | Linda Crossley | 1,045 | 57.8 | +2.8 | |
Labour | Sue Nike | 763 | 42.2 | +10.3 | |
Majority | 282 | 15.6 | -7.5 | ||
Turnout | 1,808 | 45.0 | -25.3 | ||
Conservative hold | Swing | ||||
Party | Candidate | Votes | % | ±% | |
---|---|---|---|---|---|
Conservative | Shelagh Derwent | 583 | 79.8 | +0.0 | |
Labour | John Pope | 148 | 20.2 | +8.9 | |
Majority | 435 | 59.5 | -9.0 | ||
Turnout | 731 | 49.7 | +0.2 | ||
Conservative hold | Swing | ||||
Party | Candidate | Votes | % | ±% | |
---|---|---|---|---|---|
Conservative | Paul White | 1,000 | 53.6 | +5.6 | |
Labour | Julian Jordan | 512 | 27.4 | +6.5 | |
Liberal Democrats | James Kerrigan | 355 | 19.0 | -2.5 | |
Majority | 488 | 26.1 | -0.4 | ||
Turnout | 1,867 | 44.7 | -29.5 | ||
Conservative hold | Swing | ||||
Party | Candidate | Votes | % | ±% | |
---|---|---|---|---|---|
Labour | Nadeem Younis | 1,339 | 70.5 | +22.1 | |
Conservative | Tim Eyre | 218 | 11.5 | -1.8 | |
England First | David Geddes | 172 | 9.1 | -0.6 | |
Liberal Democrats | Kenneth Massey | 171 | 9.0 | -19.5 | |
Majority | 1,121 | 59.0 | +39.1 | ||
Turnout | 1,900 | 41.7 | -20.4 | ||
Labour hold | Swing | ||||
Party | Candidate | Votes | % | ±% | |
---|---|---|---|---|---|
Labour | Nawaz Ahmed | 1,161 | 64.1 | +21,3 | |
Conservative | Jack Gregory | 650 | 35.9 | +7.7 | |
Majority | 511 | 28.2 | +13.6 | ||
Turnout | 1,811 | 49.0 | -24.4 | ||
Labour hold | Swing | ||||
Party | Candidate | Votes | % | ±% | |
---|---|---|---|---|---|
Labour | Richard Smith | 775 | 51.4 | +19.1 | |
Conservative | Janice Taylor | 358 | 23.8 | -0.6 | |
Liberal Democrats | James Wood | 213 | 14.1 | -15.8 | |
BNP | Julie Fairless | 161 | 10.7 | -2.7 | |
Majority | 417 | 27.7 | +25.3 | ||
Turnout | 1,507 | 40.3 | -23.6 | ||
Labour gain from Liberal Democrats | Swing | ||||
Party | Candidate | Votes | % | ±% | |
---|---|---|---|---|---|
Liberal Democrats | Janine Throupe | 775 | 45.5 | +0.1 | |
Conservative | Stephanie Clarke | 593 | 34.8 | +2.3 | |
Labour | Ian Tweedie | 336 | 19.7 | +7.7 | |
Majority | 182 | 10.7 | -2.3 | ||
Turnout | 1,704 | 41.7 | -26.4 | ||
Liberal Democrats hold | Swing | ||||
Party | Candidate | Votes | % | ±% | |
---|---|---|---|---|---|
Conservative | Jennifer Purcell | 768 | 42.5 | +1.8 | |
Liberal Democrats | David Stead | 719 | 39.8 | -7.8 | |
Labour | Bill Roberts | 321 | 17.8 | +6.1 | |
Majority | 49 | 2.7 | |||
Turnout | 1,808 | 42.7 | -25.5 | ||
Conservative gain from Liberal Democrats | Swing | ||||
Party | Candidate | Votes | % | ±% | |
---|---|---|---|---|---|
Conservative | Morris Horsfield | 1,145 | 53.7 | 2.8 | |
Labour | Hazel Rycroft | 513 | 24.1 | +9.7 | |
English Democrat | James Jackman | 263 | 12.3 | +12.3 | |
Liberal Democrats | Jackie Taylforth | 210 | 9.9 | -10.9 | |
Majority | 632 | 29.7 | -0.4 | ||
Turnout | 2,131 | 44.6 | -24.6 | ||
Conservative hold | Swing | ||||
Party | Candidate | Votes | % | ±% | |
---|---|---|---|---|---|
Conservative | Graham Waugh | 551 | 78.7 | +22.6 | |
Labour | Denzil Metcalfe | 149 | 21.3 | +13.4 | |
Majority | 402 | 57.4 | +23.0 | ||
Turnout | 700 | 51.6 | +6.9 | ||
Conservative hold | Swing | ||||
Party | Candidate | Votes | % | ±% | |
---|---|---|---|---|---|
Conservative | James Starkie | 625 | 80.4 | +18.0 | |
Labour | Robert Oliver | 152 | 19.6 | +13.7 | |
Majority | 473 | 60.9 | +30.2 | ||
Turnout | 777 | 56.1 | -4.8 | ||
Conservative hold | Swing | ||||
Party | Candidate | Votes | % | ±% | |
---|---|---|---|---|---|
Liberal Democrats | Anne Kerrigan | 555 | 37.9 | +3.9 | |
Conservative | Rachel Pearson | 490 | 33.4 | -1.2 | |
Labour | David Foat | 421 | 28.7 | +10.5 | |
Majority | 65 | 4.4 | |||
Turnout | 1,466 | 37.2 | -22.9 | ||
Liberal Democrats hold | Swing | ||||
Party | Candidate | Votes | % | ±% | |
---|---|---|---|---|---|
Liberal Democrats | John David | 367 | 48.5 | -17.5 | |
Conservative | Jill Hartley | 357 | 47.2 | +16.9 | |
Labour | Peter Maltby | 32 | 4.2 | +0.5 | |
Majority | 10 | 1.3 | -34.4 | ||
Turnout | 756 | 61.3 | +3.2 | ||
Liberal Democrats hold | Swing | ||||
Party | Candidate | Votes | % | ±% | |
---|---|---|---|---|---|
Labour | Robert Allen | 1,218 | 53.4 | +25.7 | |
Conservative | Tonia Barton | 1,062 | 46.6 | -2.6 | |
Majority | 156 | 6.8 | |||
Turnout | 2,280 | 54.8 | -17.9 | ||
Labour gain from Conservative | Swing | ||||
Party | Candidate | Votes | % | ±% | |
---|---|---|---|---|---|
Labour | David Whalley | 866 | 53.9 | +15.8 | |
Conservative | Paul McKenna | 363 | 22.6 | -7.7 | |
Liberal Democrats | Judith Robinson | 204 | 12.7 | -18.9 | |
BNP | Lee Karmer | 112 | 7.0 | +7.0 | |
UKIP | John Banks | 62 | 3.9 | +3.9 | |
Majority | 503 | 31.3 | +24.8 | ||
Turnout | 1,607 | 40.2 | -19.6 | ||
Labour gain from Liberal Democrats | Swing | ||||
Party | Candidate | Votes | % | ±% | |
---|---|---|---|---|---|
Conservative | Joe Cooney | 555 | 37.9 | +8.7 | |
Labour | Anthony Hargreaves | 464 | 31.7 | +10.6 | |
Liberal Democrats | Howard Thomas | 444 | 30.3 | -3.9 | |
Majority | 91 | 6.2 | |||
Turnout | 1,463 | 35.9 | -23.7 | ||
Conservative gain from Liberal Democrats | Swing | ||||
Party | Candidate | Votes | % | ±% | |
---|---|---|---|---|---|
Liberal Democrats | Graham Roach | 605 | 43.9 | -0.2 | |
Labour | David Johns | 381 | 27.6 | +8.3 | |
Conservative | Maureen Regan | 214 | 15.5 | -6.3 | |
BNP | John Rowe | 179 | 13.0 | -1.7 | |
Majority | 224 | 16.2 | -6.1 | ||
Turnout | 1,379 | 36.2 | -21.9 | ||
Liberal Democrats hold | Swing | ||||
The 1999 St Helens Metropolitan Borough Council election took place on 6 May 1999 to elect members of St Helens Metropolitan Borough Council in Merseyside, England. One third of the council was up for election and the Labour Party stayed in overall control of the council.
The 1999 Burnley Borough Council election took place on 6 May 1999 to elect members of Burnley Borough Council in Lancashire, England. One third of the council was up for election and the Labour Party stayed in overall control of the council.
The 2010 Rossendale Borough Council election took place on 6 May 2010 to elect members of Rossendale Borough Council in Lancashire, England. One third of the council was up for election and the Conservative Party stayed in overall control of the council.
Elections to Burnley Borough Council in Lancashire, England were held on 4 May 2006. One third of the council was up for election, with by-elections in the Bank Hall and Brunshaw wards. The by-elections followed the resignations of Labour councillor Caroline Kavanagh and (Brunshaw) BNP-turned-independent-with-links-to-Labour councillor Maureen Stowe. No party won overall control of the council.
The 1998 Pendle Borough Council election took place on 7 May 1998 to elect members of Pendle Borough Council in Lancashire, England. One third of the council was up for election and the Liberal Democrats stayed in overall control of the council.
The 1999 Pendle Borough Council election took place on 6 May 1999 to elect members of Pendle Borough Council in Lancashire, England. One third of the council was up for election and the Liberal Democrats lost overall control of the council to no overall control.
The 2000 Pendle Borough Council election took place on 4 May 2000 to elect members of Pendle Borough Council in Lancashire, England. One third of the council was up for election and the council stayed under no overall control.
The 2002 Pendle Borough Council election took place on 2 May 2002 to elect members of Pendle Borough Council in Lancashire, England. The whole council was up for election with boundary changes since the last election in 2000 reducing the number of seats by 2. The council stayed under no overall control.
The 2003 Pendle Borough Council election took place on 1 May 2003 to elect members of Pendle Borough Council in Lancashire, England. One third of the council was up for election and the council stayed under no overall control.
The 2004 Pendle Borough Council election took place on 10 June 2004 to elect members of Pendle Borough Council in Lancashire, England. One third of the council was up for election and the Liberal Democrats gained overall control of the council from no overall control.
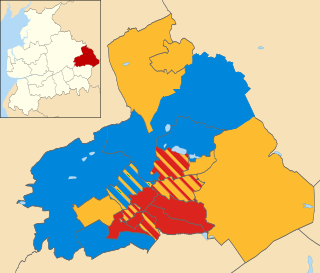
The 2006 Pendle Borough Council election took place on 4 May 2006 to elect members of Pendle Borough Council in Lancashire, England. One third of the council was up for election and the Liberal Democrats stayed in overall control of the council.
The 2007 Pendle Borough Council election took place on 3 May 2007 to elect members of Pendle Borough Council in Lancashire, England. One third of the council was up for election and the Liberal Democrats stayed in overall control of the council.
The 2008 Pendle Borough Council election took place on 1 May 2008 to elect members of Pendle Borough Council in Lancashire, England. One third of the council was up for election and the Liberal Democrats lost overall control of the council to no overall control.
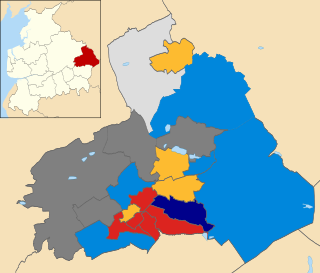
The 2010 Pendle Borough Council election took place on 6 May 2010 to elect members of Pendle Borough Council in Lancashire, England. One third of the council was up for election and the council stayed under no overall control.
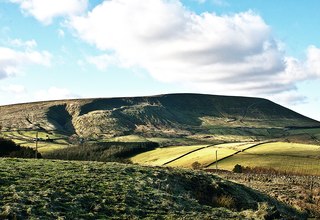
Pendle is a local government district with borough status in Lancashire, England. The council is based in Nelson, the borough's largest town. The borough also includes the towns of Barnoldswick, Brierfield, Colne and Earby along with the surrounding villages and rural areas. Part of the borough lies within the Forest of Bowland Area of Outstanding Natural Beauty.
The 2003 Colchester Borough Council election took place on 1 May 2003 to elect members of Colchester Borough Council in Essex, England. This was the same day as the other 2003 United Kingdom local elections. One third of the seats were up for election and the council stayed under no overall control.
The 2012 Pendle Borough Council election took place on 3 May 2012 to elect members of Pendle Borough Council in Lancashire, England. One third of the council was up for election and the council stayed under no overall control.
The 2014 Pendle Borough Council election took place on 22 May 2014 to elect members of Pendle Borough Council in Lancashire, England. One third of the council was up for election and the council stayed under no overall control.
The 2018 Pendle Borough Council Election took place on 3 May 2018.
Brian Parker is an English politician who served as councillor on Pendle Borough Council for the Marsden ward of Nelson, Lancashire, between 2006 and his retirement in 2018. He is perhaps best known for being the longest-serving far-right local councillor in British history, and for being the last elected representative of the far-right British National Party (BNP). He is currently a member of the British Democratic Party, and has publicly stated that "I am opposed to all black and brown immigration".