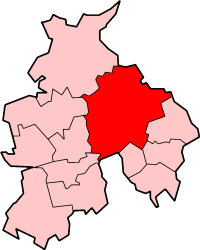
Ribble Valley Borough Council elections are held every four years. Ribble Valley Borough Council is the local authority for the non-metropolitan district of Ribble Valley in Lancashire, England. Since the last boundary changes in 2019, 40 councillors have been elected from 26 wards. [1]
Overall control | Conservative | Lib Dems | Labour | Green | Independent | ||||||
2023 | NOC | 18 | 8 | 7 | 2 | 5 | |||||
2019 | Conservative | 28 | 10 | - | - | 2 | |||||
2015 | Conservative | 35 | 4 | 1 | - | - | |||||
2011 | Conservative | 33 | 6 | - | - | 1 | |||||
2007 | Conservative | 29 | 10 | - | - | 1 | |||||
2003 | Conservative | 22 | 15 | 1 | - | 2 |
Party | Candidate | Votes | % | ±% | |
---|---|---|---|---|---|
Conservative | 242 | 38.6 | |||
Liberal Democrats | 175 | 27.9 | |||
Independent | 137 | 21.9 | |||
Independent | 73 | 11.6 | |||
Majority | 67 | 10.7 | |||
Turnout | 627 | 55.5 | |||
Conservative hold | Swing |
Party | Candidate | Votes | % | ±% | |
---|---|---|---|---|---|
Conservative | 479 | 60.0 | |||
Liberal Democrats | 319 | 40.0 | |||
Majority | 160 | 20.0 | |||
Turnout | 798 | 39.3 | |||
Conservative hold | Swing |
Party | Candidate | Votes | % | ±% | |
---|---|---|---|---|---|
Liberal Democrats | 403 | 64.3 | +2.6 | ||
Conservative | 131 | 20.9 | +6.2 | ||
Labour | 92 | 14.7 | −8.9 | ||
Majority | 272 | 43.4 | |||
Turnout | 626 | 35.3 | |||
Liberal Democrats hold | Swing |
Party | Candidate | Votes | % | ±% | |
---|---|---|---|---|---|
Independent | 303 | 56.1 | +56.1 | ||
Conservative | 237 | 43.9 | −17.9 | ||
Majority | 66 | 12.2 | |||
Turnout | 540 | 47.0 | |||
Independent gain from Conservative | Swing |
Party | Candidate | Votes | % | ±% | |
---|---|---|---|---|---|
Conservative | 224 | 75.2 | +31.6 | ||
Liberal Democrats | 74 | 24.8 | −3.5 | ||
Majority | 150 | 50.4 | |||
Turnout | 298 | 33.6 | |||
Conservative hold | Swing |
Party | Candidate | Votes | % | ±% | |
---|---|---|---|---|---|
Conservative | 220 | 53.1 | −26.6 | ||
Liberal Democrats | 194 | 46.9 | +26.6 | ||
Majority | 26 | 6.2 | |||
Turnout | 414 | 39.7 | |||
Conservative hold | Swing |
Party | Candidate | Votes | % | ±% | |
---|---|---|---|---|---|
Conservative | Carl Ross | 350 | 61.1 | +10.3 | |
Liberal Democrats | 181 | 31.6 | −17.6 | ||
Labour | 42 | 7.3 | +7.3 | ||
Majority | 169 | 29.5 | |||
Turnout | 573 | 24.6 | |||
Conservative gain from Liberal Democrats | Swing |
Party | Candidate | Votes | % | ±% | |
---|---|---|---|---|---|
Conservative | Gary Scott | 439 | 75.3 | −0.4 | |
Liberal Democrats | Howard Douglas | 144 | 24.7 | +0.4 | |
Majority | 295 | 50.6 | |||
Turnout | 583 | ||||
Conservative hold | Swing |
Party | Candidate | Votes | % | ±% | |
---|---|---|---|---|---|
Conservative | Mike Thomas | 530 | 66.8 | +1.4 | |
Liberal Democrats | Susan Knox | 263 | 33.2 | −1.4 | |
Majority | 267 | 33.6 | |||
Turnout | 793 | ||||
Conservative hold | Swing |
Party | Candidate | Votes | % | ±% | |
---|---|---|---|---|---|
Conservative | Ian Brown | 208 | 34.0 | +4.6 | |
Liberal Democrats | Simon O'Rourke | 204 | 33.4 | +9.2 | |
UKIP | Steve Rush | 159 | 26.0 | +5.7 | |
Labour | Mike Rose | 40 | 6.5 | −3.4 | |
Majority | 4 | 0.7 | |||
Turnout | 611 | ||||
Conservative gain from Liberal Democrats | Swing |
Party | Candidate | Votes | % | ±% | |
---|---|---|---|---|---|
Liberal Democrats | James Shervey | 361 | 44.9 | +6.1 | |
Independent | Steve Rush | 249 | 31.0 | +31.0 | |
Conservative | Jean Forshaw | 109 | 13.6 | −23.3 | |
Labour | Liz Webbe | 85 | 10.6 | −13.7 | |
Majority | 112 | 13.9 | |||
Turnout | 804 | ||||
Liberal Democrats gain from Conservative | Swing |
Party | Candidate | Votes | % | ±% | |
---|---|---|---|---|---|
Conservative | Steve Farmer | 638 | 65.6 | −3.4 | |
Labour | Anthony McNamara | 254 | 26.1 | −4.9 | |
Green | Anne Peplow | 81 | 8.3 | +8.3 | |
Majority | 384 | 39.5 | |||
Turnout | 973 | ||||
Conservative hold | Swing |
Party | Candidate | Votes | % | ±% | |
---|---|---|---|---|---|
Conservative | Robin Walsh | 712 | 66.5 | +12.1 | |
Liberal Democrats | John Hymas | 200 | 18.7 | −7.0 | |
Labour | Lee Jameson | 109 | 10.2 | −2.5 | |
Green | Malcolm Peplow | 50 | 4.7 | +4.7 | |
Majority | 512 | 47.8 | |||
Turnout | 1,071 | ||||
Conservative hold | Swing |
Party | Candidate | Votes | % | ±% | |
---|---|---|---|---|---|
Conservative | Kevin Horkin | 416 | 71.4 | +3.1 | |
Labour | Paul Atkinson | 90 | 15.4 | +15.4 | |
Liberal Democrats | Murray O'Rourke | 77 | 13.2 | −18.5 | |
Majority | 326 | 55.9 | |||
Turnout | 583 | ||||
Conservative hold | Swing |
Party | Candidate | Votes | % | ±% | |
---|---|---|---|---|---|
Liberal Democrats | Gaynor Hibbert | 281 | 49.0 | −8.9 | |
Conservative | Jimmy Newhouse | 216 | 37.7 | +14.1 | |
Labour | Mandy Pollard | 59 | 10.3 | −8.2 | |
Green | Anne Peplow | 17 | 3.0 | +3.0 | |
Majority | 65 | 11.3 | |||
Turnout | 573 | ||||
Liberal Democrats hold | Swing |
Party | Candidate | Votes | % | ±% | |
---|---|---|---|---|---|
Liberal Democrats | Kerry Fletcher | 200 | 43.9 | −16.4 | |
Conservative | Katei Blezard | 119 | 26.1 | +10.4 | |
Labour | Michael Graveston | 109 | 23.9 | −0.1 | |
Green | Malcolm Peplow | 28 | 6.1 | +6.1 | |
Majority | 81 | 17.8 | |||
Turnout | 456 | ||||
Liberal Democrats hold | Swing |
Party | Candidate | Votes | % | ±% | |
---|---|---|---|---|---|
Labour | Bill Holden | 597 | 32.8 | ||
Conservative | Kristian Torgersen | 583 | 32.1 | ||
Liberal Democrats | Mark Sutcliffe | 464 | 25.5 | ||
Independent | Andrea Derbyshire | 175 | 9.6 | ||
Majority | 14 | 0.8 | |||
Turnout | 1,819 | ||||
Labour gain from Liberal Democrats | Swing |
Party | Candidate | Votes | % | ±% | |
---|---|---|---|---|---|
Liberal Democrats | Stephen Sutcliffe | 302 | 25.6 | +0.1 | |
Reform UK | Warren Goldsworthy | 298 | 25.3 | +25.3 | |
Conservative | Kristian Torgersen | 244 | 20.7 | −11.4 | |
Labour | Mike Willcox | 230 | 19.5 | −13.3 | |
Green | Grace McMeekin | 105 | 8.9 | +8.9 | |
Majority | 4 | 0.3 | |||
Turnout | 1,179 | ||||
Liberal Democrats gain from Labour | Swing |