Clitheroe | |
---|---|
Former county constituency for the House of Commons | |
County | Lancashire |
1885–1983 | |
Seats | 1 |
Replaced by | Ribble Valley, Burnley, Hyndburn and Pendle [1] |
1559–1885 | |
Seats | 1559–1832: Two 1832–1885: One |
Type of constituency | Borough constituency |
Clitheroe was a parliamentary constituency in Lancashire.
The town of Clitheroe was first enfranchised as a parliamentary borough in 1559, returning two Members of Parliament (MPs) to the House of Commons of England until 1707, then to the House of Commons of Great Britain until 1800, and finally to the House of Commons of the Parliament of the United Kingdom until 1832. The borough's representation was reduced to one MP by the Reform Act 1832.
The parliamentary borough was abolished under the Redistribution of Seats Act 1885, and the name transferred to a new county division with effect from the 1885 general election. The county division returned one MP until it was abolished for the 1983 general election. It was then largely replaced by the new Ribble Valley constituency.
1885–1918: The Boroughs of Clitheroe and Burnley, the Sessional Division of Colne, and parts of the Sessional Divisions of Clitheroe and Burnley.
1918–1950: The Borough of Clitheroe, the Urban Districts of Great Harwood and Padiham, the Rural District of Clitheroe, and part of the Rural District of Burnley.
1950–1983: The Borough of Clitheroe, the Urban Districts of Great Harwood, Longridge, and Padiham, the Rural Districts of Burnley and Clitheroe, and in the Rural District of Preston the parishes of Dutton, Hothersall, and Ribchester.
Two members returned to Parliament
Election | Member [3] | Party | |
---|---|---|---|
1832 | representation reduced to one member | ||
1832 | John Fort | Whig [4] [5] | |
1841 [6] | Mathew Wilson | Whig [7] [8] [9] [4] | |
1842 [6] | Edward Cardwell | Conservative [4] | |
1847 | Mathew Wilson | Whig [7] [8] [9] [4] | |
May 1853 by-election [10] | John Aspinall | Conservative | |
Aug 1853 by-election [10] | Le Gendre Starkie | Peelite [11] [12] [13] | |
1857 | John Turner Hopwood | Conservative [14] [15] [16] [17] [18] [19] [20] | |
1865 | Richard Fort | Liberal | |
1868 by-election | Ralph Assheton | Conservative | |
1880 | Richard Fort | Liberal | |
1885 | Parliamentary borough abolished. Name transferred to new county division |
Election | Member [3] | Party | Notes | |
---|---|---|---|---|
1885 | Sir Ughtred Kay-Shuttleworth | Liberal | ||
1902 by-election | David Shackleton | Labour | ||
1910 | Albert Smith | Labour | ||
1918 | Alfred Davies | Labour | ||
1922 | Sir William Brass | Conservative | ||
1945 | Harry Randall | Labour | ||
1950 | Richard Fort | Conservative | ||
1959 | Sir Francis Pearson | Conservative | ||
1970 | David Walder | Conservative | Died October 1978 | |
1979 by-election | David Waddington | Conservative | ||
1983 | constituency abolished: see Ribble Valley |
Party | Candidate | Votes | % | ±% | |
---|---|---|---|---|---|
Conservative | David Waddington | 25,081 | 57.1 | +9.1 | |
Labour | Lindsay R. Sutton | 13,502 | 30.7 | −0.5 | |
Liberal | Frank Wilson | 5,362 | 12.2 | −8.6 | |
Majority | 11,579 | 26.4 | +9.6 | ||
Turnout | 43,945 | 80.7 | +2.1 | ||
Conservative hold | Swing |
Party | Candidate | Votes | % | ±% | |
---|---|---|---|---|---|
Conservative | David Waddington | 22,185 | 65.0 | +17.0 | |
Labour | Lindsay R. Sutton | 9,685 | 28.4 | −2.8 | |
Liberal | Frank Wilson | 2,242 | 6.6 | −14.2 | |
Majority | 12,500 | 36.6 | +19.8 | ||
Turnout | 34,112 | ||||
Conservative hold | Swing | +9.9 |
Party | Candidate | Votes | % | ±% | |
---|---|---|---|---|---|
Conservative | David Walder | 19,643 | 48.0 | +0.2 | |
Labour | Barry McColgan | 12,775 | 31.2 | +3.2 | |
Liberal | C. William Roberts | 8,503 | 20.8 | −3.4 | |
Majority | 6,868 | 16.8 | −3.0 | ||
Turnout | 40,921 | 78.6 | −5.1 | ||
Conservative hold | Swing | −1.5 |
Party | Candidate | Votes | % | ±% | |
---|---|---|---|---|---|
Conservative | David Walder | 20,613 | 47.8 | −3.8 | |
Labour | Michael Walsh | 12,085 | 28.0 | −7.8 | |
Liberal | C. William Roberts | 10,438 | 24.2 | +11.6 | |
Majority | 8,528 | 19.8 | +4.0 | ||
Turnout | 43,136 | 83.7 | +4.4 | ||
Conservative hold | Swing | +2.0 |
Party | Candidate | Votes | % | ±% | |
---|---|---|---|---|---|
Conservative | David Walder | 20,430 | 51.6 | +5.5 | |
Labour | Kenneth C Bodfish | 14,158 | 35.8 | −4.3 | |
Liberal | Vera Ida Macmillan | 4,965 | 12.6 | −1.2 | |
Majority | 6,272 | 15.8 | +9.8 | ||
Turnout | 39,553 | 79.3 | −4.2 | ||
Conservative hold | Swing | +4.9 |
Party | Candidate | Votes | % | ±% | |
---|---|---|---|---|---|
Conservative | Francis Pearson | 17,244 | 46.1 | −2.7 | |
Labour | Robert Hodge | 15,014 | 40.1 | +2.6 | |
Liberal | Vera Ida Macmillan | 5,168 | 13.8 | +0.1 | |
Majority | 2,230 | 6.0 | −5.3 | ||
Turnout | 37,426 | 83.5 | −1.8 | ||
Conservative hold | Swing | −2.7 |
Party | Candidate | Votes | % | ±% | |
---|---|---|---|---|---|
Conservative | Francis Pearson | 18,559 | 48.8 | −9.3 | |
Labour | Doug Hoyle | 14,278 | 37.5 | −4.4 | |
Liberal | Martin Strange | 5,209 | 13.7 | New | |
Majority | 4,281 | 11.3 | −4.9 | ||
Turnout | 38,046 | 85.3 | −1.3 | ||
Conservative hold | Swing | −2.5 |
Party | Candidate | Votes | % | ±% | |
---|---|---|---|---|---|
Conservative | Francis Pearson | 22,314 | 58.1 | +1.6 | |
Labour | William Rutter | 16,103 | 41.9 | −1.6 | |
Majority | 6,211 | 16.2 | +3.2 | ||
Turnout | 38,417 | 86.6 | +1.3 | ||
Conservative hold | Swing | +1.6 |
Party | Candidate | Votes | % | ±% | |
---|---|---|---|---|---|
Conservative | Richard Fort | 21,615 | 56.5 | +1.2 | |
Labour | William Rutter | 16,671 | 43.5 | −1.2 | |
Majority | 4,944 | 13.0 | +2.4 | ||
Turnout | 38,286 | 85.3 | −4.8 | ||
Conservative hold | Swing | +1.2 |
Party | Candidate | Votes | % | ±% | |
---|---|---|---|---|---|
Conservative | Richard Fort | 23,007 | 55.3 | +5.7 | |
Labour | Harold Bradley | 18,582 | 44.7 | +0.9 | |
Majority | 4,425 | 10.6 | +4.8 | ||
Turnout | 41,589 | 90.1 | −1.6 | ||
Conservative hold | Swing | +2.4 |
Party | Candidate | Votes | % | ±% | |
---|---|---|---|---|---|
Conservative | Richard Fort | 20,814 | 49.6 | +3.6 | |
Labour | Harry Randall | 18,359 | 43.8 | −9.8 | |
Liberal | James Willie Wyers | 2,765 | 6.6 | New | |
Majority | 2,455 | 5.8 | N/A | ||
Turnout | 41,938 | 91.7 | +8.3 | ||
Conservative gain from Labour | Swing |
Party | Candidate | Votes | % | ±% | |
---|---|---|---|---|---|
Labour | Harry Randall | 19,443 | 53.65 | ||
Conservative | Richard Fort | 16,796 | 46.35 | ||
Majority | 2,647 | 7.30 | N/A | ||
Turnout | 36,239 | 83.41 | |||
Labour gain from Conservative | Swing |
Party | Candidate | Votes | % | ±% | |
---|---|---|---|---|---|
Conservative | William Brass | 21,163 | 54.86 | ||
Labour | Stan Awbery | 17,411 | 45.14 | ||
Majority | 3,752 | 9.72 | |||
Turnout | 38,574 | 87.68 | |||
Conservative hold | Swing |
Party | Candidate | Votes | % | ±% | |
---|---|---|---|---|---|
Conservative | William Brass | 24,361 | 62.02 | ||
Labour | Stan Awbery | 14,920 | 37.98 | ||
Majority | 9,441 | 24.04 | |||
Turnout | 39,281 | 83.40 | |||
Conservative hold | Swing |
Party | Candidate | Votes | % | ±% | |
---|---|---|---|---|---|
Unionist | William Brass | 16,035 | 40.7 | −13.5 | |
Labour | William Dobbie | 15,592 | 39.5 | −6.3 | |
Liberal | Charles Norman Glidewell | 7,826 | 19.8 | New | |
Majority | 443 | 1.2 | −7.2 | ||
Turnout | 39,453 | 91.5 | +2.9 | ||
Registered electors | 43,113 | ||||
Unionist hold | Swing | −3.6 |
Party | Candidate | Votes | % | ±% | |
---|---|---|---|---|---|
Unionist | William Brass | 16,637 | 54.2 | +11.3 | |
Labour | Derwent Hall Caine | 14,041 | 45.8 | +7.9 | |
Majority | 2,596 | 8.4 | +3.4 | ||
Turnout | 30,678 | 88.6 | +0.4 | ||
Registered electors | 34,617 | ||||
Unionist hold | Swing | +1.7 |
Party | Candidate | Votes | % | ±% | |
---|---|---|---|---|---|
Unionist | William Brass | 12,998 | 42.9 | −11.8 | |
Labour | Alfred Davies | 11,469 | 37.9 | −7.4 | |
Liberal | Harold Derbyshire | 5,810 | 19.2 | New | |
Majority | 1,529 | 5.0 | −4.4 | ||
Turnout | 30,277 | 88.2 | +2.9 | ||
Registered electors | 34,329 | ||||
Unionist hold | Swing | −2.2 |
Party | Candidate | Votes | % | ±% | |
---|---|---|---|---|---|
Unionist | William Brass | 15,586 | 54.7 | +15.4 | |
Labour | Alfred Davies | 12,911 | 45.3 | +0.7 | |
Majority | 2,675 | 9.4 | N/A | ||
Turnout | 28,497 | 85.3 | +18.8 | ||
Registered electors | 33,393 | ||||
Unionist gain from Labour | Swing | +7.4 |
Party | Candidate | Votes | % | ±% | |
---|---|---|---|---|---|
Labour | Alfred Davies | 9,578 | 44.6 | −23.1 | |
Unionist | Edwin Leach Hartley | 8,419 | 39.3 | +7.0 | |
C | Liberal | James Henley Batty | 3,443 | 16.1 | New |
Majority | 1,159 | 5.3 | −30.1 | ||
Turnout | 21,440 | 66.5 | −13.5 | ||
Registered electors | 32,222 | ||||
Labour hold | Swing | −15.1 | |||
Cindicates candidate endorsed by the coalition government. |
Party | Candidate | Votes | % | ±% | |
---|---|---|---|---|---|
Labour | Albert Smith | 12,107 | 67.7 | +0.4 | |
Conservative | J.J. Blayney | 5,783 | 32.3 | −0.4 | |
Majority | 6,324 | 35.4 | +0.8 | ||
Turnout | 17,890 | 80.0 | −12.1 | ||
Registered electors | 22,368 | ||||
Labour hold | Swing | +0.4 |
Party | Candidate | Votes | % | ±% | |
---|---|---|---|---|---|
Labour | David Shackleton | 13,873 | 67.3 | −8.6 | |
Conservative | T. Smith | 6,727 | 32.7 | New | |
Majority | 7,146 | 34.6 | −17.2 | ||
Turnout | 20,600 | 92.1 | +15.1 | ||
Registered electors | 22,368 | ||||
Labour hold | Swing |
Party | Candidate | Votes | % | ±% | |
---|---|---|---|---|---|
Labour Repr. Cmte. | David Shackleton | 12,035 | 75.9 | N/A | |
Ind. Conservative | B.J. Belton | 3,828 | 24.1 | New | |
Majority | 8,207 | 51.8 | N/A | ||
Turnout | 15,863 | 77.0 | N/A | ||
Registered electors | 20,613 | ||||
Labour Repr. Cmte. gain from Liberal | Swing | N/A |
Party | Candidate | Votes | % | ±% | |
---|---|---|---|---|---|
Labour Repr. Cmte. | David Shackleton | Unopposed | |||
Labour Repr. Cmte. gain from Liberal |
Party | Candidate | Votes | % | ±% | |
---|---|---|---|---|---|
Liberal | Ughtred Kay-Shuttleworth | Unopposed | |||
Liberal hold |
Party | Candidate | Votes | % | ±% | |
---|---|---|---|---|---|
Liberal | Ughtred Kay-Shuttleworth | Unopposed | |||
Liberal hold |
Party | Candidate | Votes | % | ±% | |
---|---|---|---|---|---|
Liberal | Ughtred Kay-Shuttleworth | 7,657 | 58.2 | N/A | |
Liberal Unionist | William Briggs | 5,506 | 41.8 | New | |
Majority | 2,151 | 16.4 | N/A | ||
Turnout | 13,163 | 86.5 | N/A | ||
Registered electors | 15,212 | ||||
Liberal hold | Swing | N/A |
Party | Candidate | Votes | % | ±% | |
---|---|---|---|---|---|
Liberal | Ughtred Kay-Shuttleworth | Unopposed | |||
Liberal hold |
Party | Candidate | Votes | % | ±% | |
---|---|---|---|---|---|
Liberal | Ughtred Kay-Shuttleworth | Unopposed | |||
Liberal hold |
Party | Candidate | Votes | % | ±% | |
---|---|---|---|---|---|
Liberal | Ughtred Kay-Shuttleworth | 6,821 | 60.5 | +5.5 | |
Conservative | John Thursby | 4,462 | 39.5 | −5.5 | |
Majority | 2,359 | 21.0 | +11.0 | ||
Turnout | 11,283 | 88.9 | −5.9 | ||
Registered electors | 12,698 | ||||
Liberal hold | Swing | +5.5 |
Party | Candidate | Votes | % | ±% | |
---|---|---|---|---|---|
Liberal | Richard Fort | 1,078 | 55.0 | +7.7 | |
Conservative | Ralph Assheton | 882 | 45.0 | −7.7 | |
Majority | 196 | 10.0 | N/A | ||
Turnout | 1,960 | 94.8 | −0.2 | ||
Registered electors | 2,068 | ||||
Liberal gain from Conservative | Swing | +7.7 |
Party | Candidate | Votes | % | ±% | |
---|---|---|---|---|---|
Conservative | Ralph Assheton | 896 | 52.7 | +0.4 | |
Liberal | Edward Ebenezer Kay [27] | 804 | 47.3 | −0.4 | |
Majority | 92 | 5.4 | +0.8 | ||
Turnout | 1,700 | 95.0 | +3.9 | ||
Registered electors | 1,790 | ||||
Conservative hold | Swing | +0.4 |
Party | Candidate | Votes | % | ±% | |
---|---|---|---|---|---|
Conservative | Ralph Assheton | 760 | 52.3 | N/A | |
Liberal | Charles Savile Roundell | 693 | 47.7 | N/A | |
Majority | 67 | 4.6 | N/A | ||
Turnout | 1,453 | 91.1 | N/A | ||
Registered electors | 1,595 | ||||
Conservative gain from Liberal |
Party | Candidate | Votes | % | ±% | |
---|---|---|---|---|---|
Conservative | Ralph Assheton | Unopposed | |||
Conservative gain from Liberal |
Party | Candidate | Votes | % | ±% | |
---|---|---|---|---|---|
Liberal | Richard Fort | Unopposed | |||
Registered electors | 438 | ||||
Liberal gain from Conservative |
Party | Candidate | Votes | % | ±% | |
---|---|---|---|---|---|
Conservative | John Turner Hopwood | Unopposed | |||
Registered electors | 469 | ||||
Conservative hold |
Party | Candidate | Votes | % | ±% | |
---|---|---|---|---|---|
Conservative | John Turner Hopwood | Unopposed | |||
Registered electors | 457 | ||||
Conservative gain from Whig |
Party | Candidate | Votes | % | ±% | |
---|---|---|---|---|---|
Peelite | Le Gendre Starkie | 216 | 51.3 | +5.5 | |
Whig | Jonathan Peel [28] [12] | 205 | 48.7 | −5.5 | |
Majority | 11 | 2.6 | N/A | ||
Turnout | 421 | 92.3 | +1.2 | ||
Registered electors | 456 | ||||
Peelite gain from Whig | Swing | +5.5 |
Party | Candidate | Votes | % | ±% | |
---|---|---|---|---|---|
Conservative | John Aspinall | 215 | 50.8 | +5.0 | |
Whig | Richard Fort [31] | 208 | 49.2 | −5.0 | |
Majority | 7 | 1.6 | N/A | ||
Turnout | 423 | 92.8 | +1.7 | ||
Registered electors | 456 | ||||
Conservative gain from Whig | Swing | +5.0 |
Party | Candidate | Votes | % | ±% | |
---|---|---|---|---|---|
Whig | Mathew Wilson | 221 | 54.2 | N/A | |
Conservative | John Aspinall | 187 | 45.8 | New | |
Majority | 34 | 8.4 | N/A | ||
Turnout | 408 | 91.1 | N/A | ||
Registered electors | 448 | ||||
Whig hold | Swing | N/A |
Party | Candidate | Votes | % | ±% | |
---|---|---|---|---|---|
Whig | Mathew Wilson | Unopposed | |||
Registered electors | 504 | ||||
Whig hold |
Wilson's election at the 1841 general election was declared void and Cardwell was declared elected on 21 March 1842.
Party | Candidate | Votes | % | ±% | |
---|---|---|---|---|---|
Whig | Mathew Wilson | 175 | 50.7 | −0.6 | |
Conservative | Edward Cardwell | 170 | 49.3 | +0.6 | |
Majority | 5 | 1.4 | −1.4 | ||
Turnout | 345 | 89.1 | +2.4 | ||
Registered electors | 387 | ||||
Whig hold | Swing |
Party | Candidate | Votes | % | ±% | |
---|---|---|---|---|---|
Whig | John Fort | 164 | 51.4 | N/A | |
Conservative | William Whalley | 155 | 48.6 | New | |
Majority | 9 | 2.8 | N/A | ||
Turnout | 319 | 86.7 | N/A | ||
Registered electors | 368 | ||||
Whig hold | Swing | N/A |
Party | Candidate | Votes | % | ±% | |
---|---|---|---|---|---|
Whig | John Fort | Unopposed | |||
Registered electors | 351 | ||||
Whig hold |
Party | Candidate | Votes | % | ±% | |
---|---|---|---|---|---|
Whig | John Fort | 157 | 55.9 | New | |
Tory | John Irving | 124 | 44.1 | N/A | |
Majority | 33 | 11.8 | N/A | ||
Turnout | 281 | 91.8 | N/A | ||
Registered electors | 306 | ||||
Whig gain from Tory | Swing | N/A |
Party | Candidate | Votes | % | ±% | |
---|---|---|---|---|---|
Tory | Peregrine Cust | Unopposed | |||
Tory | Robert Curzon | Unopposed | |||
Registered electors | c. 36 | ||||
Tory hold | |||||
Tory hold |
Party | Candidate | Votes | % | ±% | |
---|---|---|---|---|---|
Tory | Peregrine Cust | Unopposed | |||
Tory | Robert Curzon | Unopposed | |||
Registered electors | c. 36 | ||||
Tory hold | |||||
Tory hold |
Wigan is a constituency in Greater Manchester, represented in the House of Commons of the Parliament of the United Kingdom. The seat has been respresented Lisa Nandy of the Labour Party since 2010. Nandy currently serves as Secretary of State for Culture, Media and Sport under the government of Keir Starmer.
City of Durham is a constituency represented in the House of Commons of the UK Parliament since 2019 by Mary Kelly Foy of the Labour Party.
Stroud is a constituency represented in the House of Commons of the UK Parliament. It is held by Simon Opher of the Labour Party, who won the seat from Siobhan Baillie of the Conservatives in 2024. Formerly a safe Conservative seat, Stroud has been a marginal seat since 1997, changing hands five times in eight elections.
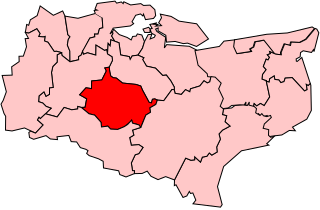
Maidstone was a parliamentary constituency represented in the Parliament of England, Great Britain and from 1801 the House of Commons of the Parliament of the United Kingdom.
Lancaster was a constituency of the House of Commons of the Parliament of England then of the Parliament of Great Britain from 1707 to 1800 and of the Parliament of the United Kingdom from 1801 to 1867, centred on the historic city of Lancaster in north-west England. It was represented by two Members of Parliament until the constituency was disenfranchised for corruption in 1867.
Derby is a former United Kingdom Parliamentary constituency. It was a constituency of the House of Commons of the Parliament of England, then of the Parliament of Great Britain from 1707 to 1800 and of the Parliament of the United Kingdom from 1801 to 1950. It was represented by two members of parliament. It was divided into the single-member constituencies of Derby North and Derby South in 1950.
Bridgnorth was a parliamentary borough in Shropshire which was represented in the House of Commons of England from 1295 until 1707, then in the House of Commons of Great Britain until 1800, and in the House of Commons of the Parliament of the United Kingdom from 1801 until its abolition in 1885.
Beverley has been the name of a parliamentary constituency in the East Riding of Yorkshire for three periods. From medieval times until 1869 it was a parliamentary borough consisting of a limited electorate of property owners of its early designated borders within the market town of Beverley, which returned (elected) two Members of Parliament to the House of Commons of the English and Welsh-turned-UK Parliament during that period.
Liverpool was a borough constituency in the county of Lancashire of the House of Commons for the Parliament of England to 1706 then of the Parliament of Great Britain from 1707 to 1800 and of the Parliament of the United Kingdom from 1801 to 1885. It was represented by two Members of Parliament (MPs). In 1868, this was increased to three Members of Parliament.
Hertford was the name of a parliamentary constituency in Hertfordshire, which elected Members of Parliament (MPs) from 1298 until 1974.
Malton, also called New Malton, was a constituency of the House of Commons of the Parliament of England in 1295 and 1298, and again from 1640, then of the Parliament of Great Britain from 1707 to 1800 and of the Parliament of the United Kingdom from 1801 to 1885. It was represented by two Members of Parliament until 1868, among them the political philosopher Edmund Burke, and by one member from 1868 to 1885.
Rye was a parliamentary constituency centred on the town of Rye in East Sussex. It returned two Members of Parliament to the Parliament of England before 1707, Parliament of Great Britain until 1801 and the House of Commons of the Parliament of the United Kingdom until its representation was halved under the Reform Act 1832.
Barnstaple was a constituency centred on the town of Barnstaple in Devon, in the South West of England. It returned two Members of Parliament to the House of Commons of the Parliament of the United Kingdom until 1885, thereafter, one.
Southampton was a parliamentary constituency which was represented in the English and after 1707 British House of Commons. Centred on the town of Southampton, it returned two members of parliament (MPs) from 1295 until it was abolished for the 1950 general election.
Cricklade was a parliamentary constituency named after the town of Cricklade in Wiltshire.
Knaresborough was a parliamentary constituency which returned two Members of Parliament (MPs) to the Parliament of England, Parliament of Great Britain and the House of Commons of the Parliament of the United Kingdom until 1868, and then one MP until its abolition in 1885.
Kingston upon Hull, often simply referred to as Hull, was a parliamentary constituency in Yorkshire, electing two members of parliament to the Parliaments of England, Great Britain and House of Commons of the Parliament of the United Kingdom, from 1305 until 1885. Its MPs included the anti-slavery campaigner, William Wilberforce, and the poet Andrew Marvell.
Boston was a parliamentary borough in Lincolnshire, which elected two Members of Parliament (MPs) to the House of Commons from 1547 until 1885, and then one member from 1885 until 1918, when the constituency was abolished.
Leicester was a parliamentary borough in Leicestershire, which elected two members of parliament (MPs) to the House of Commons from 1295 until 1918, when it was split into three single-member divisions.
Great Marlow, sometimes simply called Marlow, was a parliamentary borough in Buckinghamshire. It elected two Members of Parliament (MPs) to the House of Commons of England between 1301 and 1307, and again from 1624 until 1707, then in the House of Commons of Great Britain from 1707 to 1800 and finally in the House of Commons of the United Kingdom from 1801 to 1868. It elected one member from 1868 until 1885, when the borough was abolished.