| |||||||||||||||||||||||||||||||||||||||||||||||||||||||||||||
All 60 seats to Lancaster City Council 31 seats needed for a majority | |||||||||||||||||||||||||||||||||||||||||||||||||||||||||||||
---|---|---|---|---|---|---|---|---|---|---|---|---|---|---|---|---|---|---|---|---|---|---|---|---|---|---|---|---|---|---|---|---|---|---|---|---|---|---|---|---|---|---|---|---|---|---|---|---|---|---|---|---|---|---|---|---|---|---|---|---|---|
| |||||||||||||||||||||||||||||||||||||||||||||||||||||||||||||
Map showing the results of the 2019 Lancaster City Council election | |||||||||||||||||||||||||||||||||||||||||||||||||||||||||||||
|
Elections to Lancaster City Council were held on 2 May 2019 at the same time as other 2019 United Kingdom local elections. Local elections are held every four years with all councillors up for election in multi-member electoral wards.
Prior to the election the composition of the council was: [1]
31 | 15 | 7 | 2 | 5 |
Lab | Con | G | MBI | I |
The 2015 election returned no overall control, but a series of defections and by-election wins have maintained a majority for the Labour Party afterwards. [2] [3] The composition of the Council immediately after the last election was:
29 | 19 | 9 | 2 | 1 |
Lab | Con | G | MBI | I |
Following the 2019 election, the council was returned with No Overall Control.
21 | 14 | 12 | 10 | 3 |
Lab | MBI | Con | G | LD |
Lancaster City Council election result, 2019 [5] | |||||||||||||||
---|---|---|---|---|---|---|---|---|---|---|---|---|---|---|---|
Party | Candidates | Votes | |||||||||||||
Stood | Elected | Gained | Unseated | Net | % of total | % | No. | Net % | |||||||
Labour | 60 | 21 | 3 | 11 | 8 | 35.0 | 33.7 | 27,581 | –3.0 | ||||||
MB Independent | 20 | 14 | 12 | 0 | 12 | 23.3 | 12.9 | 10,580 | +6.3 | ||||||
Conservative | 60 | 12 | 0 | 7 | 7 | 20.0 | 24.4 | 19,937 | –4.3 | ||||||
Green | 35 | 10 | 2 | 1 | 1 | 16.7 | 21.8 | 17,865 | +4.0 | ||||||
Liberal Democrats | 22 | 3 | 3 | 0 | 3 | 5.0 | 6.0 | 4,914 | +3.0 | ||||||
Independent | 2 | 0 | 0 | 1 | 1 | 0.0 | 1.0 | 783 | –2.1 | ||||||
UKIP | 1 | 0 | 0 | 0 | 0.0 | 0.2 | 190 | –3.9 |
Party | Candidate | Votes | % | ±% | |
---|---|---|---|---|---|
MB Independent | Tony Anderson | 827 | 38.2 | ||
MB Independent | Sarah Knight | 800 | 37.0 | ||
Conservative | Stephie Barber | 721 | 33.3 | ||
Conservative | Charles Edwards | 708 | 32.7 | ||
Conservative | Stuart Morris | 598 | 27.6 | ||
MB Independent | Paula Ross-Clasper | 597 | 27.6 | ||
Labour | Callum Henry | 406 | 18.8 | ||
Labour | Becca Snow | 396 | 18.3 | ||
Liberal Democrats | Owen Lambert | 282 | 13.0 | ||
Green | Jonathan Buckley | 178 | 8.2 | ||
Liberal Democrats | John Livermore | 167 | 7.7 | ||
Green | Sean Hughes | 141 | 6.5 | ||
Liberal Democrats | Jim Pilling | 131 | 6.1 | ||
Independent | Chris Price | 97 | 4.5 | New | |
Turnout | 2,171 | 39.0 | |||
MB Independent hold | |||||
MB Independent gain from Conservative | |||||
Conservative hold |
Party | Candidate | Votes | % | ±% | |
---|---|---|---|---|---|
Conservative | Keith Budden | 1,357 | 61.3 | ||
Conservative | James Thomas | 1,234 | 55.8 | ||
Conservative | John Wild | 1,125 | 50.8 | ||
Labour | Louise Belcher | 703 | 31.8 | ||
Labour | Richard Martin | 609 | 27.5 | ||
Labour | Valerie Rogerson | 471 | 21.3 | ||
Liberal Democrats | Derek Kaye | 405 | 18.3 | ||
Turnout | 2,243 | 37.0 | |||
Conservative hold | |||||
Conservative hold |
Party | Candidate | Votes | % | ±% | |
---|---|---|---|---|---|
Green | Tim Hamilton-Cox | 1,199 | 57.0 | ||
Green | Caroline Jackson | 1,196 | 56.9 | ||
Green | Lucie Carrington | 1,055 | 50.2 | ||
Labour | Andrew Kay | 807 | 38.4 | ||
Labour | Sue Clark | 806 | 38.3 | ||
Labour | Naley Alobari | 734 | 34.9 | ||
Conservative | Jack Downes | 119 | 5.7 | ||
Conservative | Tamsin Richardson | 106 | 5.0 | ||
Conservative | Kai Drury | 99 | 4.7 | ||
Turnout | 2,120 | 33.0 | |||
Green hold | |||||
Green hold | |||||
Green hold |
Party | Candidate | Votes | % | ±% | |
---|---|---|---|---|---|
Labour | John Reynolds | 680 | 43.8 | ||
Conservative | Peter Yates | 588 | 37.9 | ||
Conservative | Mel Guilding | 499 | 32.1 | ||
Conservative | Tobias Holbrook | 440 | 28.3 | ||
Labour | Sandi Haythornthwaite | 395 | 25.4 | ||
Labour | Luke Taylor | 356 | 22.9 | ||
Independent | Gregg Beaman | 354 | 22.8 | ||
Independent | Bob Roe | 332 | 21.4 | ||
Green | Kathy Bashford | 199 | 12.8 | ||
Green | Jan Maskell | 142 | 9.1 | ||
Green | Johnny Unger | 108 | 7.0 | ||
Turnout | 1,571 | 34.0 | |||
Labour gain from Conservative | |||||
Conservative hold | |||||
Conservative hold |
Party | Candidate | Votes | % | ±% | |
---|---|---|---|---|---|
Green | Dave Brookes | 1,003 | 66.7 | ||
Green | Paul Stubbins | 851 | 56.6 | ||
Labour | Stefanie Sinclair | 445 | 29.6 | ||
Labour | Peter Curphey | 396 | 26.3 | ||
Conservative | Tommy Shaw | 102 | 6.8 | ||
Conservative | Peter Williamson | 99 | 6.6 | ||
Turnout | 1,519 | 31.0 | |||
Green hold | |||||
Green hold |
Party | Candidate | Votes | % | ±% | |
---|---|---|---|---|---|
Conservative | David Whitworth | 576 | 41.2 | ||
Conservative | Richard Austen-Baker | 550 | 39.4 | ||
Labour | Lisa Corkerry | 435 | 31.1 | ||
Labour | Shaun Corkerry | 429 | 30.7 | ||
Green | Mollie Foxall | 279 | 20.0 | ||
Green | Gisela Renolds | 245 | 17.5 | ||
Liberal Democrats | Paul Hindley | 90 | 6.4 | New | |
Liberal Democrats | Jade Sullivan | 78 | 5.6 | New | |
Turnout | 1,411 | 40.0 | |||
Conservative hold | |||||
Conservative hold |
Party | Candidate | Votes | % | ±% | |
---|---|---|---|---|---|
Labour Co-op | Kevin Frea | 484 | 51.4 | +42.0 | |
Conservative | Daniel Gibbins | 381 | 40.5 | +12.4 | |
Liberal Democrats | Catherine Pilling | 76 | 8.1 | New | |
Turnout | 952 | 47.0 | |||
Labour Co-op gain from Independent | Swing | ||||
Party | Candidate | Votes | % | ±% | |
---|---|---|---|---|---|
Labour | Janice Hanson | 607 | 46.2 | ||
Labour | David Whitaker | 544 | 41.4 | ||
Labour | Darren Clifford | 478 | 36.4 | ||
MB Independent | Jack Newton | 433 | 33.0 | ||
MB Independent | Marius Balcer | 408 | 31.1 | ||
MB Independent | Mirka Balcer | 403 | 30.7 | ||
Conservative | Alexandra Hailey | 169 | 12.9 | ||
Conservative | Craig Mercer | 168 | 12.8 | ||
Green | Simona Chadwick | 166 | 12.6 | ||
Conservative | Rhiannon Williamson | 163 | 12.4 | ||
Green | Jay-Yahia Mozee | 88 | 6.7 | ||
Turnout | 1,340 | 25.0 | |||
Labour hold | |||||
Labour hold | |||||
Labour hold |
Party | Candidate | Votes | % | ±% | |
---|---|---|---|---|---|
MB Independent | Cary Matthews | 542 | 49.4 | ||
MB Independent | Geoff Knight | 524 | 47.8 | ||
Labour | Sarah Hayland | 360 | 32.8 | ||
Labour | Ian Walton | 316 | 28.8 | ||
Conservative | Kenneth Brown | 185 | 16.9 | ||
Conservative | Samuel Donnelly | 176 | 16.0 | ||
Turnout | 1,105 | 32.0 | |||
MB Independent gain from Labour | |||||
MB Independent hold |
Party | Candidate | Votes | % | ±% | |
---|---|---|---|---|---|
MB Independent | Roger Cleet | 429 | 48.3 | ||
MB Independent | Vicky Boyd-Power | 405 | 45.6 | ||
Labour | Margaret Pattison | 391 | 44.0 | ||
Labour | John Hanson | 318 | 35.8 | ||
Conservative | Joseph Wilson | 96 | 10.8 | ||
Conservative | John Marsden | 95 | 10.7 | ||
Turnout | 901 | 27.0 | |||
MB Independent gain from Labour | |||||
MB Independent gain from Labour |
Party | Candidate | Votes | % | ±% | |
---|---|---|---|---|---|
Labour | Colin Hartley | 548 | 37.4 | ||
MB Independent | Mike Greenall | 540 | 36.8 | ||
Labour | Alan Biddulph | 518 | 35.3 | ||
Labour | Mandy Wildman | 509 | 34.7 | ||
MB Independent | Steve Matthews | 487 | 33.2 | ||
Conservative | Stuart Bateson | 449 | 30.6 | ||
MB Independent | Wendy Blundell | 403 | 27.5 | ||
Conservative | Eric Hamer | 349 | 23.8 | ||
Conservative | Judith Hamer | 348 | 23.7 | ||
Turnout | 1,476 | 28.0 | |||
Labour hold | |||||
MB Independent gain from Conservative | |||||
Labour hold |
Party | Candidate | Votes | % | ±% | |
---|---|---|---|---|---|
Labour | Erica Lewis | 840 | 44.7 | ||
Labour | Faye Penny | 827 | 44.0 | ||
Labour | Alistair Sinclair | 772 | 41.0 | ||
Green | Marianne Waine | 701 | 37.3 | ||
Green | Rebecca Whittle | 684 | 36.4 | ||
Green | Ceri Turner | 648 | 34.4 | ||
Conservative | Janet Walton | 227 | 12.1 | ||
Conservative | Ryan Whittaker | 224 | 11.9 | ||
Conservative | Kevan Walton | 209 | 11.1 | ||
Liberal Democrats | James Harvey | 186 | 9.9 | ||
Liberal Democrats | Phil Dunster | 149 | 7.9 | ||
Turnout | 1,902 | 32.0 | |||
Labour hold | |||||
Labour hold | |||||
Labour hold |
Party | Candidate | Votes | % | ±% | |
---|---|---|---|---|---|
Liberal Democrats | Michael Mumford | 337 | 45.3 | New | |
Conservative | Andrew Gardiner | 331 | 44.5 | -28.9 | |
Labour | Diana Martin | 76 | 10.2 | -6.0 | |
Turnout | 755 | 43.0 | |||
Liberal Democrats gain from Conservative | Swing | ||||
Party | Candidate | Votes | % | ±% | |
---|---|---|---|---|---|
Liberal Democrats | Joyce Pritchard | 658 | 45.2 | ||
Conservative | Joan Jackson | 628 | 43.1 | ||
Liberal Democrats | Peter Jackson | 597 | 41.0 | ||
Conservative | Jane Parkinson | 564 | 38.7 | ||
Labour Co-op | Lucy Atkinson | 193 | 13.2 | ||
Labour Co-op | Nathan Burns | 177 | 12.1 | ||
Turnout | 1,484 | 41.0 | |||
Liberal Democrats gain from Conservative | |||||
Conservative hold |
Party | Candidate | Votes | % | ±% | |
---|---|---|---|---|---|
Green | Gina Dowding | 1,174 | 72.5 | ||
Green | Mandy Bannon | 1,109 | 68.7 | ||
Labour | Pete Cakebread | 381 | 23.6 | ||
Labour | Nicky Snell | 348 | 21.5 | ||
Conservative | Daniel Sims | 90 | 5.6 | ||
Conservative | Ayesha Hilton | 88 | 5.4 | ||
Turnout | 1,636 | 40.0 | |||
Green hold | |||||
Green hold |
Party | Candidate | Votes | % | ±% | |
---|---|---|---|---|---|
Conservative | Michael Smith | 291 | 45.7 | +2.9 | |
Labour | Tom Porter | 265 | 41.6 | +18.4 | |
Green | Pamela White | 81 | 12.7 | +7.6 | |
Turnout | 652 | 36.0 | |||
Conservative hold | Swing | ||||
Party | Candidate | Votes | % | ±% | |
---|---|---|---|---|---|
MB Independent | Tricia Heath | 363 | 38.4 | ||
MB Independent | Debbie Jenkins | 269 | 28.4 | ||
Labour | Brandan Hughes | 259 | 27.4 | ||
Labour | Terrie Metcalfe | 245 | 25.9 | ||
Liberal Democrats | Paul Hart | 224 | 23.7 | New | |
Conservative | Shirley Gardiner | 116 | 12.3 | ||
Green | Philip Chandler | 84 | 8.9 | ||
Conservative | Joan Yates | 74 | 7.8 | ||
Green | Chloe Buckley | 66 | 7.0 | ||
Liberal Democrats | Andrew Hastings | 53 | 5.6 | ||
Turnout | 946 | 26.0 | |||
MB Independent gain from Labour | |||||
MB Independent gain from Labour |
Party | Candidate | Votes | % | ±% | |
---|---|---|---|---|---|
Labour | Patricia Whitehead | 655 | 48.1 | ||
Labour | Jason Wood | 578 | 42.4 | ||
Conservative | Cameron Fernie | 359 | 26.3 | ||
Conservative | Rebecca Samuels | 339 | 24.9 | ||
Green | Rosie Mills | 264 | 19.4 | ||
Green | Andrew Lee | 243 | 17.8 | ||
Liberal Democrats | Robin Long | 125 | 9.2 | ||
Liberal Democrats | Graham Pollitt | 97 | 7.1 | ||
Turnout | 1,379 | 40.0 | |||
Labour hold | |||||
Labour hold |
Party | Candidate | Votes | % | ±% | |
---|---|---|---|---|---|
Green | Abi Mills | 1,488 | 61.8 | ||
Green | Joanna Young | 1,319 | 54.8 | ||
Green | Tim Dant | 1,303 | 54.1 | ||
Labour | Ronnie Kershaw | 774 | 32.1 | ||
Labour | Mohammad Malik | 656 | 27.2 | ||
Labour | Linda Prue | 625 | 25.9 | ||
Conservative | Joe Wrennall | 280 | 11.6 | ||
Conservative | Josh Smith | 274 | 11.4 | ||
Conservative | Oliver Kerry | 270 | 11.2 | ||
Turnout | 2,430 | 44.0 | |||
Green hold | |||||
Green gain from Labour | |||||
Green gain from Labour |
Party | Candidate | Votes | % | ±% | |
---|---|---|---|---|---|
Liberal Democrats | June Greenwell | 501 | 56.9 | +32.4 | |
Conservative | Iain Harbison | 296 | 33.6 | +3.7 | |
Labour | Brenda Rockall | 84 | 9.5 | +1.3 | |
Turnout | 898 | 55.0 | |||
Liberal Democrats gain from Conservative | Swing | ||||
Party | Candidate | Votes | % | ±% | |
---|---|---|---|---|---|
Labour | Anna Thornberry | 627 | 52.3 | ||
Labour | Robert Redfern | 619 | 51.6 | ||
Labour | Abbott Bryning | 607 | 50.6 | ||
Green | Erik Worsley | 321 | 26.8 | ||
Green | Ceiteag Sinclair | 273 | 22.8 | ||
UKIP | Simon Platt | 190 | 15.8 | New | |
Conservative | John Doherty | 188 | 15.7 | -15.4 | |
Conservative | Margaret Colling | 179 | 14.9 | ||
Conservative | Kathleen Mashiter | 163 | 13.6 | ||
Turnout | 1,207 | 25.0 | |||
Labour hold | |||||
Labour hold | |||||
Labour hold |
Party | Candidate | Votes | % | ±% | |
---|---|---|---|---|---|
Labour | Phillip Black | 599 | 50.7 | ||
Labour | Mandy King | 590 | 49.9 | ||
Labour | Hilda Parr | 581 | 49.2 | ||
Conservative | Colin Hewitt | 320 | 27.1 | ||
Conservative | Matthew Reader | 274 | 23.2 | ||
Green | Melanie Forrest | 269 | 22.8 | ||
Conservative | Thomas Inman | 252 | 21.3 | ||
Green | Daniel Burba | 240 | 20.3 | ||
Turnout | 1,214 | 23.0 | |||
Labour hold | |||||
Labour hold | |||||
Labour hold |
Party | Candidate | Votes | % | ±% | |
---|---|---|---|---|---|
MB Independent | Paul Anderton | 705 | 52.7 | ||
MB Independent | Roger Dennison | 634 | 47.4 | ||
Conservative | Mark Phelps | 325 | 24.3 | ||
Conservative | Jane Cottam | 298 | 22.2 | ||
Labour | Joanne Ainscough | 283 | 21.2 | ||
Labour | Emma Corless | 270 | 20.2 | ||
Turnout | 1,363 | 38.0 | |||
MB Independent gain from Conservative | |||||
MB Independent gain from Labour |
Party | Candidate | Votes | % | ±% | |
---|---|---|---|---|---|
Labour | Katie Whearty | 295 | 44.6 | ||
Labour | Jack O'Dwyer-Henry | 278 | 42.1 | ||
Labour | Oliver Robinson | 267 | 40.4 | ||
Green | Emily Heath | 217 | 32.8 | ||
Green | Victoria Hatch | 175 | 26.5 | ||
Green | Martin Paley | 142 | 21.5 | ||
Conservative | Guy Watts | 119 | 18.0 | ||
Conservative | Robert Ogden | 113 | 17.1 | ||
Conservative | Luke Brandon | 112 | 16.9 | ||
Liberal Democrats | Tom Sutton | 88 | 13.3 | ||
Liberal Democrats | Dafydd Roberts | 83 | 12.6 | ||
Liberal Democrats | Jake Perkins | 72 | 10.9 | ||
Turnout | 670 | 18.0 | |||
Labour hold | |||||
Labour gain from Green | |||||
Labour hold |
Party | Candidate | Votes | % | ±% | |
---|---|---|---|---|---|
Conservative | Stewart Scothern | 419 | 45.9 | -27.1 | |
Liberal Democrats | Ross Hunter | 402 | 44.0 | New | |
Labour | Joseph Rigby | 92 | 10.1 | -4.5 | |
Turnout | 937 | 48.0 | |||
Conservative hold | Swing | ||||
Party | Candidate | Votes | % | ±% | |
---|---|---|---|---|---|
Conservative | Adrian Duggan | 307 | 47.2 | +3.9 | |
Green | Rex Ambler | 214 | 32.9 | +18.3 | |
Labour | Colette Bain | 129 | 19.8 | -2.0 | |
Turnout | 658 | 40.0 | |||
Conservative hold | Swing | ||||
Party | Candidate | Votes | % | ±% | |
---|---|---|---|---|---|
MB Independent | Merv Evans | 632 | 42.4 | ||
MB Independent | Jason Firth | 607 | 40.7 | ||
MB Independent | Jake Goodwin | 572 | 38.4 | ||
Labour | Ian Clift | 523 | 35.1 | ||
Labour | Debbie Hutton | 481 | 32.3 | ||
Labour | Claire Cozler | 440 | 29.5 | ||
Conservative | Clare Ainscow | 278 | 18.7 | ||
Conservative | John Gibbins | 224 | 15.0 | ||
Conservative | Daniel Jones | 206 | 13.8 | ||
Liberal Democrats | Richard Blaikie | 113 | 7.6 | New | |
Turnout | 1,514 | 27.0 | |||
MB Independent gain from Labour | |||||
MB Independent gain from Labour |
Party | Candidate | Votes | % | ±% | |
---|---|---|---|---|---|
Conservative | Andrew Gardiner | 650 | 52.3 | +6.6 | |
Labour | Tom Porter | 527 | 42.4 | +0.8 | |
Liberal Democrats | Amy Stanning | 65 | 5.2 | N/A | |
Majority | 123 | 9.9 | |||
Turnout | 1242 | ||||
Conservative hold | |||||
Party | Candidate | Votes | % | ±% | |
---|---|---|---|---|---|
Green | Jack Lenox | 1,283 | 54.3 | +4.1 | |
Labour | Anna Lee | 824 | 34.9 | -3.5 | |
Conservative | Matthew Maxwell-Scott | 209 | 8.9 | +3.2 | |
Liberal Democrats | Katia Adimora | 45 | 1.9 | N/A | |
Majority | 23 | 4.9 | |||
Turnout | 459 | 19.4 | |||
Green hold | Swing | ||||
Party | Candidate | Votes | % | ±% | |
---|---|---|---|---|---|
Conservative | Stuart Morris | 447 | 50.9 | +6.4 | |
Liberal Democrats | Ross Hunter | 271 | 30.8 | -14.5 | |
Independent | Kathryn Atkins | 161 | 18.3 | N/A | |
Majority | 176 | 20.1 | |||
Turnout | |||||
Conservative gain from Liberal Democrats | Swing | ||||
Party | Candidate | Votes | % | ±% | |
---|---|---|---|---|---|
Labour | Sayeda Askari | 216 | 46.1 | +4.0 | |
Green | Jamie Payne | 193 | 41.2 | +8.4 | |
Conservative | Matthew Maxwell-Scott | 44 | 9.4 | -8.6 | |
Liberal Democrats | Zanna Ashton | 16 | 3.4 | -9.9 | |
Majority | 23 | 4.9 | |||
Turnout | 469 | ||||
Labour hold | Swing | ||||
Party | Candidate | Votes | % | ±% | |
---|---|---|---|---|---|
Labour | Luke Taylor | 538 | 57.7 | +13.9 | |
Conservative | Stuart Bateson | 315 | 33.8 | +5.5 | |
Green | Padruig McMurray | 54 | 5.8 | -7.0 | |
Liberal Democrats | Anthony Saville | 25 | 2.7 | N/A | |
Majority | 223 | 23.9 | |||
Turnout | 937 | 20.1 | |||
Labour hold | Swing | 9.5 | |||
Party | Candidate | Votes | % | ±% | |
---|---|---|---|---|---|
Liberal Democrats | Gerry Blaikie | 428 | 33.1 | +20.1 | |
Green | James Sommerville | 301 | 23.3 | +15.1 | |
MB Independent | June Ashworth | 243 | 18.8 | -8.8 | |
Conservative | Jane Cottam | 215 | 16.6 | -16.7 | |
Labour | Valerie Rogerson | 107 | 8.3 | -10.5 | |
Majority | 127 | 9.8 | |||
Turnout | 1,299 | 23.49 | |||
Liberal Democrats gain from Conservative | Swing | 2.5 | |||
Party | Candidate | Votes | % | ±% | |
---|---|---|---|---|---|
Liberal Democrats | Ross Hunter | 390 | 63.1 | +19.1 | |
Conservative | Iain Harbison | 183 | 29.6 | -16.3 | |
Green | Nicky Sharkey | 24 | 3.9 | N/A | |
Labour | Faith Kenrick | 21 | 3.4 | -6.7 | |
Majority | 207 | 33.5 | |||
Turnout | 620 | 31.70 | |||
Liberal Democrats gain from Conservative | Swing | 17.7 | |||
Party | Candidate | Votes | % | ±% | |
---|---|---|---|---|---|
Green | Sally Maddocks | 547 | 39.7 | +19.5 | |
Labour | Lisa Corkerry | 418 | 30.4 | -1.2 | |
Conservative | Janet Walton | 377 | 27.4 | -14.4 | |
Liberal Democrats | Robert Fildes | 35 | 2.5 | -4.0 | |
Majority | 129 | 9.3 | |||
Turnout | 1,381 | 37.8 | |||
Green gain from Conservative | Swing | 10.4 | |||
Party | Candidate | Votes | % | ±% | |
---|---|---|---|---|---|
Labour | Margaret Pattison | 555 | 47.9 | +1.7 | |
Liberal Democrats | Jake Perkins | 479 | 41.4 | N/A | |
Conservative | Colin Hewitt | 124 | 10.7 | -2.2 | |
Turnout | 1,158 | ||||
Labour hold |
Party | Candidate | Votes | % | ±% | |
---|---|---|---|---|---|
Green | Sue Tyldesley | 452 | 65.7 | +32.8 | |
Conservative | Iain Harbison | 169 | 24.6 | -22.7 | |
Labour | Faith Kenrick | 44 | 6.4 | -13.5 | |
Liberal Democrats | Jane Parsons | 23 | 3.3 | N/A | |
Majority | 283 | 41.1 | |||
Turnout | 688 | 40.5 | |||
Green gain from Conservative | Swing | ||||
Lancaster City Council elections are held every four years. Lancaster City Council is the local authority for the non-metropolitan district of Lancaster in Lancashire, England. Since the last boundary changes in 2015, 60 councillors have been elected from 27 wards.
(Kingston upon) Hull City Council is the governing body for the unitary authority and city of Kingston upon Hull. It was created in 1972 as the successor to the Corporation of Hull, which was also known as Hull Corporation and founded in 1440 by royal charter.
The 1998 Bolton Metropolitan Borough Council election took place on 7 May 1998 to elect members of Bolton Metropolitan Borough Council in Greater Manchester, England. One third of the council was up for election and the Labour Party kept overall control of the council.
Plymouth City Council is the local authority for the a unitary authority of Plymouth in Devon, England. Until 1 April 1998 it was a non-metropolitan district.
The 2008 Worcester City Council election took place on 1 May 2008 to elect members of Worcester City Council in Worcestershire, England. One third of the council was up for election and the council stayed under no overall control.
The Leeds City Council election took place on 2 May 2002 to elect members of City of Leeds Metropolitan Borough Council in West Yorkshire, England. Prior to the election, there had been several by-elections held with no change to the council composition. One third of the council was up for election and the Labour party stayed in overall control of the council.
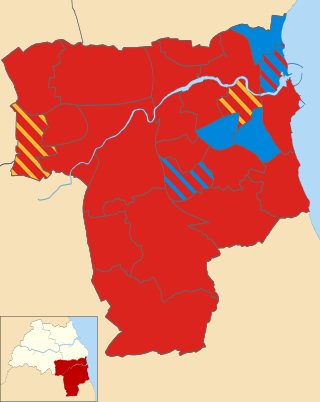
The 2004 Sunderland City Council election took place on 10 June 2004 to elect members of Sunderland City Council Council in Tyne and Wear, England. The whole council was up for election following boundary changes since the last election in 2003. The Labour Party stayed in overall control of the council.
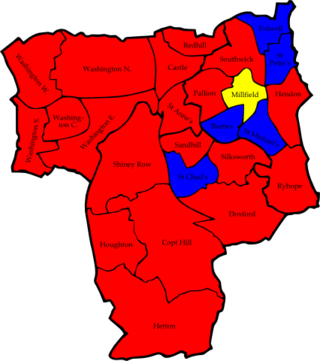
The 2006 Sunderland Council election took place on 4 May 2006 to elect members of Sunderland City Council in Tyne and Wear, England. One third of the Council was up for election and the Labour Party stayed in overall control.
The 2014 Carlisle City Council election took place on 22 May 2014 to elect members of Carlisle District Council in Cumbria, England. One third of the council was up for election and the Labour Party stayed in overall control of the council.
The 2018 Plymouth City Council election took place on 3 May 2018 to elect members of Plymouth City Council in England. The election was won by the Labour Party, who gained enough seats to achieve an overall majority and took control of the council.
The 2018 Calderdale Metropolitan Borough Council election took place on 3 May 2018 to elect members of Calderdale Metropolitan Borough Council in England. This was on the same day as other local elections. One councillor was elected in each ward for a four-year term so the councillors elected in 2018 last stood for election in 2014. Each ward is represented by three councillors, the election of which is staggered, so only one third of the councillors were elected in this election. Before the election there was no overall control with a minority Labour administration. Following the election Labour, having gained one councillor, was still two councillors away from a majority so it remained no overall control.
The 2019 Burnley Borough Council election took place on 2 May 2019 to elect members of Burnley Borough Council in England. This election was held on the same day as other local elections. One third of the council was up for election, and each successful candidate will serve a four-year term of office, expiring in 2023. These seats were last contested in 2015.
The 2022 Barnet London Borough Council election took place on 5 May 2022, alongside local elections in the other London boroughs and elections to local authorities across the United Kingdom. All 63 members of Barnet London Borough Council were elected. The Labour Party took overall control, winning 41 of the seats to the Conservative Party's 22. This was the first time Labour had won the council outright; previously, the Conservatives had always won the most seats, usually with an overall majority.
The 2022 Brent London Borough Council election took place on 5 May 2022. All 57 members of Brent London Borough Council were to be elected. The elections took place alongside local elections in the other London boroughs and elections to local authorities across the United Kingdom.
The 2022 Islington London Borough Council election took place on 5 May 2022. All 51 members of Islington London Borough Council were be elected. The elections took place alongside local elections in the other London boroughs and elections to local authorities across the United Kingdom.
The 2022 Lambeth London Borough Council election took place on 5 May 2022. All 63 members of Lambeth London Borough Council were elected. The elections took place alongside local elections in the other London boroughs and elections to local authorities across the United Kingdom.
The 2022 Waltham Forest London Borough Council election was on 5 May 2022. All 60 members of Waltham Forest London Borough Council were elected. The elections took place alongside local elections in the other London boroughs and elections to local authorities across the United Kingdom. the Labour Party maintained its control of the council, winning 47 out of the 60 seats with the Conservative Party forming the council opposition with the remaining 13 seats.
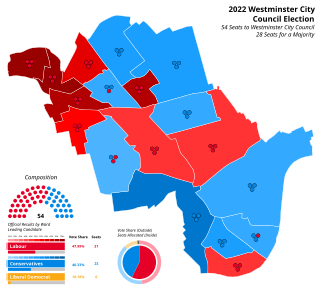
The 2022 Westminster City Councilelection took place on 5 May 2022. All 54 members of Westminster City Council have been elected. The elections took place alongside local elections in the other London boroughs and elections to local authorities across the United Kingdom.
The 2023 Plymouth City Council election was held on 4 May 2023 to elect members of Plymouth City Council in England. It coincided with local elections across the United Kingdom.