The 2019 West Oxfordshire District Council election took place on 2 May 2019 to elect members of West Oxfordshire District Council in Oxfordshire, England. One third of the council was up for election and the Conservative Party stayed in overall control of the council.
After the election, the composition of the council was:
Party | Seats | Gains | Losses | Net gain/loss | Seats % | Votes % | Votes | +/− | |
---|---|---|---|---|---|---|---|---|---|
Conservative | 8 | 0 | 7 | -7 | 50.0 | 39.1 | 7,991 | -14.5% | |
Labour | 4 | 4 | 0 | +4 | 25.0 | 23.0 | 4,697 | +5.5% | |
Liberal Democrats | 3 | 2 | 0 | +2 | 18.75 | 24.3 | 4,975 | +13.9% | |
Green | 0 | 0 | 0 | 0 | 0 | 9.0 | 1,841 | -0.5% | |
Independent | 1 | 1 | 0 | +1 | 6.25 | 4.0 | 813 | +4.0% | |
UKIP | 0 | 0 | 0 | 0 | 0 | 0.6 | 131 | -8.4% | |
Party | Candidate | Votes | % | ±% | |
---|---|---|---|---|---|
Conservative | Suzi Coul | 248 | 49.0 | -17.4 | |
Liberal Democrats | Elizabeth Anne Mortimer | 106 | 20.9 | +14.4 | |
Labour | Moira Christine Swann | 96 | 19.0 | +9.6 | |
Green | Alma Ann Tumilowicz | 56 | 11.1 | +2.9 | |
Majority | 142 | 28.1 | -28.8 | ||
Turnout | 506 | 36.5 | -37.8 | ||
Conservative hold | Swing | ||||
Party | Candidate | Votes | % | ±% | |
---|---|---|---|---|---|
Conservative | Ted Fenton | 659 | 62.7 | +3.3 | |
Liberal Democrats | Andrew Robert Goodwin | 278 | 26.5 | +18.1 | |
Labour | Sian Priscilla Florence O'Neill | 114 | 10.8 | +1.1 | |
Majority | 381 | 36.3 | -10.3 | ||
Turnout | 1051 | 34.6 | -40.7 | ||
Conservative hold | Swing | ||||
Party | Candidate | Votes | % | ±% | |
---|---|---|---|---|---|
Conservative | Norman Alexander MacRae | 470 | 59.8 | +0.1 | |
Green | Rosie Pearson | 126 | 16.0 | +10.9 | |
Labour | Calvert Charles Stuart McGibbon | 104 | 13.2 | -0.9 | |
Liberal Democrats | Ivan Aguado Melet | 86 | 10.9 | +4.9 | |
Majority | 344 | 43.8 | -2.8 | ||
Turnout | 786 | 20.5 | -43.8 | ||
Conservative hold | Swing | ||||
Party | Candidate | Votes | % | ±% | |
---|---|---|---|---|---|
Conservative | Jill Pamela Bull | 375 | 39.9 | -21.6 | |
Independent | Pete Handley | 350 | 37.2 | +37.2 | |
Labour | Dave Wesson | 108 | 11.5 | +0.0 | |
Liberal Democrats | Andy Crick | 107 | 11.4 | +5.4 | |
Majority | 25 | 2.7 | -43.4 | ||
Turnout | 940 | 24.9 | -42.5 | ||
Conservative hold | Swing | ||||
Party | Candidate | Votes | % | ±% | |
---|---|---|---|---|---|
Conservative | Michele Louise Mead | 485 | 57.8 | -2.2 | |
UKIP | Desmond Clewes | 131 | 15.6 | -1.1 | |
Liberal Democrats | Christopher John Blount | 113 | 13.5 | +8.2 | |
Labour | Marion Louise Harley | 110 | 13.1 | +0.9 | |
Majority | 354 | 42.2 | -1.0 | ||
Turnout | 839 | 23.7 | -44.0 | ||
Conservative hold | Swing | ||||
Party | Candidate | Votes | % | ±% | |
---|---|---|---|---|---|
Liberal Democrats | Andy Graham | 666 | 45.6 | +2.4 | |
Conservative | Philippa Hannah Phelan | 445 | 30.5 | +3.0 | |
Green | Liz Reason | 231 | 15.8 | +5.0 | |
Labour | Sue Richards | 118 | 8.1 | +0.8 | |
Majority | 221 | 15.1 | +5.4 | ||
Turnout | 1460 | 48.7 | -28.8 | ||
Liberal Democrats hold | Swing | ||||
Party | Candidate | Votes | % | ±% | |
---|---|---|---|---|---|
Labour | Mike Cahill | 766 | 40.5 | +14.7 | |
Conservative | Jonny Rosemont | 631 | 33.4 | -18.5 | |
Liberal Democrats | Juliet Elizabeth Anson | 495 | 26.2 | +20.9 | |
Majority | 135 | 7.1 | N/A | ||
Turnout | 1892 | 37.9 | -35.4 | ||
Labour gain from Conservative | Swing | ||||
Party | Candidate | Votes | % | ±% | |
---|---|---|---|---|---|
Liberal Democrats | Dan Levy | 1,005 | 53.0 | +34.3 | |
Conservative | Peter David Kelland | 442 | 23.3 | -18.3 | |
Green | Helen Gavin | 300 | 15.8 | +2.2 | |
Labour | Judith Frances Wardle | 148 | 7.8 | -7.5 | |
Majority | 563 | 29.7 | N/A | ||
Turnout | 1895 | 39.7 | -35.0 | ||
Liberal Democrats gain from Conservative | Swing | ||||
Party | Candidate | Votes | % | ±% | |
---|---|---|---|---|---|
Conservative | Gillian Rosalind Hill | 567 | 46.0 | -10.0 | |
Liberal Democrats | Gabriel William Jonathan Schenk | 402 | 32.6 | +18.5 | |
Labour | Gavin John Hyatt | 133 | 10.8 | -5.2 | |
Green | Frances Mortimer | 130 | 10.6 | -3.4 | |
Majority | 165 | 13.4 | -28.5 | ||
Turnout | 1232 | 39.2 | -36.8 | ||
Conservative hold | Swing | ||||
Party | Candidate | Votes | % | ±% | |
---|---|---|---|---|---|
Conservative | Andrew Clive Beaney | 571 | 52.9 | -7.8 | |
Green | Celia Jocelyn Kerslake | 190 | 17.6 | +9.5 | |
Liberal Democrats | Mike Baggaley | 174 | 16.1 | +7.8 | |
Labour | Steve Akers | 145 | 13.4 | -0.9 | |
Majority | 381 | 35.3 | -11.1 | ||
Turnout | 1080 | 34.0 | -38.3 | ||
Conservative hold | Swing | ||||
Party | Candidate | Votes | % | ±% | |
---|---|---|---|---|---|
Liberal Democrats | Nathalie Claire Anne Chapple | 648 | 45.7 | +33.9 | |
Conservative | Charles Cottrell-Dormer | 485 | 34.2 | -23.5 | |
Green | Mathew Parkinson | 182 | 12.8 | -0.5 | |
Labour | David John Baldwin | 103 | 7.3 | -9.8 | |
Majority | 163 | 11.5 | N/A | ||
Turnout | 1418 | 44.3 | -34.4 | ||
Liberal Democrats gain from Conservative | Swing | ||||
Party | Candidate | Votes | % | ±% | |
---|---|---|---|---|---|
Labour | Luci Ashbourne | 602 | 47.3 | +15.6 | |
Conservative | Craig Brown | 452 | 35.5 | -10.5 | |
Green | Stuart MacDonald | 125 | 9.8 | +2.0 | |
Liberal Democrats | Mark Mann | 94 | 7.4 | +1.6 | |
Majority | 150 | 11.8 | N/A | ||
Turnout | 1273 | 33.4 | -33.3 | ||
Labour gain from Conservative | Swing | ||||
Party | Candidate | Votes | % | ±% | |
---|---|---|---|---|---|
Labour | Joy Aitman | 1,020 | 50.5 | +26.4 | |
Conservative | Dean Temple | 717 | 35.5 | -18.4 | |
Liberal Democrats | Gilly Workman | 283 | 14.0 | +9.7 | |
Majority | 303 | 15.0 | N/A | ||
Turnout | 2020 | 35.9 | -39.5 | ||
Labour gain from Conservative | Swing | ||||
Party | Candidate | Votes | % | ±% | |
---|---|---|---|---|---|
Independent | Richard Andrew Langridge | 463 | 35.7 | +35.7 | |
Conservative | Andy McMahon | 305 | 23.5 | -26.1 | |
Labour | Trevor Ian License | 276 | 21.3 | +2.7 | |
Green | Andrew Peter Prosser | 168 | 13.0 | -1.3 | |
Liberal Democrats | William Harry Griffiths | 84 | 6.5 | +0.5 | |
Majority | 158 | 12.2 | N/A | ||
Turnout | 1296 | 41.3 | -28.8 | ||
Independent gain from Conservative | Swing | ||||
Party | Candidate | Votes | % | ±% | |
---|---|---|---|---|---|
Labour | Owen Gregory Blase Collins | 637 | 40.8 | +18.8 | |
Conservative | Alvin Jon Adams | 585 | 37.5 | -9.7 | |
Green | Carol Rae Cather | 228 | 14.6 | +6.8 | |
Liberal Democrats | Edward Mortimer | 110 | 7.1 | +1.7 | |
Majority | 52 | 3.3 | N/A | ||
Turnout | 1560 | 33.0 | -34.4 | ||
Labour gain from Conservative | Swing | ||||
Party | Candidate | Votes | % | ±% | |
---|---|---|---|---|---|
Conservative | Harry Brian Eaglestone | 554 | 46.2 | -15.1 | |
Liberal Democrats | Derek George Laud | 324 | 27.0 | +20.2 | |
Labour | Ian Bradley Moore | 217 | 18.1 | +3.8 | |
Green | Sandra Mary Simpson | 105 | 8.8 | +2.2 | |
Majority | 230 | 19.2 | -27.8 | ||
Turnout | 1200 | 34.4 | -36.1 | ||
Conservative hold | Swing | ||||
Cherwell is a local government district in northern Oxfordshire, England. The district was created in 1974 and takes its name from the River Cherwell, which drains south through the region to flow into the River Thames at Oxford. Towns in Cherwell include Banbury and Bicester. Kidlington is a contender for largest village in England.
South Oxfordshire is a local government district in the ceremonial county of Oxfordshire, England. Its council is temporarily based outside the district at Abingdon-on-Thames pending a planned move to Didcot, the district's largest town. The areas located south of the River Thames are within the historic county of Berkshire.
The 1998 West Oxfordshire District Council election took place on 7 May 1998 to elect members of West Oxfordshire District Council in Oxfordshire, England. One third of the council was up for election and the council stayed under no overall control.
The 1999 West Oxfordshire District Council election took place on 6 May 1999 to elect members of West Oxfordshire District Council in Oxfordshire, England. One third of the council was up for election and the council stayed under no overall control.
The 2000 West Oxfordshire District Council election took place on 4 May 2000 to elect members of West Oxfordshire District Council in Oxfordshire, England. One third of the council was up for election and the Conservative Party gained overall control of the council from no overall control.
The 2002 West Oxfordshire District Council election took place on 2 May 2002 to elect members of West Oxfordshire District Council in Oxfordshire, England. The whole council was up for election with boundary changes since the last election in 2000. The Conservative Party stayed in overall control of the council.
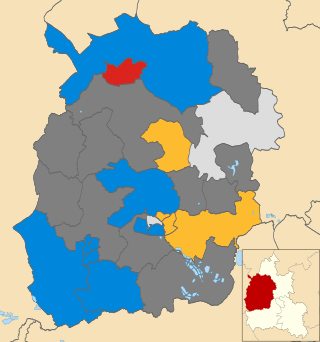
The 2003 West Oxfordshire District Council election took place on 1 May 2003 to elect members of West Oxfordshire District Council in Oxfordshire, England. One third of the council was up for election and the Conservative Party stayed in overall control of the council.
The 2006 West Oxfordshire District Council election took place on 4 May 2006 to elect members of West Oxfordshire District Council in Oxfordshire, England. One third of the council was up for election and the Conservative Party stayed in overall control of the council.
The 2007 West Oxfordshire District Council election took place on 3 May 2007 to elect members of West Oxfordshire District Council in Oxfordshire, England. One third of the council was up for election and the Conservative Party stayed in overall control of the council.
The 2008 West Oxfordshire District Council election took place on 1 May 2008 to elect members of West Oxfordshire District Council in Oxfordshire, England. One third of the council was up for election and the Conservative Party stayed in overall control of the council.
The 2010 West Oxfordshire District Council election took place on 6 May 2010 to elect members of West Oxfordshire District Council in Oxfordshire, England. One third of the council was up for election and the Conservative Party stayed in overall control of the council.
The 2011 West Oxfordshire District Council election took place on 5 May 2011 to elect members of West Oxfordshire District Council in Oxfordshire, England. One third of the council was up for election and the Conservative Party stayed in overall control of the council.
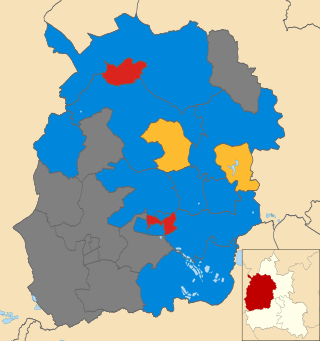
The 2012 West Oxfordshire District Council election took place on 3 May 2012 to elect members of West Oxfordshire District Council in Oxfordshire, England. One third of the council was up for election and the Conservative Party stayed in overall control of the council.
The 2014 West Oxfordshire District Council election took place on 22 May 2014 to elect members of West Oxfordshire District Council in Oxfordshire, England. One third of the council was up for election and the Conservative Party stayed in overall control of the council.
The 2015 West Oxfordshire District Council election took place on 22 May 2015 to elect members of West Oxfordshire District Council in Oxfordshire, England. One third of the council was up for election and the Conservative Party stayed in overall control of the council.
The 2016 West Oxfordshire District Council election was held on 5 May 2016 to elect members of West Oxfordshire District Council in England. This was on the same day as other local elections.
On 20 October 2016, a by-election was held in the UK parliamentary constituency of Witney. It took place on the same day as the Batley and Spen by-election. They were the fifth and sixth by-elections of the 56th UK Parliament.
The 2018 West Oxfordshire District Council election was held on 3 May 2018 to elect members of West Oxfordshire District Council in England. This was on the same day as other local elections.
The 2019 South Oxfordshire District Council election took place on 2 May 2019 to elect members of South Oxfordshire District Council in Oxfordshire, England. The whole council was up for election. The Conservatives lost control of the council.
The 2022 West Oxfordshire District Council election took place on 5 May 2022 to elect members of West Oxfordshire District Council in Oxfordshire, England. One-third of the council was up for election and the Conservative Party lost control of the council to no overall control.