Results maps
 2002 results map
 2004 results map
 2006 results map
 2008 results map
 2010 results map
 2012 results map
 2014 results map
 2016 results map
 2018 results map
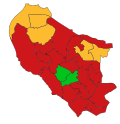 2021 results map
 2022 results map
 2024 results map
Oxford City Council in Oxford, England is elected every two years, with half of the 48 seats in the City Council up for election on each occasion. Elections are held in even-numbered years. Until 2002 the council was elected by thirds.
As vacancies arise between elections, by-elections are held to elect a replacement councillor.
| Year | Labour | Conservative | Liberal Democrats [a] | Green [b] | IWCA | IOA | Independents & Others | Council control after election | |
|---|---|---|---|---|---|---|---|---|---|
| Local government reorganisation; council established (45 seats) | |||||||||
| 1973 | 30 | 12 | 3 | – | – | – | 0 | Labour | |
| 1976 | 15 | 30 | 0 | 0 | – | – | 0 | Conservative | |
| New ward boundaries (45 seats) | |||||||||
| 1979 | 19 | 26 | 0 | 0 | – | – | 0 | Conservative | |
| 1980 | 24 | 21 | 0 | 0 | – | – | 0 | Labour | |
| 1982 | 26 | 18 | 1 | 0 | – | – | 0 | Labour | |
| 1983 | 28 | 15 | 2 | 0 | – | – | 0 | Labour | |
| 1984 | 27 | 15 | 3 | 0 | – | – | 0 | Labour | |
| 1986 | 30 | 11 | 4 | 0 | – | – | 0 | Labour | |
| 1987 | 29 | 11 | 5 | 0 | – | – | 0 | Labour | |
| 1988 | 30 | 10 | 5 | 0 | – | – | 0 | Labour | |
| 1990 | 30 | 10 | 5 | 0 | – | – | 0 | Labour | |
| New ward boundaries (51 seats) | |||||||||
| 1991 | 37 | 9 | 5 | 0 | – | – | 0 | Labour | |
| 1992 | 35 | 10 | 6 | 0 | – | – | 0 | Labour | |
| 1994 | 36 | 7 | 7 | 1 | – | – | 0 | Labour | |
| 1995 | 38 | 4 | 8 | 1 | 0 | – | 0 | Labour | |
| 1996 | 39 | 0 | 9 | 3 | 0 | – | 0 | Labour | |
| 1998 | 33 | 0 | 14 | 4 | 0 | – | 0 | Labour | |
| 1999 | 28 | 0 | 16 | 7 | 0 | – | 0 | Labour | |
| 2000 | 20 | 1 | 21 | 8 | 1 | – | 0 | No overall control | |
| New ward boundaries (48 seats) | |||||||||
| 2002 | 29 | 0 | 15 | 3 | 1 | – | 0 | Labour | |
| 2004 | 20 | 0 | 18 | 5 | 3 | – | 2 | No overall control | |
| 2006 | 17 | 0 | 19 | 7 | 4 | – | 1 | No overall control | |
| 2008 | 23 | 0 | 16 | 7 | 2 | – | 0 | No overall control | |
| 2010 | 25 | 0 | 17 | 5 | 0 | – | 1 | Labour | |
| 2012 | 29 | 0 | 13 | 5 | 0 | – | 1 | Labour | |
| 2014 | 33 | 0 | 8 | 6 | 0 | – | 1 | Labour | |
| 2016 | 35 | 0 | 8 | 4 | 0 | – | 1 | Labour | |
| 2018 | 36 | 0 | 9 | 2 | 0 | – | 1 | Labour | |
| New ward boundaries (48 seats) | |||||||||
| 2021 | 34 | 0 | 9 | 3 | – | – | 2 | Labour | |
| 2022 | 32 | 0 | 9 | 6 | – | – | 1 | Labour | |
| 2024 | 20 | 0 | 9 | 8 | – | 4 | 7 | No overall control | |


| Party | Candidate | Votes | % | ±% | |
|---|---|---|---|---|---|
| Labour | James Taylor | 461 | 36.8 | −16.9 | |
| IOA | Nasreen Majeed | 445 | 35.5 | New | |
| Green | Stephen Hurt | 158 | 12.6 | −5.2 | |
| Conservative | Eric Sukumaran | 98 | 7.8 | −9.1 | |
| Liberal Democrats | Hana Packford | 62 | 4.9 | −6.7 | |
| TUSC | Agnieszka Kowalska | 30 | 2.4 | New | |
| Majority | 16 | 1.3 | −34.7 | ||
| Turnout | 1,259 | 31.3 | +1.5 | ||
| Labour hold | Swing | ||||
| Party | Candidate | Votes | % | ±% | |
|---|---|---|---|---|---|
| Green | Kate Robinson | 640 | 34.5 | −3.5 | |
| IOA | Nasreen Majeed | 596 | 32.1 | New | |
| Labour | Charlotte Vinnicombe | 495 | 26.7 | –18.0 | |
| Conservative | Duncan Hatfield | 70 | 3.8 | –11.0 | |
| Liberal Democrats | Kathy Norman | 55 | 3.0 | –0.6 | |
| Majority | 44 | 2.4 | |||
| Turnout | 1,856 | 39.4 | −3.5 | ||
| Green hold | Swing | ||||
| Party | Candidate | Votes | % | ±% | |
|---|---|---|---|---|---|
| Labour | Sandy Douglas | 607 | 44.9 | +0.6 | |
| Independent | Michael Evans | 507 | 37.5 | +2.9 | |
| Conservative | Timothy Patmore | 135 | 10.0 | −1.5 | |
| Green | David Thomas | 65 | 4.8 | −1.7 | |
| Liberal Democrats | Theo Jupp | 26 | 1.9 | −1.5 | |
| TUSC | Rachel Cox | 12 | 0.9 | +0.9 | |
| Majority | 594 | 36.0 | |||
| Turnout | 1,363 | 33 | |||
| Labour hold | Swing | ||||
| Party | Candidate | Votes | % | ±% | |
|---|---|---|---|---|---|
| Labour | Anna Railton | 801 | 51.3 | −10.6 | |
| Green | Alex Powell | 305 | 19.5 | −0.9 | |
| Independent | Deborah Glass Woodin | 270 | 17.3 | +17.3 | |
| Liberal Democrats | Rick Tanner | 118 | 7.6 | −4.1 | |
| Conservative | Jennifer Saunders | 60 | 3.8 | −2.2 | |
| TUSC | Callum Joyce | 8 | 0.5 | +0.5 | |
| Majority | 594 | 36.0 | |||
| Turnout | 1562 | 36 | |||
| Labour hold | Swing | ||||
| Party | Candidate | Votes | % | ±% | |
|---|---|---|---|---|---|
| Liberal Democrats | Liz Wade | 998 | 60.5 | −0.5 | |
| Conservative | Jenny Jackson | 404 | 24.5 | +1.0 | |
| Labour | Ibrahim el-Hendi | 162 | 9.8 | −0.1 | |
| Green | Sarah Edwards | 86 | 5.2 | −0.5 | |
| Majority | 594 | 36.0 | |||
| Turnout | 1,650 | ||||
| Liberal Democrats hold | Swing | ||||
| Party | Candidate | Votes | % | ±% | |
|---|---|---|---|---|---|
| Liberal Democrats | Stef Garden | 949 | 60.9 | −0.4 | |
| Labour | Simon Ottino | 419 | 26.9 | −0.2 | |
| Conservative | Georgina Gibbs | 124 | 8.0 | +1.7 | |
| Green | Ray Hitchins | 67 | 4.3 | −1.1 | |
| Majority | 530 | 34.0 | |||
| Turnout | 1,559 | ||||
| Liberal Democrats hold | Swing | ||||
| Party | Candidate | Votes | % | ±% | |
|---|---|---|---|---|---|
| Labour | Mark Ladbrooke | 698 | 47.1 | −2.6 | |
| Conservative | Peter Saville | 284 | 19.2 | +6.9 | |
| Independent | Chaka Artwell | 203 | 13.7 | −3.0 | |
| Liberal Democrats | Steve Wheeler | 194 | 13.1 | +4.4 | |
| Green | Symon Hill | 103 | 7.0 | +1.2 | |
| Majority | 414 | 27.9 | |||
| Turnout | 1,482 | ||||
| Labour hold | Swing | ||||
| Party | Candidate | Votes | % | ±% | |
|---|---|---|---|---|---|
| Labour | Jennifer Pegg | 509 | 77.9 | +6.3 | |
| UKIP | Joe Lawes | 60 | 9.2 | +9.2 | |
| Conservative | Gary Dixon | 47 | 7.2 | −4.3 | |
| Green | Lucy Ayrton | 28 | 4.3 | −7.0 | |
| TUSC | James Morbin | 9 | 1.4 | +1.4 | |
| Majority | 449 | 68.8 | |||
| Turnout | 653 | ||||
| Labour hold | Swing | ||||
| Party | Candidate | Votes | % | ±% | |
|---|---|---|---|---|---|
| Labour | Sian Taylor | 401 | 70.6 | −1.0 | |
| Conservative | Gary Dixon | 65 | 11.4 | −0.1 | |
| Green | Ann Duncan | 50 | 8.8 | −2.5 | |
| TUSC | James Morbin | 34 | 6.0 | +6.0 | |
| Liberal Democrats | Michael Tait | 18 | 3.2 | −2.4 | |
| Majority | 336 | 59.2 | |||
| Turnout | 568 | ||||
| Labour hold | Swing | ||||
| Party | Candidate | Votes | % | ±% | |
|---|---|---|---|---|---|
| Labour | Linda Smith | 509 | 75.7 | +8.4 | |
| UKIP | Dave Slater | 91 | 13.5 | −7.0 | |
| Conservative | Berk Bektas | 27 | 4.0 | −1.7 | |
| Green | Elizabeth McHale | 21 | 3.1 | −1.4 | |
| TUSC | Stella Collier | 13 | 1.9 | +1.9 | |
| Liberal Democrats | Lesley Mallinder | 11 | 1.6 | −0.4 | |
| Majority | 418 | 62.2 | |||
| Turnout | 672 | ||||
| Labour hold | Swing | ||||
| Party | Candidate | Votes | % | ±% | |
|---|---|---|---|---|---|
| Labour | Chewe Munkonge | 782 | 42.3 | −1.3 | |
| Liberal Democrats | Roz Smith | 615 | 33.2 | +7.8 | |
| Conservative | Katharine Harborne | 222 | 12.0 | −7.2 | |
| Green | Liz Taylor | 186 | 10.0 | −1.7 | |
| English Democrat | Julia Gasper | 43 | 2.3 | +2.3 | |
| Majority | 167 | 9.1 | |||
| Turnout | 1848 | 38 | |||
| Labour hold | Swing | ||||
| Party | Candidate | Votes | % | ±% | |
|---|---|---|---|---|---|
| Labour | Alex Hollingsworth | 168 | 44.2 | +11.9 | |
| Liberal Democrats | Tony Brett | 101 | 26.6 | +3.3 | |
| Green | Richard Scrase | 63 | 16.6 | −9.8 | |
| Conservative | Maryam Ahmed | 24 | 6.3 | −11.6 | |
| UKIP | Kenrick Bird | 24 | 6.3 | +6.3 | |
| Majority | 67 | 17.6 | |||
| Turnout | 380 | 8.6 | |||
| Labour hold | Swing | ||||
| Party | Candidate | Votes | % | ±% | |
|---|---|---|---|---|---|
| Labour | David Henwood | 512 | 39.4 | −11.9 | |
| Green | Hazel Dawe | 269 | 20.7 | −2.1 | |
| Independent | Artwell | 257 | 19.8 | +19.8 | |
| Conservative | Katharine Harborne | 152 | 11.7 | −4.5 | |
| UKIP | Ian Macdonald | 72 | 5.5 | +5.5 | |
| Liberal Democrats | Prakash Sharma | 39 | 3.0 | −13.2 | |
| Majority | 243 | 18.7 | |||
| Turnout | 1301 | 28 | |||
| Labour hold | Swing | ||||
| Party | Candidate | Votes | % | ±% | |
|---|---|---|---|---|---|
| Labour | Louise Upton | 367 | 34.7 | +18.0 | |
| Liberal Democrats | Tim Bearder | 330 | 31.2 | −13.4 | |
| Green | Sushila Dhall | 262 | 24.7 | +10.6 | |
| Conservative | John Walsh | 100 | 9.4 | −15.1 | |
| Majority | 37 | 3.5 | |||
| Turnout | 1059 | 23 | |||
| Labour gain from Liberal Democrats | Swing | ||||
| Party | Candidate | Votes | % | ±% | |
|---|---|---|---|---|---|
| Labour | Roy Darke | 548 | 38.3 | +2.0 | |
| Conservative | Marc Borja | 443 | 31.0 | −2.6 | |
| Liberal Democrats | Ruth Beer | 378 | 26.4 | +2.4 | |
| Green | Katherine Wedell | 62 | 4.3 | −1.8 | |
| Majority | 105 | 7.3 | |||
| Turnout | 1431 | 32.9 | +1.7 | ||
| Labour hold | Swing | ||||
| Party | Candidate | Votes | % | ±% | |
|---|---|---|---|---|---|
| Liberal Democrats | Mark Mills | 188 | 40.4 | −5.0 | |
| Conservative | Paul Sargent | 112 | 24.1 | +1.6 | |
| Labour | Sarah Hutchinson | 93 | 20.0 | +6.4 | |
| Green | Chip Sherwood | 72 | 15.5 | −3.0 | |
| Majority | 76 | 16.3 | |||
| Turnout | 465 | 11.7 | −15.2 | ||
| Liberal Democrats hold | Swing | ||||
| Party | Candidate | Votes | % | ±% | |
|---|---|---|---|---|---|
| Labour | Bob Timbs | 784 | 52.8 | +8.4 | |
| Liberal Democrats | Nathan Pyle | 487 | 32.8 | −10.2 | |
| Conservative | Judith Harley | 150 | 10.1 | +10.1 | |
| Green | Larry Sanders | 64 | 4.3 | −8.4 | |
| Majority | 297 | 20.0 | |||
| Turnout | 1,485 | 31.0 | |||
| Labour hold | Swing | ||||
| Party | Candidate | Votes | % | ±% | |
|---|---|---|---|---|---|
| Labour | Oscar Van Nooijen | 676 | 45.6 | −3.2 | |
| Green | Lilian Sherwood | 436 | 29.4 | −0.6 | |
| Liberal Democrats | Nathan Pyle | 217 | 14.6 | +5.7 | |
| Conservative | Caroline Ten Holter | 155 | 10.4 | −1.8 | |
| Majority | 240 | 16.2 | |||
| Turnout | 1,484 | 33.5 | |||
| Labour hold | Swing | ||||
| Party | Candidate | Votes | % | ±% | |
|---|---|---|---|---|---|
| Labour | Colin Cook | 713 | 44.0 | +10.7 | |
| Liberal Democrats | John Ballance | 437 | 27.0 | −12.1 | |
| Green | Athene Reiss | 355 | 21.9 | +6.6 | |
| Conservative | Patricia Jones | 115 | 7.1 | −5.2 | |
| Majority | 276 | 17.0 | |||
| Turnout | 1,620 | 33.1 | |||
| Labour gain from Liberal Democrats | Swing | ||||
| Party | Candidate | Votes | % | ±% | |
|---|---|---|---|---|---|
| Labour | Carole Roberts | 592 | 54.7 | +8.2 | |
| Ind. Working Class | Delvise Saunders | 300 | 27.7 | −12.8 | |
| Liberal Democrats | Rosemary Morlin | 141 | 13.0 | +5.0 | |
| Conservative | Patricia Jones | 31 | 2.9 | −2.9 | |
| Green | Susan Tibbles | 19 | 1.7 | −3.3 | |
| Majority | 451 | 27.0 | |||
| Turnout | 1,083 | 26.1 | |||
| Labour hold | Swing | ||||
| Party | Candidate | Votes | % | ±% | |
|---|---|---|---|---|---|
| Labour | Rae Humberstone | 969 | 50.0 | ||
| Ind. Working Class | Kelly Webster | 566 | 29.2 | ||
| Conservative | Stuart Hand | 176 | 9.1 | ||
| Liberal Democrats | Nathan Pyle | 172 | 8.9 | ||
| Green | Susan Tibbles | 54 | 2.8 | ||
| Majority | 403 | 20.8 | |||
| Turnout | 1,937 | 48.6 | |||
| Labour hold | Swing | ||||
| Party | Candidate | Votes | % | ±% | |
|---|---|---|---|---|---|
| Green | Sushila Dhall | 203 | 33.3 | −3.6 | |
| Liberal Democrats | Pamela Bones | 175 | 28.7 | −2.5 | |
| Labour | Bill Turner | 161 | 26.4 | +7.9 | |
| Conservative | Michael Davis | 71 | 11.6 | −1.8 | |
| Majority | 28 | 4.6 | |||
| Turnout | 610 | 14.9 | |||
| Green hold | Swing | ||||
| Party | Candidate | Votes | % | ±% | |
|---|---|---|---|---|---|
| Labour | Molly Florey | 634 | 69.4 | +8.0 | |
| Liberal Democrats | Bernard Gowers | 138 | 15.1 | +5.1 | |
| Conservative | David Brown | 103 | 11.3 | −7.2 | |
| Green | Patricia Dickson | 38 | 4.2 | −5.8 | |
| Majority | 496 | 54.3 | |||
| Turnout | 913 | 11.3 | |||
| Labour hold | Swing | ||||
| Party | Candidate | Votes | % | ±% | |
|---|---|---|---|---|---|
| Liberal Democrats | Antony Brett | 1,165 | 33.4 | ||
| Green | Paul Williams | 995 | 28.5 | ||
| Conservative | Richard Sage | 692 | 19.8 | ||
| Labour | Joel Brookfield | 635 | 18.2 | ||
| Majority | 170 | 4.9 | |||
| Turnout | 3,487 | ||||
| Liberal Democrats gain from Green | Swing | ||||
| Party | Candidate | Votes | % | ±% | |
|---|---|---|---|---|---|
| Liberal Democrats | 719 | 43.7 | −7.1 | ||
| Labour | 506 | 30.7 | +2.8 | ||
| Conservative | 352 | 21.4 | +3.8 | ||
| Green | 69 | 4.2 | +0.5 | ||
| Majority | 213 | 13.0 | |||
| Turnout | 1,646 | 33.0 | |||
| Liberal Democrats hold | Swing | ||||
| Party | Candidate | Votes | % | ±% | |
|---|---|---|---|---|---|
| Labour | 512 | 32.7 | −12.8 | ||
| Liberal Democrats | 511 | 32.6 | +14.3 | ||
| Green | 405 | 25.8 | +3.7 | ||
| Conservative | 139 | 8.9 | −5.2 | ||
| Majority | 1 | 0.1 | |||
| Turnout | 1,567 | 26.8 | |||
| Labour hold | Swing | ||||
| Party | Candidate | Votes | % | ±% | |
|---|---|---|---|---|---|
| Liberal Democrats | 780 | 50.2 | +21.7 | ||
| Labour | 462 | 29.7 | −8.4 | ||
| Conservative | 259 | 16.7 | −10.0 | ||
| Green | 54 | 3.5 | −3.2 | ||
| Majority | 318 | 20.5 | |||
| Turnout | 1,555 | 25.5 | |||
| Liberal Democrats gain from Labour | Swing | ||||
| Party | Candidate | Votes | % | ±% | |
|---|---|---|---|---|---|
| Liberal Democrats | 478 | 41.9 | +30.5 | ||
| Labour | 385 | 33.7 | −24.6 | ||
| Conservative | 222 | 19.5 | −4.8 | ||
| Green | 56 | 5.0 | −1.1 | ||
| Majority | 93 | 8.2 | |||
| Turnout | 1,141 | 23.0 | |||
| Liberal Democrats gain from Labour | Swing | ||||
The City of Oxford | ||
|---|---|---|
| Wards, suburbs, neighbourhoods and districts |
|  |
| Civil parishes | ||
| Former district and borough | ||
| Former constituencies | ||