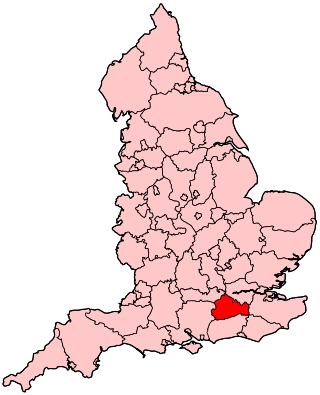
The 2019 Epsom and Ewell Borough Council election took place on 2 May 2019 to elect members of Epsom and Ewell Borough Council. This was on the same day as other local elections. The entire council (38 seats) was up for election. The result was a gain for the incumbent Residents Associations of Epsom and Ewell, gaining 2 seats from the Conservatives but losing 1 to them as well. [1] The Liberal Democrats regained representation on the council, gaining 2 seats from the Conservatives.
Party | Seats | Gains | Losses | Net gain/loss | Seats % | Votes % | Votes | +/− | |
---|---|---|---|---|---|---|---|---|---|
Residents Association | 32 | 2 | 1 | +1 | 84.2 | 60.5 | 32,621 | +14.5 | |
Labour | 3 | 0 | 0 | - | 7.9 | 11.0 | 5,918 | -5 | |
Liberal Democrats | 2 | 2 | 0 | +2 | 5.3 | 13.2 | 7,093 | +6.2 | |
Conservative | 1 | 1 | 4 | -3 | 2.6 | 14.3 | 7,699 | -16.3 | |
Green | 0 | 0 | 0 | - | 0 | 1.1 | 606 | +0.8 |
The Residents Associations of Epsom and Ewell consists of: [3]
Party | Candidate | Votes | % | |
---|---|---|---|---|
Residents Association | John Beckett | 889 | 83.3 | |
Residents Association | Peter Webb | 838 | 78.5 | |
Conservative | William Pontin | 81 | 7.6 | |
Conservative | Keew Ng | 71 | 6.7 | |
Labour | Julia Lucas | 69 | 6.5 | |
Labour | Nora Pearce | 62 | 5.8 | |
Liberal Democrats | Rachel Sumeray | 45 | 4.2 | |
Turnout | 1,070 | 34.68 | ||
Residents Association hold | ||||
Residents Association hold |
Party | Candidate | Votes | % | |
---|---|---|---|---|
Liberal Democrats | Julie Morris | 864 | 45.2 | |
Liberal Democrats | David Gulland | 838 | 43.9 | |
Residents Association | Nigel Collin | 749 | 39.2 | |
Liberal Democrats | Andrej Kubicek | 738 | 38.6 | |
Residents Association | Christine Long | 649 | 34.0 | |
Residents Association | Robert Leach | 645 | 33.8 | |
Conservative | Alexander Clarke | 323 | 16.9 | |
Conservative | Gjergj Bushati | 255 | 13.4 | |
Conservative | Alastair Whitby | 252 | 13.2 | |
Labour | Margaret Lewis | 136 | 7.1 | |
Labour | Rosalind Godson | 131 | 6.9 | |
Turnout | 1,916 | 45.26 | ||
Liberal Democrats gain from Conservative | ||||
Residents Association gain from Conservative | ||||
Party | Candidate | Votes | % | |
---|---|---|---|---|
Labour | Kate Chinn | 601 | 46.6 | |
Labour | Rob Geleit | 589 | 45.7 | |
Labour | Debbie Monksfield | 571 | 44.3 | |
Residents Association | Christine Beams | 396 | 30.7 | |
Residents Association | Mary Sullivan | 365 | 28.3 | |
Residents Association | David Triggs | 329 | 25.5 | |
Conservative | Gordon Paterson | 186 | 14.4 | |
Conservative | Alexander Peacock | 186 | 14.4 | |
Conservative | Simon Smyth | 164 | 12.7 | |
Liberal Democrats | David Buxton | 155 | 12.0 | |
Liberal Democrats | Oliver Schuster | 131 | 10.2 | |
Liberal Democrats | Dorothee Wilbs | 116 | 9.0 | |
Turnout | 1,299 | 26.06 | ||
Labour hold | ||||
Labour hold | ||||
Labour hold |
Party | Candidate | Votes | % | |
---|---|---|---|---|
Residents Association | Robert Foote | 977 | 70.3 | |
Residents Association | Lucie Dallen | 969 | 69.7 | |
Residents Association | Phillip Neale | 962 | 69.2 | |
Liberal Democrats | Raj Saini | 190 | 13.7 | |
Conservative | Jennifer Arkwell | 175 | 12.6 | |
Conservative | Paul Crispin | 160 | 11.5 | |
Labour | Marita Gerrard | 159 | 11.4 | |
Labour | Kevin Davies | 136 | 9.8 | |
Labour | Godfrey Mason | 124 | 8.9 | |
Conservative | John Earnshaw | 118 | 8.5 | |
Turnout | 1,392 | 31.00 | ||
Residents Association hold | ||||
Residents Association hold |
Party | Candidate | Votes | % | |
---|---|---|---|---|
Residents Association | Christine Cleveland | 922 | 69.0 | |
Residents Association | Clive Woodbridge | 903 | 67.6 | |
Residents Association | Humphrey Reynolds | 887 | 66.4 | |
Conservative | Tony Kitcat | 155 | 11.6 | |
Liberal Democrats | Tony Fincham | 140 | 10.5 | |
Conservative | David Price | 140 | 10.5 | |
Labour | Sandra Hatfield | 139 | 10.4 | |
Liberal Democrats | Philip Pavey | 138 | 10.3 | |
Conservative | Diane Earnshaw | 134 | 10.0 | |
Liberal Democrats | Kenneth Kimber | 129 | 9.7 | |
Labour | Samuel Woodall | 126 | 9.4 | |
Labour | Michael Westbrook | 124 | 9.3 | |
Turnout | 1,344 | 31.18 | ||
Residents Association hold | ||||
Residents Association hold |
Party | Candidate | Votes | % | |
---|---|---|---|---|
Residents Association | Eber Kington | 1,241 | 85.6 | |
Residents Association | Peter O'Donovan | 1,167 | 80.5 | |
Residents Association | Guy Robbins | 1,139 | 78.6 | |
Conservative | Colm Egan | 122 | 8.4 | |
Conservative | Danny Fullilove | 117 | 8.1 | |
Labour | Mike Nelson | 101 | 7.0 | |
Conservative | Andrew Sharpe | 101 | 7.0 | |
Labour | Naim Salam | 92 | 6.3 | |
Liberal Democrats | Lee Robertson | 85 | 5.9 | |
Turnout | 1,454 | 33.56 | ||
Residents Association hold | ||||
Residents Association hold |
Party | Candidate | Votes | % | |
---|---|---|---|---|
Residents Association | Christine Howells | 1,124 | 80.2 | |
Residents Association | Christopher Frost | 1,079 | 77.0 | |
Residents Association | Colin Keane | 1,058 | 75.5 | |
Liberal Democrats | Steve Dixon | 140 | 10.0 | |
Liberal Democrats | Linda Chimiel | 132 | 9.4 | |
Conservative | Peter Chan | 118 | 8.4 | |
Conservative | Geoffrey Pope | 116 | 8.3 | |
Liberal Democrats | Joao de Campos Cruz | 113 | 8.1 | |
Conservative | Linda Trompetto | 101 | 7.2 | |
Labour | Alexander Edwards | 62 | 4.4 | |
Labour | Ian Ward | 49 | 3.5 | |
Turnout | 1,407 | 31.02 | ||
Residents Association hold | ||||
Residents Association hold |
Party | Candidate | Votes | % | |
---|---|---|---|---|
Residents Association | Janet Mason | 769 | 66.7 | |
Residents Association | Alex Coley | 747 | 64.8 | |
Residents Association | Alan Sursham | 703 | 61.0 | |
Labour | Susanna Bellino | 146 | 12.7 | |
Labour | Jason Anderson | 138 | 12.0 | |
Conservative | David Collins | 138 | 12.0 | |
Conservative | Joseph Alawo | 133 | 11.5 | |
Conservative | David Lyndsay | 133 | 11.5 | |
Labour | Ghazal Diani | 130 | 11.3 | |
Liberal Democrats | Julia Kirkland | 97 | 8.4 | |
Liberal Democrats | Ashley Day | 76 | 6.6 | |
Liberal Democrats | Adam Pettifer | 67 | 5.8 | |
Turnout | 1,158 | 25.23 | ||
Residents Association hold | ||||
Residents Association hold |
Party | Candidate | Votes | % | |
---|---|---|---|---|
Residents Association | Steve Bridger | 730 | 36.4 | |
Conservative | Bernadette Muir | 697 | 34.8 | |
Residents Association | Previn Jagutpal | 679 | 33.9 | |
Conservative | James Petit | 658 | 32.9 | |
Residents Association | Martin Olney | 657 | 32.8 | |
Conservative | Stephen Pontin | 593 | 29.6 | |
Green | Janice Baker | 362 | 18.1 | |
Liberal Democrats | Clare Clark | 312 | 15.6 | |
Liberal Democrats | Paul Vagg | 307 | 15.3 | |
Labour | Alexandra Payne | 216 | 10.8 | |
Liberal Democrats | Jeremy Smith | 215 | 10.7 | |
Labour | Garrick Bigwood | 169 | 8.4 | |
Labour | Amos Sibanda | 139 | 6.9 | |
Turnout | 2,009 | 37.39 | ||
Residents Association hold | ||||
Conservative gain from Residents Association | ||||
Residents Association hold |
Party | Candidate | Votes | % | |
---|---|---|---|---|
Residents Association | Hannah Dalton | 1,040 | 82.2 | |
Residents Association | David Reeve | 1,040 | 82.2 | |
Residents Association | Christopher Webb | 994 | 78.6 | |
Liberal Democrats | Yvonne Dowling | 84 | 6.6 | |
Conservative | James Larter | 78 | 6.2 | |
Liberal Democrats | James Dapre | 77 | 6.1 | |
Liberal Democrats | Brian Fisher | 68 | 5.4 | |
Conservative | Katy Sullivan | 68 | 5.4 | |
Labour | Sarah Humphreys | 63 | 5.0 | |
Conservative | Paul Willis | 59 | 4.7 | |
Labour | Tony Clark | 56 | 4.4 | |
Labour | Catherine Power | 52 | 4.1 | |
Turnout | 1,267 | 34.66 | ||
Residents Association hold | ||||
Residents Association hold |
Party | Candidate | Votes | % | |
---|---|---|---|---|
Residents Association | Neil Dallen | 795 | 51.6 | |
Residents Association | Luke Giles | 732 | 47.5 | |
Residents Association | Arthur Abdulin | 705 | 45.7 | |
Liberal Democrats | Alison Kelly | 379 | 24.6 | |
Liberal Democrats | Martin Kimber | 289 | 18.8 | |
Liberal Democrats | Julian Freeman | 276 | 17.9 | |
Labour | Caroline Barretto | 257 | 16.7 | |
Green | David Candlin | 244 | 15.8 | |
Labour | Richard Chinn | 206 | 13.4 | |
Labour | Stuart Gosling | 202 | 13.1 | |
Conservative | Stephen Hackett | 151 | 9.8 | |
Conservative | Graham Rapier | 145 | 9.4 | |
Conservative | Martin Richards | 137 | 8.9 | |
Turnout | 1,555 | 29.35 | ||
Residents Association hold | ||||
Residents Association hold |
Party | Candidate | Votes | % | |
---|---|---|---|---|
Residents Association | Clive Smitheram | 1,005 | 70.7 | |
Residents Association | Monica Coleman | 992 | 69.8 | |
Residents Association | Barry Nash | 967 | 68.0 | |
Labour | Michael Davis | 155 | 10.9 | |
Labour | Daniel Edwards | 147 | 10.3 | |
Labour | Danielle Grufferty | 142 | 9.9 | |
Liberal Democrats | Andrew Casey | 132 | 9.3 | |
Liberal Democrats | Rusmat Ahmed | 124 | 8.7 | |
Conservative | Edward Rutherford | 118 | 8.3 | |
Liberal Democrats | Paul da Silva | 112 | 7.9 | |
Conservative | David Tidd | 111 | 7.8 | |
Conservative | Clifford Woodroffe | 96 | 6.8 | |
Turnout | 1,429 | 30.46 | ||
Residents Association hold | ||||
Residents Association hold |
Party | Candidate | Votes | % | |
---|---|---|---|---|
Residents Association | Elizabeth Frost | 1,058 | 60.7 | |
Residents Association | Steven McCormick | 862 | 49.5 | |
Residents Association | Bernice Froud | 858 | 49.3 | |
Conservative | Christina Mountain | 607 | 34.8 | |
Conservative | Henry Strausser | 378 | 21.7 | |
Conservative | Arran Essex | 324 | 18.6 | |
Liberal Democrats | Julia Goacher | 203 | 11.7 | |
Labour | Abigail Bloom | 167 | 9.6 | |
Liberal Democrats | Emily Martyr | 166 | 9.5 | |
Liberal Democrats | John Payne | 155 | 8.9 | |
Labour | Catherine Carver-Hill | 135 | 7.7 | |
Labour | Dan Condon | 127 | 7.3 | |
Turnout | 1,751 | 39.32 | ||
Residents Association gain from Conservative | ||||
Residents Association hold | ||||
Residents Association hold |
Reigate and Banstead is a local government district with borough status in east Surrey, England. It includes the towns of Reigate, Redhill, Horley and Banstead. The borough borders the Borough of Crawley to the south, the Borough of Epsom and Ewell and District of Mole Valley to the west, Tandridge District to the east and the London Boroughs of Sutton and Croydon to the north.
Epsom and Ewell is a local government district with borough status in Surrey, England, covering the towns of Epsom and Ewell. The borough was formed as an urban district in 1894, and was known as Epsom until 1934. It was made a municipal borough in 1937. The district was considered for inclusion in Greater London in 1965 but was left unaltered by the London Government Act 1963 and the Local Government Act 1972 in 1974. However, despite being outside modern Greater London the borough was in the Metropolitan Police District until it was transferred to Surrey Police in 2000. In the May 2019 elections, the borough was held by the Epsom and Ewell Residents Association with 32 seats, Labour with 3 seats, Liberal Democrats with 2 seats, and Conservatives with 1 seat.
Epsom and Ewell is a constituency represented in the House of Commons of the UK Parliament since 2001 by Chris Grayling, a Conservative.
The Residents Associations of Epsom and Ewell is a local political party in the borough of Epsom and Ewell in Surrey, England. They have held majority control of Epsom and Ewell Borough Council since its formation in 1937. The party is sometimes recorded as Other in national results lists and otherwise recorded alongside residents associations with a single Articles of Association. It consists of ward or multiple ward based residents associations with their own candidate selection rules. These include Ewell Court Residents' Association, Epsom Town Residents' Association and West Ewell and Ruxley Residents’ Association.
Surrey County Council is the county council administering certain services in the non-metropolitan county of Surrey in England. The council is composed of 81 elected councillors, and in all but one election since 1965 the Conservative Party has held the majority. The leader of the council is Tim Oliver.
Epsom and Ewell Borough Council is elected every four years. It is notable for its long-standing control by a Residents' Association rather than one of the national political parties.
Elections to Surrey County Council took place on 4 June 2009 as part of the 2009 United Kingdom local elections, having been delayed from 7 May in order for the elections to take place alongside those to the European Parliament.
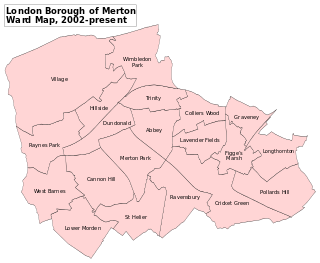
Merton London Borough Council in London, England is elected every four years; it has administrative control over the London Borough of Merton.
This article documents the strengths of political parties in the 333 local authorities of England, 32 local authorities of Scotland, 22 principal councils of Wales and 11 local councils of Northern Ireland.
The 2010 Barnet Council election took place on 6 May 2010 to elect members of Barnet London Borough Council in London, England. The whole council was up for election and the Conservative party stayed in overall control of the council.
The 2010 Solihull Metropolitan Borough Council election took place on 6 May 2010 to elect members of Solihull Metropolitan Borough Council in the West Midlands, England. One third of the council was up for election and the council stayed under no overall control.
Elections for the London Borough of Merton were held on 3 May 1990 to elect members of Merton London Borough Council in London, England. This was on the same day as other local elections in England and Scotland.
The 2015 Epsom and Ewell Council election took place on 7 May 2015 to elect members of Epsom and Ewell Council in England as one of the 2015 United Kingdom local elections and coinciding with the general election leading to a higher turnout than when local elections are held in a non-general election year.
Residents for Uttlesford (R4U) is a localist political party in the United Kingdom. The party was launched in 2014, and formed from a number of residents groups in the area. The party is based in the Uttlesford administrative district in Essex and promotes a localist agenda that seeks to give residents a greater say in the future of their district. Residents for Uttlesford has elected representation at multiple levels of local government: Uttlesford District Council, Essex County Council and various town and parish councils, including the councils for both towns in Uttlesford, Saffron Walden and Great Dunmow.
The West Ewell and Ruxley Residents Association (WERRA) was formed in 1956 to give local people an independent voice about their area. It is one of 11 independent Residents Associations (RAs) that form the Residents Associations of Epsom and Ewell.
The 2019 Guildford Borough Council election were held on 2 May 2019, to elect all 48 seats to the Guildford Borough Council in Surrey, England as part of the 2019 local elections.
Ratepayers' Association in the United Kingdom and other countries is a name used by a political party or electoral alliance contesting a local election to represent the interests of those who pay rates to the municipal government. In Canada a ratepayers' association is the same thing as a neighbourhood association.
The 2021 Surrey County Council election took place alongside other English and Welsh local elections. Councillors were elected for all 81 single-member electoral divisions of Surrey County Council for a four-year term. The electoral system used was first-past-the-post voting.
The 2022 Havering London Borough Council election is currently taking place as of 5 May 2022. All 55 members of Havering London Borough Council will be elected. The elections will take place alongside local elections in the other London boroughs and elections to local authorities across the United Kingdom.