| |||||||||||||||||||||||||||||
16 out of 48 seats to Elmbridge Borough Council 25 seats needed for a majority | |||||||||||||||||||||||||||||
---|---|---|---|---|---|---|---|---|---|---|---|---|---|---|---|---|---|---|---|---|---|---|---|---|---|---|---|---|---|
| |||||||||||||||||||||||||||||
Winner of each seat at the 2023 Elmbridge Borough Council election | |||||||||||||||||||||||||||||
The 2023 Elmbridge Borough Council election was held on 4 May 2023 to elect members of Elmbridge Borough Council in Surrey, England. [1] This was on the same day as other local elections across England. There were 16 out of 48 seats contested, being the usual third of the council.
Prior to the election the council the council was under no overall control; the Conservatives were the largest party but the council was being run by a coalition of the Residents Associations and the Liberal Democrats, led by Chris Sadler of the Residents Associations. The Conservatives lost the majority of the seats they were defending, mainly to the Liberal Democrats who became the largest party. [2] [3] The Liberal Democrats and Residents Associations continued their coalition after the election, but with Liberal Democrat group leader Bruce McDonald taking over as leader of the council. [4]
2023 Elmbridge Borough Council election [2] | ||||||||||
---|---|---|---|---|---|---|---|---|---|---|
Party | This election | Full council | This election | |||||||
Seats | Net | Seats % | Other | Total | Total % | Votes | Votes % | +/− | ||
Liberal Democrats | 9 | +6 | 56.3 | 10 | 19 | 39.6 | 15,560 | 38.9 | ||
Conservative | 2 | -4 | 12.5 | 10 | 12 | 25 | 13,139 | 32.8 | ||
Residents | 5 | -2 | 31.3 | 11 | 17 | 35.4 | 8,384 | 21.0 | ||
Labour | 0 | 0 | 0 | 0 | 0.0 | 2,586 | 6.5 | |||
Heritage | 0 | 0 | 0 | 0 | 0.0 | 174 | 0.4 | |||
Reform UK | 0 | 0 | 0 | 0 | 0.0 | 101 | 0.3 | |||
UKIP | 0 | 0 | 0 | 0 | 0.0 | 55 | 0.1 | |||
Candidates seeking re-election are marked with an asterisk (*). [5] [6]
Party | Candidate | Votes | % | ±% | |
---|---|---|---|---|---|
Liberal Democrats | Alex Coomes* | 1,732 | 70.1 | +5.8 | |
Conservative | John Burns | 631 | 25.6 | -3.3 | |
Labour | Sue Cope | 106 | 4.3 | N/A | |
Majority | 1,101 | 44.5 | |||
Turnout | 2,469 | 44.5 | |||
Liberal Democrats hold | Swing | ||||
Party | Candidate | Votes | % | ±% | |
---|---|---|---|---|---|
Liberal Democrats | Robin Stephens* | 1,252 | 49.2 | +1.2 | |
Conservative | Katerina Lusk Posledni | 1,098 | 43.1 | -4.4 | |
Labour | Carolyn Gray | 116 | 4.6 | +0.1 | |
Reform UK | Elaine Kingston | 57 | 2.2 | N/A | |
Heritage | Paul Van Der Hagen | 23 | 0.9 | N/A | |
Majority | 154 | 6.1 | |||
Turnout | 2,546 | 39.2 | |||
Liberal Democrats gain from Conservative | Swing | ||||
Robin Stephens had won the seat from the Conservatives in a by-election in 2021. Seat shown as a Liberal Democrat gain from Conservatives to allow comparison with 2019 results.
Party | Candidate | Votes | % | ±% | |
---|---|---|---|---|---|
Residents | Richard Williams* | 1,301 | 51.3 | +5.5 | |
Conservative | Amanda Manship | 989 | 39.0 | +0.5 | |
Labour | Richard Bennett | 247 | 9.7 | +2.2 | |
Majority | 312 | 12.3 | |||
Turnout | 2,537 | 38.6 | |||
Residents hold | Swing | ||||
Party | Candidate | Votes | % | ±% | |
---|---|---|---|---|---|
Liberal Democrats | Paul Hughes | 1,300 | 46.6 | +1.5 | |
Conservative | Mary Sheldon* | 1,236 | 44.3 | ±0.0 | |
Labour | Susan Dennis | 251 | 9.0 | -1.5 | |
Majority | 64 | 2.3 | |||
Turnout | 2,787 | 41.8 | |||
Liberal Democrats gain from Conservative | Swing | ||||
Party | Candidate | Votes | % | ±% | |
---|---|---|---|---|---|
Residents | Janet Turner* | 1,603 | 61.9 | -2.2 | |
Liberal Democrats | Liz Ambekar | 518 | 20.0 | -2.6 | |
Conservative | Caroline Kim | 384 | 14.8 | +1.5 | |
Labour | Rachelle Headland | 84 | 3.2 | N/A | |
Majority | 1,085 | 41.9 | |||
Turnout | 2,589 | 40.3 | |||
Residents hold | Swing | ||||
Party | Candidate | Votes | % | ±% | |
---|---|---|---|---|---|
Liberal Democrats | Neil Houston* | 1,471 | 70.6 | -2.9 | |
Conservative | Blake Coe | 471 | 22.6 | -3.9 | |
Labour | Ahmad Ali | 141 | 6.8 | N/A | |
Majority | 1,000 | 48.0 | |||
Turnout | 2,083 | 39.6 | |||
Liberal Democrats hold | Swing | ||||
Neil Houston had been elected in 2019 as a Liberal Democrat, left the party to sit as an independent during 2021 but returned to the party shortly before the election in 2023. [7]
Party | Candidate | Votes | % | ±% | |
---|---|---|---|---|---|
Liberal Democrats | Richard Flatau | 1,236 | 42.6 | +6.4 | |
Residents | Pat Gormley | 920 | 31.7 | +11.1 | |
Conservative | Chen Zhao | 615 | 21.2 | -15.2 | |
Labour | Rosie Rendall | 129 | 4.4 | +1.4 | |
Majority | 316 | 10.9 | |||
Turnout | 2,900 | 43.0 | |||
Liberal Democrats gain from Residents | Swing | ||||
Party | Candidate | Votes | % | ±% | |
---|---|---|---|---|---|
Residents | Tony Popham* | 927 | 43.0 | +0.3 | |
Liberal Democrats | Paul Nagle | 701 | 32.5 | +9.5 | |
Conservative | Agnes Fuchs | 384 | 17.8 | -6.9 | |
Labour | Jamal Ajjane | 143 | 6.6 | -3.0 | |
Majority | 226 | 10.5 | |||
Turnout | 2,155 | 32.8 | |||
Residents hold | Swing | ||||
Party | Candidate | Votes | % | ±% | |
---|---|---|---|---|---|
Conservative | Hilary Butler* | 1,290 | 51.3 | +1.2 | |
Liberal Democrats | Nicholas Davis | 1,014 | 40.3 | -2.4 | |
Labour | Angus Rendall | 157 | 6.2 | -1.0 | |
UKIP | Nicholas Wood | 55 | 2.2 | N/A | |
Majority | 276 | 11.0 | |||
Turnout | 2,516 | 42.1 | |||
Conservative hold | Swing | ||||
Party | Candidate | Votes | % | ±% | |
---|---|---|---|---|---|
Conservative | Corinne Sterry | 1,573 | 60.5 | +4.1 | |
Liberal Democrats | Sue Grose | 898 | 34.6 | -9.0 | |
Labour | Steven Gray | 69 | 2.7 | N/A | |
Heritage | Gaynor Van Der Hagen | 59 | 2.3 | N/A | |
Majority | 675 | 25.9 | |||
Turnout | 2,599 | 38.9 | |||
Conservative hold | Swing | ||||
Party | Candidate | Votes | % | ±% | |
---|---|---|---|---|---|
Residents | Elaine Sesemann | 1,563 | 58.2 | -1.1 | |
Liberal Democrats | David Gattey | 643 | 24.0 | -3.3 | |
Conservative | Yanik Gammampila | 307 | 11.4 | -2.0 | |
Labour | Richard Lewis | 127 | 4.7 | N/A | |
Reform UK | Nick Denton | 44 | 1.6 | N/A | |
Majority | 920 | 34.2 | |||
Turnout | 2,684 | 40.5 | |||
Residents hold | Swing | ||||
Party | Candidate | Votes | % | ±% | |
---|---|---|---|---|---|
Liberal Democrats | Gregor MacGregor | 1,028 | 39.5 | +15.1 | |
Residents | Andrew Kelly | 926 | 35.6 | +4.1 | |
Conservative | Lloyd Soldatt | 510 | 19.6 | -6.8 | |
Labour | Asieh Ahmadzade | 138 | 5.3 | -1.8 | |
Majority | 102 | 3.9 | |||
Turnout | 2,602 | 42.2 | |||
Liberal Democrats gain from Residents | Swing | ||||
Party | Candidate | Votes | % | ±% | |
---|---|---|---|---|---|
Liberal Democrats | Clare Bailey | 1,197 | 55.1 | -0.6 | |
Conservative | Aliscia Butler | 779 | 35.9 | +1.0 | |
Labour | Fatima Kamara | 195 | 9.0 | -0.4 | |
Majority | 418 | 19.2 | |||
Turnout | 2,171 | 35.9 | |||
Liberal Democrats gain from Conservative | Swing | ||||
Party | Candidate | Votes | % | ±% | |
---|---|---|---|---|---|
Liberal Democrats | Catherine Glass | 1,476 | 50.1 | -5.1 | |
Conservative | Ellie Ioannou | 1,210 | 41.1 | +3.1 | |
Labour | Kelly Haines | 169 | 5.7 | +1.2 | |
Heritage | Charlie Garrod | 92 | 3.1 | +0.8 | |
Majority | 266 | 9.0 | |||
Turnout | 2,947 | 43.0 | |||
Liberal Democrats gain from Conservative | Swing | ||||
Party | Candidate | Votes | % | ±% | |
---|---|---|---|---|---|
Liberal Democrats | Ashley Tilling* | 1,094 | 52.9 | +0.5 | |
Conservative | Freddie Tshiaba Mbuyi Kawaya | 754 | 36.5 | -2.6 | |
Labour Co-op | Helen Pilmer | 220 | 10.6 | +2.1 | |
Majority | 340 | 16.4 | |||
Turnout | 2,068 | 35.1 | |||
Liberal Democrats hold | Swing | ||||
Party | Candidate | Votes | % | ±% | |
---|---|---|---|---|---|
Residents | Pippa Graeme | 1,144 | 48.8 | +12.9 | |
Conservative | Colin McFarlane | 908 | 38.7 | -12.8 | |
Labour Co-op | Gary Dean | 294 | 12.5 | -0.1 | |
Majority | 236 | 10.1 | |||
Turnout | 2,346 | 36.5 | |||
Residents hold | Swing | ||||
Party | Candidate | Votes | % | ±% | |
---|---|---|---|---|---|
Liberal Democrats | Kevin Whincup | 694 | 36.1 | -6.5 | |
Conservative | Freddie Ingle | 627 | 32.6 | +11.4 | |
Residents | Pat Gormley | 523 | 27.2 | -4.5 | |
Green | Andrew Dillon | 77 | 4.0 | New | |
Majority | 67 | 3.5 | -7.4 | ||
Turnout | 1,921 | 28.1 | -14.9 | ||
Registered electors | 6,844 | ||||
Liberal Democrats gain from Residents |
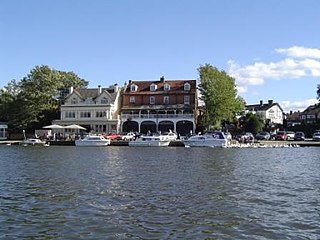
Elmbridge is a local government district with borough status in Surrey, England. Its council is based in Esher, and other notable towns and villages include Cobham, Walton-on-Thames, Weybridge and Molesey. The borough lies just outside the administrative boundary of Greater London, but is mostly within the M25 motorway which encircles London. Many of the borough's urban areas form part of the wider Greater London Built-up Area.
The Borough of Guildford is a local government district with borough status in Surrey, England. With around half of the borough's population, Guildford is its largest settlement and only town, and is where the council is based.
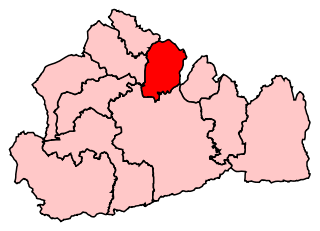
Runnymede and Weybridge is a constituency in Surrey represented in the House of Commons of the UK Parliament since 2019 by Ben Spencer, a Conservative.
Wimbledon is a constituency in Greater London represented in the House of Commons of the UK Parliament. Since 2005, the seat has been held by Stephen Hammond of the Conservative Party.
Esher and Walton is a constituency in Surrey represented in the House of Commons of the UK Parliament. Since 2010, it has been represented by Dominic Raab of the Conservative Party, who served as deputy prime minister before resigning from that role in April 2023 due to bullying allegations. In May he announced he would be standing down as an MP at the next general election.
In the context of local authorities in the United Kingdom, no overall control is a situation in which no single political group achieves a majority of seats, analogous to a hung parliament. Of the 248 councils who had members up for election in the 2019 local elections, 73 resulted in a NOC administration. In the 2021 election, 14 resulted in no overall control. The term can still be used for several other countries, such as for two local councils of Malta and the General Assembly of Budapest in Hungary.
The 2010 Solihull Metropolitan Borough Council election took place on 6 May 2010 to elect members of Solihull Metropolitan Borough Council in the West Midlands, England. One third of the council was up for election and the council stayed under no overall control.
The 2010 Woking Council election took place on 6 May 2010, on the same day as the 2010 general election, to elect members of Woking Borough Council in Surrey, England. One third of the council was up for election and the council stayed under no overall control.
Elections to Elmbridge Borough Council to elect one third of its council were held on 22 May 2014, the date of the 2014 United Kingdom local elections.
The 2000 Colchester Borough Council election took place on 4 May 2000 to elect members of Colchester Borough Council in Essex, England. One third of the council was up for election and the council stayed under no overall control.
The 2006 Brent London Borough Council election took place on 4 May 2006 to elect members of Brent London Borough Council in London, England. The whole council was up for election and the Labour Party lost overall control of the council to no overall control.
The by-thirds 2015 Elmbridge Borough Council election took place on 7 May 2015 to elect members of Elmbridge Borough Council in England. This was on the same day as other local elections.
The 2019 Guildford Borough Council election were held on 2 May 2019, to elect all 48 seats to the Guildford Borough Council in Surrey, England as part of the 2019 local elections.
The 2019 Waverley Borough Council election took place on 2 May 2019 to elect members of Waverley Borough Council in England as one of the 2019 local elections.
The 2019 Spelthorne Borough Council election took place on 2 May 2019 to elect all members of Spelthorne Borough Council in England. The Conservatives retained control of the council, but with a reduced majority of 7, down from 31.
The 2021 Surrey County Council election took place alongside other English and Welsh local elections. Councillors were elected for all 81 single-member electoral divisions of Surrey County Council for a four-year term. The electoral system used was first-past-the-post voting.
The 2022 Havering London Borough Council election was held on 5 May 2022 to elect all 55 members of Havering London Borough Council. The elections took place alongside local elections in the other London boroughs and elections to local authorities across the United Kingdom.
The 2023 Guildford Borough Council election was held on 4 May 2023, to elect all 48 seats to the Guildford Borough Council in Surrey, England as part of the 2023 local elections. The results saw the Liberal Democrat take overall control of Guildford Borough Council.
Elections to Colchester Borough Council took place on 5 May 2022. Eighteen members of the council were elected: one from 16 of the 17 wards, and two councillors from New Town & Christ Church ward, following the death of incumbent councillor Nick Cope, elected in 2019 and due to serve until 2023.
The 2023 Redcar and Cleveland Borough Council election took place on 4 May 2023 to elect members of Redcar and Cleveland Borough Council in England. This was on the same day as other local elections in England. All 59 seats were up for election. Redcar and Cleveland Borough Council's elections are held every four years.