| ||||||||||||||||||||||||||||||||||||||||||||||||||||||||||||||||||||||||||||||||
27 out of 78 seats to Newcastle City Council 40 seats needed for a majority | ||||||||||||||||||||||||||||||||||||||||||||||||||||||||||||||||||||||||||||||||
---|---|---|---|---|---|---|---|---|---|---|---|---|---|---|---|---|---|---|---|---|---|---|---|---|---|---|---|---|---|---|---|---|---|---|---|---|---|---|---|---|---|---|---|---|---|---|---|---|---|---|---|---|---|---|---|---|---|---|---|---|---|---|---|---|---|---|---|---|---|---|---|---|---|---|---|---|---|---|---|---|
| ||||||||||||||||||||||||||||||||||||||||||||||||||||||||||||||||||||||||||||||||
Winner of each seat at the 2023 Newcastle City Council election | ||||||||||||||||||||||||||||||||||||||||||||||||||||||||||||||||||||||||||||||||
|
The 2023 Newcastle City Council election took place on 4 May 2023 to elect one third of the members of Newcastle City Council in Tyne & Wear, England. [1] This was on the same day as other local elections in England and Wales.
There were 27 of the 78 seats on the council up for election, being the usual third of the council plus a by-election in the North Jesmond ward. The result saw the Labour Party lose three seats with the Liberal Democrats and Newcastle Independents making gains. Labour retained its majority on the council. [2] [3]
Newcastle is a strong council for the Labour Party. Labour controlled the council from its creation in 1973 until 2004, when the Liberal Democrats won a majority on the council. [4] Labour retook control in 2011, [5] and have maintained a majority at every subsequent election.
Until 2022, the Labour council was led by Nick Forbes, who was also the Leader of the Labour group of the Local Government Association. The election marked the end of the first year of Nick Kemp's leadership of Newcastle City Council and as leader of the Labour group.
The seats up for election in 2023 were last contested in 2019.
This was the first election for Colin Ferguson as leader of the Liberal Democrats group, who took over from Nick Cott, and Tracey Mitchell as leader of the Newcastle Independents, [6] who had taken over from Jason Smith.
Despite losing three seats, the council remained under Labour majority control. Labour made a net loss of three seats.
Five seats changed hands at this election. The Liberal Democrats gained seats in North Jesmond and West Fenham from Labour. The Newcastle Independents gained two seats from Labour, the Denton and Westerhope ward and the Lemington ward. Despite losing three seats elsewhere on the council, Labour took the seat of Callerton and Throckley from the Newcastle Independents.
Nick Kemp faced a challenge for the council leadership from fellow Labour councillor Ged Bell, who had. Bell had served as a councillor since 1996 and was a member of the council's cabinet under Nick Forbes. [7] This challenge was withdrawn, however, leaving Kemp to return unopposed as leader of the Labour group.
2023 Newcastle City Council election | ||||||||||
---|---|---|---|---|---|---|---|---|---|---|
Party | This election | Full council | This election | |||||||
Seats | Net | Seats % | Other | Total | Total % | Votes | Votes % | +/− | ||
Labour | 14 | 3 | 51.9 | 34 | 48 | 61.5 | 27,688 | 41.9 | -2.3 | |
Liberal Democrats | 10 | 2 | 37.0 | 13 | 23 | 29.5 | 18,417 | 27.8 | +4.4 | |
Newcastle Ind. | 2 | 1 | 7.4 | 2 | 4 | 5.1 | 3,139 | 4.7 | -1.0 | |
Independent | 1 | 3.7 | 2 | 3 | 3.8 | 2,766 | 4.2 | -0.7 | ||
Conservative | 0 | 0.0 | 0 | 0 | 0.0 | 7,651 | 11.6 | -1.9 | ||
Green | 0 | 0.0 | 0 | 0 | 0.0 | 6,025 | 9.1 | +1.3 | ||
Freedom Alliance | 0 | 0.0 | 0 | 0 | 0.0 | 235 | 0.4 | +0.3 | ||
SDP | 0 | 0.0 | 0 | 0 | 0.0 | 85 | 0.1 | N/A | ||
TUSC | 0 | 0.0 | 0 | 0 | 0.0 | 71 | 0.1 | N/A | ||
Communist | 0 | 0.0 | 0 | 0 | 0.0 | 65 | 0.1 | ±0.0 |
The Statement of Persons Nominated, which details the candidates standing in each ward, was released by Newcastle City Council following the close of nominations on 4 April 2023. [8]
Party | Candidate | Votes | % | ±% | |
---|---|---|---|---|---|
Labour Co-op | Joanne Kingsland* | 833 | 69.1 | −0.9 | |
Green | Katie Fletcher | 208 | 17.2 | +7.3 | |
Conservative | Fahim Habibi | 107 | 8.9 | +1.5 | |
Liberal Democrats | Tahir Siddique | 58 | 4.8 | +0.7 | |
Majority | 625 | 51.8 | 8.3 | ||
Turnout | 1,206 | 23.5 | 6.0 | ||
Registered electors | 5,128 | ||||
Labour hold | Swing | 4.1 |
Party | Candidate | Votes | % | ±% | |
---|---|---|---|---|---|
Labour | Susan Anthony* | 1,636 | 65.0 | +14.5 | |
Conservative | Jamie Kelly | 475 | 18.9 | +9.7 | |
Liberal Democrats | Hans Christian Anderson | 217 | 8.6 | +3.4 | |
Green | Lee Irving | 189 | 7.5 | +2.5 | |
Majority | 1,161 | 46.1 | 12.8 | ||
Turnout | 2,517 | 31.2 | 1.8 | ||
Registered electors | 8,079 | ||||
Labour hold | Swing | 2.4 |
Party | Candidate | Votes | % | ±% | |
---|---|---|---|---|---|
Labour Co-op | Linda Hobson* | 1,069 | 59.7 | +8.7 | |
Newcastle Ind. | Sarah Armstrong | 295 | 16.5 | New | |
Conservative | Lucy Howie | 224 | 12.5 | +3.1 | |
Liberal Democrats | Bill Shepherd | 121 | 6.8 | −5.6 | |
Green | Jessica Whitaker | 82 | 4.6 | −1.8 | |
Majority | 774 | 43.2 | 13.1 | ||
Turnout | 1,791 | 26.1 | 1.6 | ||
Registered electors | 6,852 | ||||
Labour hold | Swing | 3.9 |
Party | Candidate | Votes | % | ±% | |
---|---|---|---|---|---|
Labour | Nicholas Kemp* | 885 | 49.4 | −5.3 | |
Green | Nick Hartley | 675 | 37.7 | +28.1 | |
Conservative | Jamie Hampton | 127 | 7.1 | +2.0 | |
Liberal Democrats | Mark Ridyard | 105 | 5.9 | +1.8 | |
Majority | 210 | 11.7 | 26.3 | ||
Turnout | 1,792 | 27.0 | 4.5 | ||
Registered electors | 6,644 | ||||
Labour hold | Swing | 16.7 |
Party | Candidate | Votes | % | ±% | |
---|---|---|---|---|---|
Labour | Adam Walker | 1,080 | 41.7 | +12.4 | |
Newcastle Ind. | John Gordon | 541 | 20.9 | −13.2 | |
Conservative | John Dobie | 481 | 18.6 | +2.9 | |
Green | Idwal John | 319 | 12.3 | +0.6 | |
Liberal Democrats | Richard Morris | 169 | 6.5 | −2.8 | |
Majority | 539 | 20.8 | 16.0 | ||
Turnout | 2,590 | 30.6 | 2.8 | ||
Registered electors | 8,470 | ||||
Labour gain from Newcastle Ind. | Swing | 12.8 |
Party | Candidate | Votes | % | ±% | |
---|---|---|---|---|---|
Liberal Democrats | Ali Avaei* | 1,369 | 43.2 | +9.1 | |
Labour Co-op | Andrew Herridge | 1,175 | 37.1 | +7.4 | |
Conservative | Joshua Clark | 406 | 12.8 | +0.4 | |
Green | Andrew Thorp | 220 | 6.9 | +1.0 | |
Majority | 194 | 6.1 | 1.7 | ||
Turnout | 3,170 | 29.5 | 7.1 | ||
Registered electors | 10,750 | ||||
Liberal Democrats hold | Swing | 0.9 |
Party | Candidate | Votes | % | ±% | |
---|---|---|---|---|---|
Independent | Margaret Donnelly | 2,766 | 78.8 | +5.9 | |
Labour Co-op | Milo Jasper Barnett | 419 | 11.9 | −3.6 | |
Conservative | Ian Forster | 203 | 5.8 | −3.7 | |
Green | James Milne | 62 | 1.8 | New | |
Liberal Democrats | Judith Steen | 60 | 1.7 | −0.5 | |
Majority | 2,347 | 66.9 | 15.9 | ||
Turnout | 3,510 | 46.8 | 1.3 | ||
Registered electors | 7,499 | ||||
Independent hold | Swing | 4.8 |
Party | Candidate | Votes | % | ±% | |
---|---|---|---|---|---|
Liberal Democrats | Henry Gallagher* | 1,659 | 48.2 | +3.4 | |
Labour | Christopher Bartlett | 1,221 | 35.5 | +7.5 | |
Green | Robert Taylor | 298 | 8.7 | −4.9 | |
Conservative | Gerry Langley | 262 | 7.6 | 0 | |
Majority | 438 | 12.7 | 4.2 | ||
Turnout | 3,440 | 46.9 | 3.0 | ||
Registered electors | 7,333 | ||||
Liberal Democrats hold | Swing | 2.1 |
Party | Candidate | Votes | % | ±% | |
---|---|---|---|---|---|
Newcastle Ind. | Adam Mitchell | 1,226 | 45.4 | +13.3 | |
Labour | Bill Purvis | 1,093 | 40.5 | +4.1 | |
Conservative | Alexis Fernandes | 187 | 6.9 | +0.2 | |
Liberal Democrats | Libby Dicken | 109 | 4.0 | +1.0 | |
Green | Cécile Renaud-Glorieux | 83 | 3.1 | New | |
Majority | 133 | 4.9 | 0.7 | ||
Turnout | 2,698 | 31.7 | 1.9 | ||
Registered electors | 8,504 | ||||
Newcastle Ind. gain from Labour | Swing | 4.6 |
Party | Candidate | Votes | % | ±% | |
---|---|---|---|---|---|
Labour | Habib Rahman* | 1,383 | 71.8 | −0.2 | |
Green | Peter Thomson | 271 | 14.1 | +2.8 | |
Conservative | Saamiya Malik | 181 | 9.4 | 0 | |
Liberal Democrats | Hamed Aghajani | 90 | 4.7 | −2.6 | |
Majority | 1,112 | 57.8 | 3.0 | ||
Turnout | 1,925 | 25.2 | 7.5 | ||
Registered electors | 7,635 | ||||
Labour hold | Swing | 1.5 |
Party | Candidate | Votes | % | ±% | |
---|---|---|---|---|---|
Liberal Democrats | Peter Lovatt* | 1,673 | 58.5 | +0.2 | |
Labour Co-op | Ava Rowell | 688 | 24.1 | +1.7 | |
Conservative | Stephen Axford | 295 | 10.3 | +0.7 | |
Green | Roger Whittaker | 204 | 7.1 | −2.6 | |
Majority | 985 | 34.4 | 1.6 | ||
Turnout | 2,860 | 38.9 | 0.1 | ||
Registered electors | 7,351 | ||||
Liberal Democrats hold | Swing | 0.8 |
Party | Candidate | Votes | % | ±% | |
---|---|---|---|---|---|
Liberal Democrats | Tom Woodwark* | 1,565 | 39.0 | −1.6 | |
Conservative | Doc Anand | 1,334 | 33.3 | +7.0 | |
Labour | Nick Arnold | 875 | 21.8 | +1.9 | |
Green | Anna Foster | 237 | 5.9 | −7.2 | |
Majority | 231 | 5.8 | 8.6 | ||
Turnout | 4,011 | 52.8 | 1.5 | ||
Registered electors | 7,596 | ||||
Liberal Democrats hold | Swing | 4.3 |
Party | Candidate | Votes | % | ±% | |
---|---|---|---|---|---|
Labour | Mehrban Sadiq | 1,384 | 49.0 | +2.7 | |
Green | Andrew Gray | 625 | 22.1 | −5.6 | |
Liberal Democrats | Tom Appleby | 595 | 21.1 | +3.4 | |
Conservative | Shah Ali | 156 | 5.5 | −2.8 | |
Communist | Steve Handford | 65 | 2.3 | New | |
Majority | 759 | 26.9 | 8.3 | ||
Turnout | 2,825 | 39.4 | 1.9 | ||
Registered electors | 7,171 | ||||
Labour hold | Swing | 4.2 |
Party | Candidate | Votes | % | ±% | |
---|---|---|---|---|---|
Labour Co-op | Paula Maines | 1,337 | 55.1 | +6.6 | |
Liberal Democrats | Robert Austin | 562 | 23.2 | −1.1 | |
Conservative | Zak Mudie | 270 | 11.1 | −5.7 | |
Green | Adam Jackson | 185 | 7.6 | New | |
TUSC | Nicholas Fray | 71 | 2.9 | −7.5 | |
Majority | 775 | 32.0 | 7.8 | ||
Turnout | 2,425 | 33.2 | 1.6 | ||
Registered electors | 7,313 | ||||
Labour hold | Swing | 3.9 |
Party | Candidate | Votes | % | ±% | |
---|---|---|---|---|---|
Labour | Jacqui Robinson* | 1,377 | 66.8 | +10.6 | |
Conservative | James Mark | 321 | 15.6 | −13.7 | |
Liberal Democrats | Aidan King | 249 | 12.1 | −2.4 | |
Green | Tristan Gilet | 113 | 5.5 | New | |
Majority | 1,056 | 51.3 | 24.3 | ||
Turnout | 2,060 | 29.6 | 1.2 | ||
Registered electors | 6,957 | ||||
Labour hold | Swing | 12.2 |
Party | Candidate | Votes | % | ±% | |
---|---|---|---|---|---|
Newcastle Ind. | Nix Joanne | 1,077 | 45.9 | +8.7 | |
Labour Co-op | Stephen Barry-Stanners | 918 | 39.1 | −2.5 | |
Conservative | Joel Bland | 195 | 8.3 | −2.2 | |
Liberal Democrats | Robert Petrie | 80 | 3.4 | −1.9 | |
Green | Hilda Frost | 76 | 3.2 | −2.1 | |
Majority | 159 | 6.8 | 2.4 | ||
Turnout | 2,346 | 33.0 | 1.1 | ||
Registered electors | 7,111 | ||||
Newcastle Ind. gain from Labour | Swing | 5.6 |
Party | Candidate | Votes | % | ±% | |
---|---|---|---|---|---|
Liberal Democrats | Deborah Burns | 1,573 | 53.6 | −3.4 | |
Labour | Carly Walker-Dawson | 859 | 29.3 | −3.7 | |
Conservative | Beth Spurr | 260 | 8.9 | −1.2 | |
Green | Michael Rabley | 242 | 8.2 | New | |
Majority | 714 | 24.3 | 0.3 | ||
Turnout | 2,934 | 41.2 | 0.6 | ||
Registered electors | 7,117 | ||||
Liberal Democrats hold | Swing | 0.2 |
Party | Candidate | Votes | % | ±% | |
---|---|---|---|---|---|
Labour | Teresa Cairns* | 751 | 63.2 | +17.3 | |
Green | James Vesty | 205 | 17.0 | −8.7 | |
Conservative | Aaron Whelan-Harvey | 133 | 11.2 | −1.1 | |
Liberal Democrats | David Partington | 102 | 8.6 | −7.5 | |
Majority | 546 | 45.8 | 24.8 | ||
Turnout | 1,191 | 23.7 | 5.5 | ||
Registered electors | 5,029 | ||||
Labour hold | Swing | 13.0 |
Party | Candidate | Votes | % | ±% | |
---|---|---|---|---|---|
Liberal Democrats | Gerry Keating* | 1,322 | 65.1 | +23.8 | |
Liberal Democrats | Philip Browne | 1,276 | 62.8 | +21.5 | |
Labour Co-op | Oskar Avery | 567 | 27.9 | −15.3 | |
Labour Co-op | Michael Bell | 512 | 25.2 | −18.1 | |
Green | Shehla Naqvi | 179 | 8.8 | +1.4 | |
Green | Tim Dowson | 135 | 6.6 | −0.8 | |
Conservative | Stephen Dawes | 79 | 3.9 | −2.8 | |
Conservative | Genna Brown | 73 | 3.6 | −3.1 | |
Majority | 755 | 37.2 | 15.5 | ||
Majority | 764 | 37.6 | 35.7 | ||
Turnout | 2,032 | 47.6 | 2.5 | ||
Turnout | 2,032 | 47.6 | 12.2 | ||
Registered electors | 4,433 | ||||
Liberal Democrats hold | Swing | 20.0 | |||
Liberal Democrats gain from Labour | Swing | 19.8 |
Party | Candidate | Votes | % | ±% | |
---|---|---|---|---|---|
Liberal Democrats | Gareth Kane* | 931 | 49.7 | ±0.0 | |
Labour | Asad Syed | 705 | 37.7 | +0.1 | |
Green | Phill James | 187 | 10.0 | +0.5 | |
Conservative | Marie Summersby | 49 | 2.6 | −0.6 | |
Majority | 226 | 12.1 | Even | ||
Turnout | 1,872 | 37.6 | 6.4 | ||
Registered electors | 4,976 | ||||
Liberal Democrats hold | Swing | 0.1 |
Party | Candidate | Votes | % | ±% | |
---|---|---|---|---|---|
Liberal Democrats | Christine Morrissey* | 2,143 | 54.2 | +13.1 | |
Labour | Matthew Hill | 895 | 22.6 | +5.7 | |
Conservative | Andrew Burnett | 536 | 13.6 | −6.2 | |
Green | Audrey MacNaughton | 378 | 9.6 | +0.6 | |
Majority | 1,248 | 31.6 | 11.4 | ||
Turnout | 3,952 | 44.8 | 3.0 | ||
Registered electors | 8,824 | ||||
Liberal Democrats hold | Swing | 3.7 |
Party | Candidate | Votes | % | ±% | |
---|---|---|---|---|---|
Labour | Lesley Storey* | 828 | 45.5 | +8.6 | |
Liberal Democrats | Fiona Punchard | 476 | 26.2 | +6.6 | |
Green | Alistair Ford | 250 | 13.8 | −12.9 | |
Conservative | Elias al Dahan | 179 | 9.8 | −5.7 | |
SDP | Martin Evison | 85 | 4.7 | +3.4 | |
Majority | 352 | 19.4 | 9.1 | ||
Turnout | 1,818 | 36.5 | 3.1 | ||
Registered electors | 4,975 | ||||
Labour hold | Swing | 1.0 |
Party | Candidate | Votes | % | ±% | |
---|---|---|---|---|---|
Labour | Margaret Wood* | 1,224 | 70.3 | +16.9 | |
Conservative | Alex Walker | 229 | 13.2 | +5.8 | |
Liberal Democrats | Stephen Psallidas | 100 | 5.7 | −1.3 | |
Green | Tom Whatson | 95 | 5.5 | New | |
Freedom Alliance | Steve Fish | 92 | 5.3 | New | |
Majority | 995 | 57.2 | 35.8 | ||
Turnout | 1,740 | 24.7 | 4.5 | ||
Registered electors | 7,039 | ||||
Labour hold | Swing | 5.6 |
Party | Candidate | Votes | % | ±% | |
---|---|---|---|---|---|
Labour | Paul Frew* | 1,571 | 59.6 | +15.6 | |
Liberal Democrats | Deborah Gallagher | 433 | 16.4 | +1.4 | |
Conservative | Stephen Oxborough | 331 | 12.5 | +3.0 | |
Green | Doug Paterson | 160 | 6.1 | −0.2 | |
Freedom Alliance | Julie Fish | 143 | 5.4 | New | |
Majority | 1,138 | 43.1 | 23.7 | ||
Turnout | 2,638 | 31.8 | 1.8 | ||
Registered electors | 8,293 | ||||
Labour hold | Swing | 7.1 |
Party | Candidate | Votes | % | ±% | |
---|---|---|---|---|---|
Liberal Democrats | P.J. Morrissey | 1,200 | 45.3 | +39.6 | |
Labour Co-op | Sylvia Copley* | 883 | 33.3 | −10.8 | |
Conservative | Raja Khan | 329 | 12.4 | +2.4 | |
Green | Tay Pitman | 237 | 8.9 | −2.3 | |
Majority | 317 | 12.0 | 11.2 | ||
Turnout | 2,649 | 36.6 | 4.0 | ||
Registered electors | 7,229 | ||||
Liberal Democrats gain from Labour | Swing | 25.2 |
Party | Candidate | Votes | % | ±% | |
---|---|---|---|---|---|
Labour Co-op | Rebecca Shatwell* | 1,520 | 67.3 | +11.4 | |
Green | John Pearson | 318 | 14.1 | +0.9 | |
Conservative | Jarred Riley | 229 | 10.6 | +0.5 | |
Liberal Democrats | Colin Steen | 180 | 8.0 | −3.9 | |
Majority | 1,202 | 53.3 | 10.5 | ||
Turnout | 2,257 | 31.4 | 5.9 | ||
Registered electors | 7,198 | ||||
Labour hold | Swing | 5.3 |
Newcastle upon Tyne Central was a constituency represented in the House of Commons of the UK Parliament from 2010 until its abolition for the 2024 general election by Chi Onwurah of the Labour Party. As with all constituencies since 1950, the constituency elected one Member of Parliament (MP) by the first past the post system of election at least every five years.
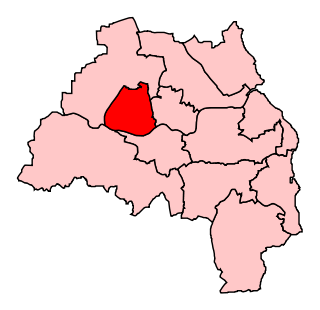
Newcastle upon Tyne North is a constituency represented in the House of Commons of the UK Parliament since 2010 by Catherine McKinnell of the Labour Party.
Newcastle City Council is the local authority for the city of Newcastle upon Tyne in the ceremonial county of Tyne and Wear in North East England. Newcastle has had a council from medieval times, which has been reformed on numerous occasions. Since 1974 the council has been a metropolitan borough council. In 2024 the council became a member of the North East Combined Authority. The council is based at Newcastle Civic Centre.
Newcastle upon Tyne East was a constituency of the House of Commons of the UK Parliament. It was held by Nick Brown, an independent formerly of the Labour Party, from its recreation in 2010 until its abolition for the 2024 general election.
The 2002 South Tyneside Metropolitan Borough Council election took place on 2 May 2002 to elect members of South Tyneside Metropolitan Borough Council in Tyne and Wear, England. One third of the council was up for election and the Labour Party kept overall control of the council.
The 2003 South Tyneside Metropolitan Borough Council election took place on 1 May 2003 to elect members of South Tyneside Metropolitan Borough Council in Tyne and Wear, England. One third of the council was up for election and the Labour Party kept overall control of the council.
The 2006 South Tyneside Metropolitan Borough Council election took place on 4 May 2006 to elect members of South Tyneside Metropolitan Borough Council in Tyne and Wear, England. One third of the council was up for election and the Labour Party stayed in overall control of the council.
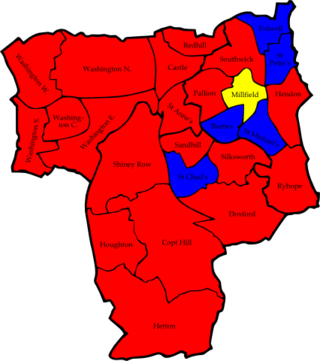
The 2006 Sunderland Council election took place on 4 May 2006 to elect members of Sunderland City Council in Tyne and Wear, England. One third of the Council was up for election and the Labour Party stayed in overall control.
The 2011 Sunderland Council election took place on 5 May 2011 to elect members of Sunderland Metropolitan Borough Council in Tyne and Wear, England. One third of the council was up for election and the Labour Party stayed in overall control of the council.
The 2015 Newcastle City Council Council election took place on 7 May 2015 to elect one third of the members of Newcastle City Council in England. The elections took place on the same day as other local elections.
The 2015 Cheshire West and Chester Council election took place on 7 May 2015, electing members of Cheshire West and Chester Council in England. This was on the same day as other local elections across the country as well as the general election.
The 2016 Newcastle City Council Council elections took place on 5 May 2016 to elect one third of the members of Newcastle City Council in England. The elections took place on the same day as other local elections.
Nicholas Ian Forbes is a British politician who served as the Leader of the Labour Group of the Local Government Association from 2016 to 2022. He was Leader of Newcastle City Council from 2011 to 2022. In 2020, Forbes was appointed to Labour Leader Keir Starmer's Shadow Cabinet, serving until 2022
The 2019 Newcastle City Council elections took place on 2 May 2019, on the same day as other local elections across the United Kingdom.
Newcastle Independents, formerly known as Newcastle First, is a localist political party based in Newcastle upon Tyne.
The 2021 Newcastle City Council election took place on 6 May 2021 to elect members of Newcastle City Council in England. This was on the same day as other local elections across the United Kingdom.
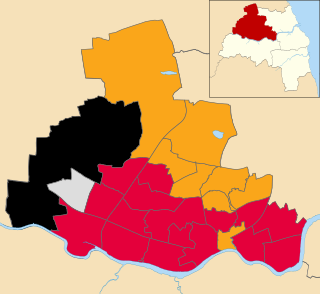
The 2022 Newcastle City Council election took place on 5 May 2022. One third of councillors — 26 out of 78 — on Newcastle City Council were elected. The election took place alongside other local elections across the United Kingdom.
Elections to Colchester Borough Council took place on 5 May 2022. Eighteen members of the council were elected: one from 16 of the 17 wards, and two councillors from New Town & Christ Church ward, following the death of incumbent councillor Nick Cope, elected in 2019 and due to serve until 2023.
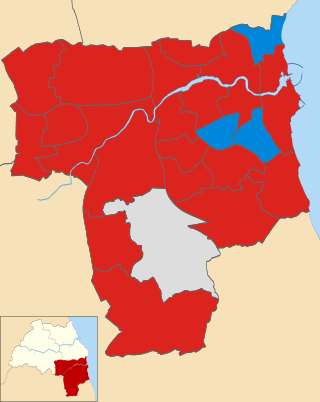
The 2024 Newcastle City Council election was held on Thursday 2 May 2024, to elect members of Newcastle City Council in Tyne and Wear, England. It was held alongside the North East mayoral election, the Northumbria Police and Crime Commissioner election, and other local elections in the United Kingdom held on the same day. As with other local council elections, it was held using first past the post, with councillors being elected to serve four year terms.
The 2010 Newcastle City Council election took place on 6 May 2010 to elect one third of the members of Newcastle City Council in England. The elections took place on the same day as other council elections in England and Wales and the general election.