![]() | |||||||||||||||||||||||||||||||||||||
| |||||||||||||||||||||||||||||||||||||
27 out of 78 seats to Newcastle City Council 40 seats needed for a majority | |||||||||||||||||||||||||||||||||||||
---|---|---|---|---|---|---|---|---|---|---|---|---|---|---|---|---|---|---|---|---|---|---|---|---|---|---|---|---|---|---|---|---|---|---|---|---|---|
|
The 2010 Newcastle City Council election took place on 6 May 2010 to elect one third of the members of Newcastle City Council in England. The elections took place on the same day as other council elections in England and Wales and the general election.
Following the last set of local elections held in 2008, two members of the Liberal Democrats resigned and sat as independents. [1] The Liberal Democrats also gained one seat from Labour in a by-election.
There were 27 of the 78 seats on the council up for election, being the usual third of the council plus a by-election in the Denton ward. The result saw the Labour Party gain six seats from the Liberal Democrats.
After 2008 election | Before 2010 election | After 2010 election | ||||||
---|---|---|---|---|---|---|---|---|
Party | Seats | Party | Seats | Party | Seats | |||
Liberal Democrats | 49 | Liberal Democrats | 48 | Liberal Democrats | 42 | |||
Labour | 29 | Labour | 28 | Labour | 34 | |||
Independent | 0 | Independent | 2 | Independent | 2 | |||
Changes 2008-2010:
2010 Newcastle City Council election [3] [4] | ||||||||||
---|---|---|---|---|---|---|---|---|---|---|
Party | This election | Full council | This election | |||||||
Seats | Net | Seats % | Other | Total | Total % | Votes | Votes % | +/− | ||
Labour | 16 | ![]() | 59.2 | 18 | 34 | 43.5 | 44,909 | 38.9 | ||
Liberal Democrats | 11 | ![]() | 40.8 | 32 | 42 | 53.9 | 44,191 | 38.2 | ||
Conservative | 0 | ![]() | 0.0 | 0 | 0 | 0.0 | 16,724 | 14.5 | ||
BNP | 0 | ![]() | 0.0 | 0 | 0 | 0.0 | 6,461 | 5.6 | ||
Green | 0 | ![]() | 0.0 | 0 | 0 | 0.0 | 2,560 | 2.2 | ||
UKIP | 0 | ![]() | 0.0 | 0 | 0 | 0.0 | 363 | 0.3 | ||
Independent | 0 | ![]() | 0.0 | 2 | 2 | 2.6 | 325 | 0.3 | ||
National Front | 0 | ![]() | 0.0 | 0 | 0 | 0.0 | 62 | 0.1 | ||
Party | Candidate | Votes | % | ±% | |
---|---|---|---|---|---|
Labour | Jeremy Beecham* | 2,390 | 54.8 | ||
Liberal Democrats | Alice McIlveen | 886 | 20.3 | ||
Conservative | Edythe Clayton | 556 | 12.7 | ||
BNP | Doug Graham | 533 | 12.2 | ||
Majority | 1504 | 34.5 | |||
Turnout | 4365 | ||||
Labour hold | Swing | ||||
Party | Candidate | Votes | % | ±% | |
---|---|---|---|---|---|
Labour | Phil Risk | 1,814 | 42.3 | ||
Liberal Democrats | Bill Schardt | 1588 | 37.0 | ||
Conservative | James Langley | 456 | 10.6 | ||
BNP | Jim Lowdon | 430 | 10.0 | ||
Majority | 226 | 5.3 | |||
Turnout | 4288 | ||||
Labour gain from Liberal Democrats | Swing | ||||
Party | Candidate | Votes | % | ±% | |
---|---|---|---|---|---|
Labour | Nick Kemp* | 2,070 | 57.7 | ||
Liberal Democrats | Karen Heslop | 871 | 24.3 | ||
Conservative | Alice Gingell | 330 | 9.2 | ||
BNP | Ken Baldwin | 317 | 8.8 | ||
Majority | 1199 | 33.4 | |||
Turnout | 3588 | ||||
Labour hold | Swing | ||||
Party | Candidate | Votes | % | ±% | |
---|---|---|---|---|---|
Liberal Democrats | Anita Lower* | 2,451 | 48.6 | ||
Labour | Eric Mackinlay | 1435 | 28.4 | ||
Conservative | Jon Aydon | 718 | 14.2 | ||
BNP | Terry Gibson | 342 | 6.8 | ||
Independent | Alan Biggins | 101 | 2.0 | ||
Majority | 1016 | 20.2 | |||
Turnout | 5047 | ||||
Liberal Democrats hold | Swing | ||||
Party | Candidate | Votes | % | ±% | |
---|---|---|---|---|---|
Liberal Democrats | Sharon Bailey | 2,698 | 52.6 | ||
Labour | Ian Rossiter | 1353 | 26.4 | ||
Conservative | Heather Chambers | 779 | 15.2 | ||
BNP | David Tullin | 178 | 3.5 | ||
Green | Taz Burwaiss | 118 | 2.3 | ||
Majority | 1346 | 26.2 | |||
Turnout | 5126 | ||||
Liberal Democrats hold | Swing | ||||
Party | Candidate | Votes | % | ±% | |
---|---|---|---|---|---|
Liberal Democrats | Sarah Cross | 1,804 | 37.5 | ||
Labour | Michael Burke | 1,668 | 34.7 | ||
Labour | Simon Bird | 1663 | |||
Liberal Democrats | Henry Gallagher | 1281 | |||
Conservative | Ernest Shorton | 696 | 14.5 | ||
Conservative | Olga Shorton | 516 | |||
UKIP | Ian Proud | 363 | 7.5 | ||
BNP | Neil Mooney | 275 | 5.8 | ||
BNP | Lynda Scurr | 198 | |||
Majority | 1346 | 26.2 | |||
Turnout | |||||
Liberal Democrats hold | Swing | ||||
Labour gain from Liberal Democrats | Swing | ||||
Party | Candidate | Votes | % | ±% | |
---|---|---|---|---|---|
Liberal Democrats | David Slesenger* | 2,601 | 49.6 | ||
Labour | Hilary Franks | 1525 | 29.1 | ||
Conservative | Martin Sharman | 853 | 16.3 | ||
Green | David Coombes | 263 | 5.0 | ||
Majority | 1076 | 20.5 | |||
Turnout | 5242 | ||||
Liberal Democrats hold | Swing | ||||
Party | Candidate | Votes | % | ±% | |
---|---|---|---|---|---|
Labour | Habib Rahman | 2,126 | 59.4 | ||
Liberal Democrats | Barbara Down | 619 | 17.3 | ||
BNP | Denny Gallagher | 414 | 11.6 | ||
Conservative | Ronald Toward | 278 | 7.8 | ||
Independent | Derek Malcolm | 80 | 2.2 | ||
National Front | Simon Bigg | 62 | 1.7 | ||
Majority | 1507 | 42.1 | |||
Turnout | 3579 | ||||
Labour hold | Swing | ||||
Party | Candidate | Votes | % | ±% | |
---|---|---|---|---|---|
Liberal Democrats | David Faulkner* | 2,076 | 49.2 | ||
Labour | DJ Mather | 1514 | 35.9 | ||
Conservative | Pam Flux | 362 | 8.6 | ||
BNP | Steven Spence | 270 | 6.4 | ||
Majority | 562 | 13.3 | |||
Turnout | 4222 | ||||
Liberal Democrats hold | Swing | ||||
Party | Candidate | Votes | % | ±% | |
---|---|---|---|---|---|
Labour | Helen McStravick | 1,884 | 40.3 | ||
Liberal Democrats | PJ Morrissey | 1563 | 33.4 | ||
BNP | Ken Booth | 641 | 13.7 | ||
Conservative | Alison Wake | 487 | 10.4 | ||
Green | Keith Metcalf | 99 | 2.1 | ||
Majority | 321 | 6.9 | |||
Turnout | 4674 | ||||
Labour gain from Liberal Democrats | Swing | ||||
Party | Candidate | Votes | % | ±% | |
---|---|---|---|---|---|
Labour | Ged Bell | 2,291 | 52.6 | ||
Liberal Democrats | Yetunde Adediran | 1053 | 24.2 | ||
Conservative | Kevin O'Neill | 693 | 15.9 | ||
BNP | Alan Spence | 319 | 7.3 | ||
Majority | 1238 | 28.4 | |||
Turnout | 4356 | ||||
Labour hold | Swing | ||||
Party | Candidate | Votes | % | ±% | |
---|---|---|---|---|---|
Labour | David Cook | 1,866 | 42.2 | ||
Liberal Democrats | Barbara Moorhead | 1694 | 38.4 | ||
Conservative | Sarah Armstrong | 472 | 10.7 | ||
BNP | Ian Belcher | 385 | 8.7 | ||
Majority | 172 | 3.8 | |||
Turnout | 4417 | ||||
Labour gain from Liberal Democrats | Swing | ||||
Party | Candidate | Votes | % | ±% | |
---|---|---|---|---|---|
Labour | Linda Wright | 2,000 | 44.0 | ||
Liberal Democrats | Susan Long | 1695 | 37.3 | ||
Conservative | Carl Ellis | 521 | 11.5 | ||
BNP | Paul Kennett | 330 | 7.3 | ||
Majority | 305 | 6.7 | |||
Turnout | 4546 | ||||
Labour hold | Swing | ||||
Party | Candidate | Votes | % | ±% | |
---|---|---|---|---|---|
Liberal Democrats | Greg Stone | 2,345 | 45.1 | ||
Labour | David Denholm | 1831 | 35.2 | ||
Conservative | Neville Armstrong | 680 | 13.1 | ||
Green | Michael Rabley | 342 | 6.6 | ||
Majority | 514 | 9.9 | |||
Turnout | 5198 | ||||
Liberal Democrats hold | Swing | ||||
Party | Candidate | Votes | % | ±% | |
---|---|---|---|---|---|
Liberal Democrats | Catherine Pagan | 1,938 | 46.7 | ||
Labour | Alison Orlandi | 987 | 23.8 | ||
Conservative | James Marwick | 945 | 22.8 | ||
Green | Tim Dowson | 281 | 6.8 | ||
Majority | 951 | 22.9 | |||
Turnout | 4151 | ||||
Liberal Democrats hold | Swing | ||||
Party | Candidate | Votes | % | ±% | |
---|---|---|---|---|---|
Liberal Democrats | Gareth Kane | 1,713 | 46.0 | ||
Labour | Ian Preston | 1201 | 32.3 | ||
Conservative | Emma Carr | 452 | 12.1 | ||
Green | Dave Shepherdson | 244 | 6.6 | ||
BNP | Lisa Dunleavy | 111 | 3.0 | ||
Majority | 512 | 13.7 | |||
Turnout | 3721 | ||||
Liberal Democrats hold | Swing | ||||
Party | Candidate | Votes | % | ±% | |
---|---|---|---|---|---|
Liberal Democrats | Diane Packham | 3,117 | 55.4 | ||
Conservative | Keith Piper | 1128 | 20.0 | ||
Labour | Susan Pearson | 1123 | 20.0 | ||
Independent | Andrea Bell | 144 | 2.6 | ||
BNP | Ray Hall | 116 | 2.1 | ||
Majority | 1989 | 35.4 | |||
Turnout | 5628 | ||||
Liberal Democrats hold | Swing | ||||
Party | Candidate | Votes | % | ±% | |
---|---|---|---|---|---|
Labour | Sophie White | 1,735 | 46.1 | ||
Liberal Democrats | Mark Nelson | 1394 | 37.0 | ||
Conservative | Kenneth Wake | 289 | 7.7 | ||
Green | Andrew Gray | 245 | 6.5 | ||
BNP | Michael Strong | 104 | 2.8 | ||
Majority | 341 | 9.1 | |||
Turnout | 3767 | ||||
Labour hold | Swing | ||||
Party | Candidate | Votes | % | ±% | |
---|---|---|---|---|---|
Liberal Democrats | Tom Woodwark | 1,936 | 48.6 | ||
Labour | Tom Hardwick | 997 | 25.0 | ||
Conservative | Joanne Lavender | 726 | 20.0 | ||
Green | Tony Waterston | 262 | 6.6 | ||
BNP | Sheila Gregory | 60 | 1.5 | ||
Majority | 939 | 23.6 | |||
Turnout | 3981 | ||||
Liberal Democrats hold | Swing | ||||
Party | Candidate | Votes | % | ±% | |
---|---|---|---|---|---|
Labour | John Stokel-Walker | 2,703 | 70.1 | ||
Liberal Democrats | Michael Burn | 626 | 16.2 | ||
BNP | John Mitchell | 281 | 7.3 | ||
Conservative | Marian McWilliams | 250 | 6.5 | ||
Majority | 2077 | 53.8 | |||
Turnout | 3860 | ||||
Labour hold | Swing | ||||
Party | Candidate | Votes | % | ±% | |
---|---|---|---|---|---|
Labour | Maureen Lowson | 2,009 | 46.0 | ||
Liberal Democrats | David Besag | 1706 | 39.1 | ||
Conservative | Stephen Lowrey | 346 | 7.9 | ||
BNP | Shaun Russell | 303 | 6.9 | ||
Majority | 303 | 6.9 | |||
Turnout | 4364 | ||||
Labour gain from Liberal Democrats | Swing | ||||
Party | Candidate | Votes | % | ±% | |
---|---|---|---|---|---|
Liberal Democrats | Bill Shepherd | 2,847 | 50.9 | ||
Conservative | Karen Jewers | 1485 | 26.6 | ||
Labour | Howard Elcock | 941 | 16.8 | ||
Green | Sandy Irvine | 237 | 4.2 | ||
BNP | Bill Curry | 82 | 1.5 | ||
Majority | 1363 | 24.3 | |||
Turnout | 3981 | ||||
Liberal Democrats hold | Swing | ||||
Party | Candidate | Votes | % | ±% | |
---|---|---|---|---|---|
Labour | Brian Hunter | 1,947 | 36.5 | ||
Liberal Democrats | Neil Hamilton | 1762 | 33.0 | ||
Conservative | Jason Smith | 1298 | 24.3 | ||
BNP | Bill Armstrong | 330 | 6.2 | ||
Majority | 185 | 3.5 | |||
Turnout | 5337 | ||||
Labour gain from Liberal Democrats | Swing | ||||
Party | Candidate | Votes | % | ±% | |
---|---|---|---|---|---|
Labour | Geoff O'Brien | 1,366 | 46.5 | ||
Liberal Democrats | Peter Andras | 843 | 28.7 | ||
Conservative | Elaine Bamford | 369 | 12.6 | ||
BNP | Mick Roche | 184 | 6.3 | ||
Majority | 523 | 17.8 | |||
Turnout | 2937 | ||||
Labour hold | Swing | ||||
Party | Candidate | Votes | % | ±% | |
---|---|---|---|---|---|
Labour | Joyce McCarty | 1,924 | 44.1 | ||
Liberal Democrats | James Hollis | 1078 | 24.7 | ||
Conservative | Mehrban Sadiq | 916 | 21.0 | ||
Green | John Pearson | 294 | 6.7 | ||
BNP | Russ Rickerby | 146 | 3.4 | ||
Majority | 846 | 19.4 | |||
Turnout | 4358 | ||||
Labour hold | Swing | ||||
Party | Candidate | Votes | % | ±% | |
---|---|---|---|---|---|
Labour | George Pattison | 2,209 | 49.7 | ||
Liberal Democrats | James Kenyon | 1287 | 29.0 | ||
Conservative | William Holloway | 639 | 14.4 | ||
BNP | Gary Gibson | 307 | 6.9 | ||
Majority | 922 | 20.7 | |||
Turnout | 4442 | ||||
Labour hold | Swing | ||||
The city of Bristol, England, is a unitary authority, represented by four MPs representing seats wholly within the city boundaries. The overall trend of both local and national representation became left of centre during the latter 20th century. The city has a tradition of local activism, with environmental issues and sustainable transport being prominent issues in the city.
Burnley Borough Council elections are generally held three years out of every four, with a third of the council elected each time. Burnley Borough Council is the local authority for the non-metropolitan district of Burnley in Lancashire, England. Since the last boundary changes in 2002, 45 councillors have been elected from 15 wards.
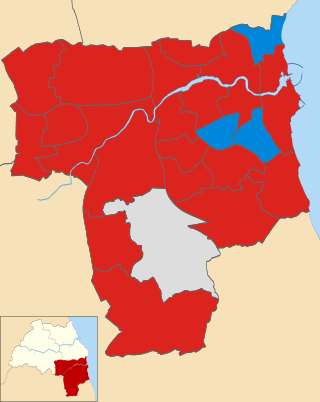
The 2004 Gateshead Borough Council election was held on 10 June 2004 to elect members of Gateshead Council in Tyne and Wear, England. The whole council was up for election with boundary changes since the last election in 2003. The Labour Party stayed in overall control of the council.
The 2010 Winchester Council election took place on 6 May 2010 to elect members of Winchester District Council in Hampshire, England. One third of the council was up for election and the Liberal Democrats gained overall control of the council from the Conservative Party.
The 2010 St Albans City and District Council election took place on 6 May 2010 to elect members of St Albans District Council in Hertfordshire, England. One third of the council was up for election and the Liberal Democrats stayed in overall control of the council.
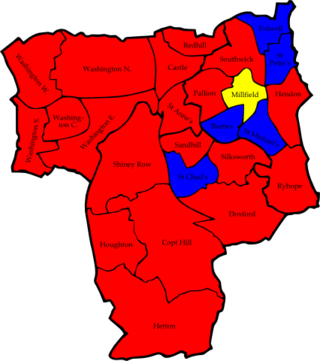
The 2006 Sunderland Council election took place on 4 May 2006 to elect members of Sunderland City Council in Tyne and Wear, England. One third of the Council was up for election and the Labour Party stayed in overall control.
The 2010 Sunderland Council election took place on 6 May 2010 to elect members of Sunderland Metropolitan Borough Council in Tyne and Wear, England. One third of the council was up for election and the Labour Party stayed in overall control of the council. The election took place on the same day as the 2010 General Election.
The 2011 Sunderland Council election took place on 5 May 2011 to elect members of Sunderland Metropolitan Borough Council in Tyne and Wear, England. One third of the council was up for election and the Labour Party stayed in overall control of the council.
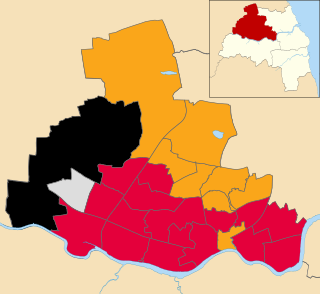
The 2016 Newcastle City Council Council elections took place on 5 May 2016 to elect one third of the members of Newcastle City Council in England. The elections took place on the same day as other local elections.
The 2018 Lambeth London Borough Council election took place on 3 May 2018 alongside other local elections in London, to elect members of Lambeth London Borough Council in England. The election saw Labour remain in control of Lambeth Council with a slightly reduced majority, winning over 90% of the seats. The Green Party achieved its best-ever result in the borough, winning five seats and becoming the official opposition and the largest Green group in London.
The 2018 Plymouth City Council election took place on 3 May 2018 to elect members of Plymouth City Council in England. The election was won by the Labour Party, who gained enough seats to achieve an overall majority and took control of the council.
The 2019 Newcastle City Council elections took place on 2 May 2019, on the same day as other local elections across the United Kingdom.
Newcastle Independents, formerly known as Newcastle First, is a localist political party based in Newcastle upon Tyne.
The 2021 Newcastle City Council election took place on 6 May 2021 to elect members of Newcastle City Council in England. This was on the same day as other local elections across the United Kingdom.
The 2022 Birmingham City Council election took place on 5 May 2022, with all 101 council seats up for election across 37 single-member and 32 two-member wards. The election was held alongside other local elections across Great Britain and town council elections in Sutton Coldfield.
The 2022 Newcastle City Council election took place on 5 May 2022. One third of councillors — 26 out of 78 — on Newcastle City Council were elected. The election took place alongside other local elections across the United Kingdom.
The 2022 Sunderland City Council election took place on 5 May 2022 to elect members of Sunderland City Council. This is on the same day as other elections across the United Kingdom.
The 2023 Newcastle City Council election took place on 4 May 2023 to elect one third of the members of Newcastle City Council in Tyne & Wear, England. This was on the same day as other local elections in England and Wales.
The 2024 Newcastle City Council election was held on Thursday 2 May 2024, to elect members of Newcastle City Council in Tyne and Wear, England. It was held alongside the North East mayoral election, the Northumbria Police and Crime Commissioner election, and other local elections in the United Kingdom held on the same day. As with other local council elections, it was held using first past the post, with councillors being elected to serve four year terms.