| |||||||||||||||||||||||||||||||||||||||||||||||||||||||||||||||||
|
The 2014 Newcastle City Council election took place on 22 May 2014 to elect members of Newcastle City Council in England. [1] This was on the same day as other local elections.
The election saw the governing Labour Party gain a net extra seat in the council chambers, gaining the wards of Denton and South Jesmond. An Independent councillor was also elected in Westerhope, with Bill Corbett winning with a 451 majority over the Labour Party.
The Conservatives improved their performance from previous years, coming second in wards where they were previously third. The election also saw UKIP field candidates around the city. The party came second in wards including Byker and Lemington.
Newcastle City Council election, 2014 | |||||||
---|---|---|---|---|---|---|---|
Party | Seats | Popular vote | |||||
Won | Not up | Total | ± | Votes | Percentage | ||
Labour | 17 | 35 | 52 | +1 | 32,129 | 45.0% | |
Liberal Democrats | 9 | 15 | 24 | -2 | 15,068 | 21.7% | |
Independent | 1 | 1 | 2 | +1 | 1,343 | ||
UKIP | 0 | 0 | 0 | ±0 | 9,231 | 13.5% | |
Conservative | 0 | 0 | 0 | ±0 | 6,985 | 9.9% | |
Green | 0 | 0 | 0 | ±0 | 0 | ||
Newcastle First | 0 | 0 | 0 | ±0 | |||
TUSC | 0 | 0 | 0 | ±0 | |||
British Democrats | 0 | 0 | 0 | ±0 | |||
Total | 27 | 51 | 78 | ±0 | 68,634 | – | |
Turnout | 34.2% | ||||||
Party | Candidate | Votes | % | ±% | |
---|---|---|---|---|---|
Labour | Jeremy Beecham | 1,502 | |||
UKIP | Elisabeth Edmundson | 823 | |||
Conservative | Neville Armstrong | 219 | |||
Green | Lee Irving | 136 | |||
Liberal Democrats | Ronald Clark | 117 | |||
Majority | 679 | ||||
Turnout | |||||
Labour hold | Swing | ||||
Party | Candidate | Votes | % | ±% | |
---|---|---|---|---|---|
Labour | Ben Riley | 1,897 | |||
Liberal Democrats | Bill Schardt | 485 | |||
Conservative | James Langley | 308 | |||
Majority | 1,589 | ||||
Turnout | |||||
Labour hold | Swing | ||||
Party | Candidate | Votes | % | ±% | |
---|---|---|---|---|---|
Labour | Nick Kemp | 1,275 | |||
UKIP | Ray Hardy | 624 | |||
Conservative | Donald Robinson | 130 | |||
Liberal Democrats | James Kenyon | 92 | |||
TUSC | Ryan Holmes | 70 | |||
Majority | 651 | ||||
Turnout | |||||
Labour hold | Swing | ||||
Party | Candidate | Votes | % | ±% | |
---|---|---|---|---|---|
Liberal Democrats | Anita Lower | 1,270 | |||
Labour | Kim McGuinness | 1,106 | |||
UKIP | Tim Marron | 701 | |||
Conservative | Mary Toward | 270 | |||
Majority | 164 | ||||
Turnout | |||||
Liberal Democrats hold | Swing | ||||
Party | Candidate | Votes | % | ±% | |
---|---|---|---|---|---|
Liberal Democrats | Karen Robinson | 1,363 | |||
Labour | Sheila Spencer | 992 | |||
Conservative | Heather Chambers | 462 | |||
TUSC | Ian Cusack | 180 | |||
Majority | 371 | ||||
Turnout | |||||
Liberal Democrats hold | Swing | ||||
Party | Candidate | Votes | % | ±% | |
---|---|---|---|---|---|
Labour | Anna Round | 1,332 | |||
Newcastle First | Ian Fraser | 679 | |||
Liberal Democrats | Sarah Cross | 405 | |||
Conservative | Alan Birkmyre | 296 | |||
Majority | 653 | ||||
Majority | 996 | ||||
Turnout | |||||
Labour gain from Liberal Democrats | Swing | ||||
Party | Candidate | Votes | % | ±% | |
---|---|---|---|---|---|
Liberal Democrats | David Slesenger | 1,199 | |||
Labour | Dan Greenhough | 1,004 | |||
Conservative | Joseph Gallagher | 377 | |||
Green | Frances Hinton | 336 | |||
UKIP | Mike Adie | 266 | |||
Majority | 195 | ||||
Turnout | |||||
Liberal Democrats hold | Swing | ||||
Party | Candidate | Votes | % | ±% | |
---|---|---|---|---|---|
Labour | Habib Rahman | 1,522 | |||
British Democratic | Kenny Baldwin | 414 | |||
Conservative | Ronald Toward | 165 | |||
Liberal Democrats | Ian Laverick | 143 | |||
Majority | 1,108 | ||||
Turnout | |||||
Labour hold | Swing | ||||
Party | Candidate | Votes | % | ±% | |
---|---|---|---|---|---|
Liberal Democrats | David Faulkner | 1,253 | |||
Labour | Heather Michell | 947 | |||
UKIP | Ray Thomson | 521 | |||
Conservative | Stephen Axford | 108 | |||
Majority | 306 | ||||
Turnout | |||||
Liberal Democrats hold | Swing | ||||
Party | Candidate | Votes | % | ±% | |
---|---|---|---|---|---|
Labour | Karen Kigour | 1,428 | |||
UKIP | Lorraine Smith | 746 | |||
Conservative | Keran McNally | 263 | |||
Liberal Democrats | Tona Atkinson | 229 | |||
Green | Jess Poyner | 121 | |||
Majority | 682 | ||||
Turnout | |||||
Labour hold | Swing | ||||
Party | Candidate | Votes | % | ±% | |
---|---|---|---|---|---|
Labour | Ged Bell | 1,733 | |||
Conservative | Alison Wake | 431 | |||
Liberal Democrats | Tracey Connell | 349 | |||
Majority | 1,402 | ||||
Turnout | |||||
Labour hold | Swing | ||||
Party | Candidate | Votes | % | ±% | |
---|---|---|---|---|---|
Labour | David Cook | 1,146 | |||
UKIP | Alexis Fernandes | 672 | |||
Liberal Democrats | Lawrence Hunter | 397 | |||
Conservative | Emmett McNally | 183 | |||
Majority | 472 | ||||
Turnout | |||||
Labour hold | Swing | ||||
Party | Candidate | Votes | % | ±% | |
---|---|---|---|---|---|
Labour | Linda Wright | 1,140 | |||
UKIP | Christopher Ballantyne | 564 | |||
Newcastle First | John Gordon | 258 | |||
Conservative | Kenneth Wake | 214 | |||
Liberal Democrats | Barbara Down | 159 | |||
Independent | Idwal John | 149 | |||
Majority | 576 | ||||
Turnout | |||||
Labour hold | Swing | ||||
Party | Candidate | Votes | % | ±% | |
---|---|---|---|---|---|
Liberal Democrats | Greg Stone | 1,454 | |||
Labour | Mick Bowman | 1,149 | |||
UKIP | Helen Jordan | 402 | |||
Conservative | James Bartle | 204 | |||
TUSC | Lizi Gray | 114 | |||
Majority | 305 | ||||
Turnout | |||||
Liberal Democrats hold | Swing | ||||
Party | Candidate | Votes | % | ±% | |
---|---|---|---|---|---|
Liberal Democrats | Catherine Walker | 621 | |||
Labour | Peter Smith | 589 | |||
Green | Tim Dowson | 277 | |||
Conservative | Duncan Crute | 276 | |||
UKIP | Will Solyom | 129 | |||
Majority | 22 | ||||
Turnout | |||||
Liberal Democrats hold | Swing | ||||
Party | Candidate | Votes | % | ±% | |
---|---|---|---|---|---|
Liberal Democrats | Gareth Kane | 917 | |||
Labour | Jane Byrne | 887 | |||
UKIP | Daniel Cooke | 164 | |||
Conservative | Christos Mexias | 96 | |||
TUSC | Rober Hooper | 93 | |||
Majority | 896 | ||||
Turnout | |||||
Liberal Democrats hold | Swing | ||||
Party | Candidate | Votes | % | ±% | |
---|---|---|---|---|---|
Liberal Democrats | Robin Ashby | 1,549 | |||
Labour | Ian Tokell | 773 | |||
Conservative | Karen Jewers | 547 | |||
UKIP | Alora Adie | 393 | |||
Majority | 776 | ||||
Turnout | |||||
Liberal Democrats hold | Swing | ||||
Party | Candidate | Votes | % | ±% | |
---|---|---|---|---|---|
Labour | Sophie White | 1,095 | |||
Green | Andrew Gray | 519 | |||
UKIP | James Robertson | 209 | |||
Liberal Democrats | 131 Boyle | 274 | |||
Conservative | Samuel Boam | 99 | |||
TUSC | Paul Phillips | 45 | |||
Majority | 576 | ||||
Turnout | |||||
Labour hold | Swing | ||||
Party | Candidate | Votes | % | ±% | |
---|---|---|---|---|---|
Labour | Arlene Ainsley | 752 | |||
Liberal Democrats | Tom Woodwark | 396 | |||
Green | Tony Waterson | 279 | |||
Conservative | Sam Lee | 236 | |||
UKIP | Penny Stansfield | 164 | |||
Majority | 356 | ||||
Turnout | |||||
Labour gain from Liberal Democrats | Swing | ||||
Party | Candidate | Votes | % | ±% | |
---|---|---|---|---|---|
Labour | John Stokel-Walker | 1,573 | |||
UKIP | Eric Taylorson | 580 | |||
Liberal Democrats | Gerry Keating | 85 | |||
Conservative | Joan Atkin | 52 | |||
TUSC | Bobbie Cranney | 63 | |||
Majority | 993 | ||||
Turnout | |||||
Labour hold | Swing | ||||
Party | Candidate | Votes | % | ±% | |
---|---|---|---|---|---|
Labour | Maureen Lowson | 1,276 | |||
UKIP | Joseph Todd | 843 | |||
Liberal Democrats | David Besag | 372 | |||
Conservative | Marian McWilliams | 146 | |||
Communist | Martin Levy | 33 | |||
Majority | 433 | ||||
Turnout | |||||
Labour hold | Swing | ||||
Party | Candidate | Votes | % | ±% | |
---|---|---|---|---|---|
Liberal Democrats | Bill Shepherd | 1,226 | |||
Conservative | Steve Kyte | 735 | |||
Labour | Ed Derrick | 701 | |||
UKIP | Daniel Thompson | 476 | |||
Green | Sandy Irvine | 243 | |||
Majority | 491 | ||||
Turnout | |||||
Liberal Democrats hold | Swing | ||||
Party | Candidate | Votes | % | ±% | |
---|---|---|---|---|---|
Independent | Bill Corbett | 1,343 | |||
Newcastle First | Ernie Shorton | 892 | |||
Labour | Brian Hunter | 818 | |||
UKIP | Charlotte Johnston | 393 | |||
Conservative | Dorothy Wonnacott | 125 | |||
Liberal Democrats | Hans-Christian Andersen | 64 | |||
Majority | 451 | ||||
Turnout | |||||
Independent gain from Labour | Swing | ||||
Party | Candidate | Votes | % | ±% | |
---|---|---|---|---|---|
Labour | Geoff O'Brien | 1,118 | |||
Conservative | Alex Staton | 218 | |||
TUSC | Cliff Broen | 254 | |||
Liberal Democrats | Claire Schofield | 142 | |||
Majority | 900 | ||||
Turnout | |||||
Labour hold | Swing | ||||
Party | Candidate | Votes | % | ±% | |
---|---|---|---|---|---|
Labour | Joyce McCarty | 1,592 | |||
Green | John Pearson | 401 | |||
Conservative | Anisha Malik | 325 | |||
Liberal Democrats | Mark Nelson | 119 | |||
Majority | 1,191 | ||||
Turnout | |||||
Labour hold | Swing | ||||
Party | Candidate | Votes | % | ±% | |
---|---|---|---|---|---|
Labour | George Pattison | 1,467 | |||
Labour | Jacqui Robinson | 1,315 | |||
UKIP | Christopher Armstrong | 646 | |||
Liberal Democrats | Phillip McArdle | 306 | |||
Conservative | Jacqueline McNally | 278 | |||
Liberal Democrats | Colin Daglish | 237 | |||
Conservative | Julian Toward | 211 | |||
Majority | 821 | ||||
Majority | 669 | ||||
Turnout | |||||
Labour hold | Swing | ||||
The Borough of Newcastle-under-Lyme is a local government district with borough status in Staffordshire, England.
The 2004 United Kingdomlocal elections were held on Thursday 10 June 2004, along with the European elections and the London mayoral and Assembly elections.
The 2011 Sunderland Council election took place on 5 May 2011 to elect members of Sunderland Metropolitan Borough Council in Tyne and Wear, England. One third of the council was up for election and the Labour Party stayed in overall control of the council.
The 2014 Enfield Council election took place on 22 May 2014 to elect members of Enfield London Borough Council in London, England. The whole council was up for election and the Labour party retained overall control of the council, increasing their majority over the Conservative party by five seats.
The 2014 Plymouth City Council election took place on 22 May 2014 to elect members of Plymouth City Council in England. This was on the same day as other local elections. The election was won by the Labour Party, who maintained their overall majority. The UK Independence Party gained representation on the council for the first time, and this was the only election in which the party won seats in Plymouth.
Elections to Cannock Chase District Council took place on 22 May 2014 on the same day as other local elections in England and the European Parliament elections. A third of the council was up for election, meaning a total of 13 councillors were elected from all but two of the council's wards. There were no elections held in the Hagley or Hednesford South wards as those wards elect only two councillors in the other two years of the election cycle.
The 2015 Newcastle City Council Council election took place on 7 May 2015 to elect one third of the members of Newcastle City Council in England. The elections took place on the same day as other local elections.
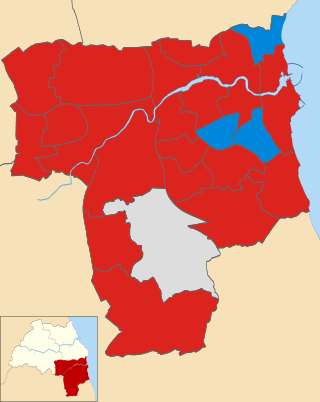
The 2015 Sunderland City Council election took place on 7 May 2015 to elect members of Sunderland City Council in England. This was on the same day as other local elections, and the 2015 General Election.
The 2015 Newcastle-under-Lyme Borough Council election took place on 7 May 2015 to elect members of the Newcastle-under-Lyme Borough Council in England. It was held on the same day as other local elections.
The 2016 Newcastle City Council Council elections took place on 5 May 2016 to elect one third of the members of Newcastle City Council in England. The elections took place on the same day as other local elections.
The 2016 Exeter City Council election took place on 5 May 2016, to elect members of Exeter City Council in England. Following boundary changes, the entire council was up for election, and all 13 wards were contested, each electing three councillors. The election was held concurrently with other local elections held in England on the 5 May.
The 2018 Lambeth London Borough Council election took place on 3 May 2018 alongside other local elections in London, to elect members of Lambeth London Borough Council in England. The election saw Labour remain in control of Lambeth Council with a slightly reduced majority, winning over 90% of the seats. The Green Party achieved its best-ever result in the borough, winning five seats and becoming the official opposition and the largest Green group in London.
The 2018 Norwich City Council election took on 3 May 2018 to elect members of Norwich City Council in England. This was on the same day as other local elections. 13 of 39 seats (one-third) were up for election.
The 2018 Oxford City Council election took place on 3 May 2018, to elect 24 of the 48 members of Oxford City Council in England. This was on the same day as other local elections in England. Each of Oxford's 24 wards elected one councillor, with the other seat in each ward next due for election in May 2020.
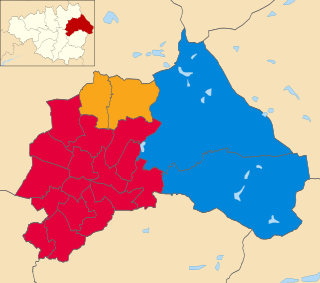
The 2018 Oldham Council election took place on 3 May 2018 to elect members of Oldham Council in England. The election took place on the same day as other local elections in England. The election saw the majority Labour Party increase its number of seats by two. The Conservative Party also gained two seats, while the Liberal Democrats lost one seat. UKIP ceased to have representation on the council following this election. The election left Labour with 47 seats, the Liberal Democrats 8 and the Conservatives 4 with the remaining seat being held by an Independent.
The 2019 Sunderland City Council election took place on 2 May 2019 to elect members of Sunderland City Council in England. The election took place on the same day as other local elections.
The 1967 Cardiff City Council election was held on Thursday 11 May 1967 to elect councillors to Cardiff City Council in Cardiff, Glamorgan, Wales. It took place on the same day as several other county borough elections in Wales and England.
The 2022 United Kingdom local elections took place on Thursday 5 May 2022. These included elections for all London borough councils, for all local authorities in Wales and Scotland. Most seats in England were last up for election in 2018 and in Scotland and Wales in 2017. The elections coincided with the 2022 Northern Ireland Assembly election. In 91 cases, most of them in Wales, council seats were uncontested, each having only one candidate. Three seats in Scotland remained unfilled as no one nominated to fill them.
The 2022 Newcastle City Council election took place on 5 May 2022. One third of councillors — 26 out of 78 — on Newcastle City Council were elected. The election took place alongside other local elections across the United Kingdom.
The 2023 Brighton and Hove City Council election took place on 4 May 2023 to elect members of Brighton and Hove City Council, England. This was at the same time as other local elections in England. Due to a boundary review, there was a change in ward boundaries, but the city council continued to comprise 54 members.