![]() | |||||||||||||||||||||||||
| |||||||||||||||||||||||||
One third (40) seats to Birmingham City Council 61 seats needed for a majority | |||||||||||||||||||||||||
---|---|---|---|---|---|---|---|---|---|---|---|---|---|---|---|---|---|---|---|---|---|---|---|---|---|
| |||||||||||||||||||||||||
![]() 2014 local election results in Birmingham. | |||||||||||||||||||||||||
|
The 2014 Birmingham City Council election took place on 22 May 2014 to elect members of Birmingham City Council in England. [1] This was on the same day as other local elections.
All results [2] are compared to 2010 as that is the term which expired in 2014.
Party | Seats | Gains | Losses | Net gain/loss | Seats % | Votes % | Votes | +/− | |
---|---|---|---|---|---|---|---|---|---|
Labour | 77 | ![]() | ![]() | ![]() | |||||
Conservative | 31 | ![]() | ![]() | ![]() | |||||
Liberal Democrats | 12 | ![]() | ![]() | ![]() | |||||
UKIP | 0 | ![]() | ![]() | ![]() | 0 | ||||
Green | 0 | ![]() | ![]() | ![]() | 0 | ||||
Respect | 0 | ![]() | ![]() | ![]() | 0 | ||||
Socialist Labour | 0 | ![]() | ![]() | ![]() | 0 | ||||
TUSC | 0 | ![]() | ![]() | ![]() | 0 | ||||
SDP | 0 | ![]() | ![]() | ![]() | 0 | ||||
Communities Against the Cuts | 0 | ![]() | ![]() | ![]() | 0 | ||||
BNP | 0 | ![]() | ![]() | ![]() | 0 | ||||
Party | Candidate | Votes | % | ±% | |
---|---|---|---|---|---|
Liberal Democrats | Roger Harmer | 2,679 | 45.7 | ![]() | |
Labour | Rachel Seabright | 2041 | 34.8 | ![]() | |
Green | Amanda Baker | 422 | 7.2 | ![]() | |
Conservative | Charlotte Hodivala | 372 | 6.3 | ![]() | |
TUSC | Eamonn Flynn | 254 | 4.3 | N/A | |
SDP | Peter Johnson | 98 | 1.7 | ![]() | |
Majority | 638 | 10.9 | ![]() | ||
Turnout | 5866 | ||||
Liberal Democrats hold | Swing | ||||
Party | Candidate | Votes | % | ±% | |
---|---|---|---|---|---|
Labour | Ziaul Islam | 4,175 | 68.7 | ![]() | |
Liberal Democrats | Sham Uddin | 1341 | 22.1 | ![]() | |
Conservative | Thomas Fraser Pike | 452 | 7.4 | ![]() | |
Independent | Abdusalam Smith | 108 | 1.8 | ![]() | |
Majority | 2834 | 46.6 | ![]() | ||
Turnout | 6076 | ||||
Labour hold | Swing | ||||
Party | Candidate | Votes | % | ±% | |
---|---|---|---|---|---|
Conservative | Bruce Lines | 2,637 | 49.5 | ![]() | |
UKIP | Clair Felton | 1308 | 24.6 | N/A | |
Labour | Mike Zamorski | 1108 | 20.8 | ![]() | |
Green | Minnie Rahman | 167 | 3.1 | ![]() | |
Liberal Democrats | Julia Garrett | 106 | 2.0 | ![]() | |
Majority | 1329 | 25.0 | ![]() | ||
Turnout | 5326 | ||||
Conservative hold | Swing | ||||
Party | Candidate | Votes | % | ±% | |
---|---|---|---|---|---|
Labour | Alex Buchanan | 2,525 | 44.1 | ![]() | |
UKIP | James Dalton | 1499 | 26.2 | N/A | |
Conservative | Andy Rudge | 1480 | 25.9 | ![]() | |
Liberal Democrats | Christopher Burgess | 218 | 3.8 | ![]() | |
Majority | 1026 | 17.9 | ![]() | ||
Turnout | 5722 | ||||
Labour hold | Swing | ||||
Party | Candidate | Votes | % | ±% | |
---|---|---|---|---|---|
Labour | Mohammed Aikhlaq | 3,857 | 55.5 | ![]() | |
Liberal Democrats | Mohammed Saeed | 2310 | 33.2 | ![]() | |
UKIP | Arthur Davis | 386 | 5.6 | ![]() | |
Green | Alan Clawley | 193 | 2.8 | ![]() | |
Conservative | William Hordern | 171 | 2.5 | ![]() | |
TUSC | Theo Sharieff | 35 | 0.5 | N/A | |
Majority | 1547 | 22.3 | ![]() | ||
Turnout | 6952 | ||||
Labour hold | Swing | ||||
Party | Candidate | Votes | % | ±% | |
---|---|---|---|---|---|
Conservative | Rob Sealey | 3,220 | 41.4 | ![]() | |
Labour | Dee Smyth | 2466 | 31.7 | ![]() | |
UKIP | Ash Mondair | 883 | 11.4 | N/A | |
Green | Cheryl Buxton-Sait | 703 | 9.0 | ![]() | |
Liberal Democrats | Steve Haynes | 295 | 3.8 | ![]() | |
Communities Against the Cuts | Robert Nickson | 203 | 2.6 | N/A | |
Majority | 754 | 9.7 | ![]() | ||
Turnout | 7770 | ||||
Conservative hold | Swing | ||||
Party | Candidate | Votes | % | ±% | |
---|---|---|---|---|---|
Conservative | Fergus Robinson | 2,235 | 44.0 | ![]() | |
Labour | Robbie Lea-Trengrouse | 2,061 | 40.6 | ![]() | |
UKIP | Keith Rowe | 470 | 9.3 | ![]() | |
Liberal Democrats | Kaneyalal Chudasama | 313 | 6.2 | ![]() | |
Majority | 174 | 3.4 | ![]() | ||
Turnout |
Party | Candidate | Votes | % | ±% | |
---|---|---|---|---|---|
Conservative | Robert Alden | 2,743 | |||
Labour Co-op | Keith Heron | 1,699 | |||
UKIP | Mel Ward | 703 | |||
Liberal Democrats | Philip Mills | 115 | |||
TUSC | Joe Foster | 79 | |||
BNP | Frances Waldron | 66 | |||
Majority | 1,044 | ||||
Turnout |
Party | Candidate | Votes | % | ±% | |
---|---|---|---|---|---|
Labour | Kerry Jenkins | 2,317 | |||
Liberal Democrats | Paula Smith | 1,822 | |||
Conservative | Steve Mee | 1,046 | |||
Independent | Bob Harvey | 972 | |||
UKIP | Vic East | 814 | |||
Majority | 495 | ||||
Turnout |
Party | Candidate | Votes | % | ±% | |
---|---|---|---|---|---|
Labour | Narinder Kooner | 4,009 | |||
Conservative | Sukhwinder Sungu | 862 | |||
Green | Eric Fairclough | 438 | |||
Socialist Labour | John Tyrrell | 392 | |||
Liberal Democrats | Paramjit Singh | 200 | |||
Majority | 3,147 | ||||
Turnout |
Party | Candidate | Votes | % | ±% | |
---|---|---|---|---|---|
Conservative | John Alden | 2,816 | 41.4 | ||
Labour | Nabila Zulfiqar | 2,518 | 37.0 | ||
Green | Phil Simpson | 637 | |||
UKIP | Charles Brecknell | 574 | |||
Liberal Democrats | Philip Banting | 258 | |||
Majority | 298 | ||||
Turnout | |||||
Conservative hold | Swing | ||||
Party | Candidate | Votes | % | ±% | |
---|---|---|---|---|---|
Labour | Fiona Williams | 2,848 | |||
UKIP | Adrian Duffen | 1,246 | |||
Liberal Democrats | Mohammad Azam | 1,057 | |||
Conservative | Cyrus Hodivala | 495 | |||
Majority | 1,602 | ||||
Turnout |
Party | Candidate | Votes | % | ±% | |
---|---|---|---|---|---|
Conservative | Simon Jevon | 1,837 | |||
Labour Co-op | Steve Bedser | 1,722 | |||
UKIP | Timothy Plumbe | 1,222 | |||
Liberal Democrats | Peter Lloyd | 213 | |||
Communities Against the Cuts | Christopher Hughes | 207 | |||
Majority | 115 | ||||
Turnout |
Party | Candidate | Votes | % | ±% | |
---|---|---|---|---|---|
Conservative | Ron Storer | 1,578 | |||
Labour | Desmond Hughes | 1,546 | |||
UKIP | Jan Higgins | 1,128 | |||
BNP | Frances Burke | 92 | |||
Liberal Democrats | Graham Lippiatt | 77 | |||
Majority | 32 | ||||
Turnout |
Party | Candidate | Votes | % | ±% | |
---|---|---|---|---|---|
Labour | Carl Rice | 2,308 | |||
Conservative | Tim Skidmore | 655 | |||
UKIP | John Hine | 396 | |||
Green | Hazel Clawley | 371 | |||
Liberal Democrats | Khondaker Alam | 221 | |||
Majority | 1,653 | ||||
Turnout |
Party | Candidate | Votes | % | ±% | |
---|---|---|---|---|---|
Labour Co-op | Ian Cruise | 1,669 | |||
Conservative | Derek Johnson | 1,598 | |||
UKIP | Steven Brookes | 1,544 | |||
Green | Aysha Turner | 238 | |||
Liberal Democrats | Kevin Hannon | 157 | |||
TUSC | Clive Walder | 55 | |||
Majority | 71 | ||||
Turnout |
N.B. Cruise left the Labour Party in August 2015 and now sits as an Independent. [3]
Party | Candidate | Votes | % | ±% | |
---|---|---|---|---|---|
Labour | Hendrina Quinnen | 4,179 | |||
Liberal Democrats | Talukder Hussain | 953 | |||
Conservative | Ravi Chumber | 478 | |||
TUSC | Alistair Wingate | 307 | |||
Majority | 3,226 | ||||
Turnout |
Party | Candidate | Votes | % | ±% | |
---|---|---|---|---|---|
Labour Co-op | Claire Spencer | 3,099 | |||
Liberal Democrats | Ernie Hendricks | 1,963 | |||
Green | Elly Stanton | 768 | |||
Conservative | Alistair Wingate | 623 | |||
UKIP | Alan Blumenthal | 494 | |||
TUSC | Michael Friel | 494 | |||
Majority | 3,226 | ||||
Turnout |
Party | Candidate | Votes | % | ±% | |
---|---|---|---|---|---|
Labour | Chauhdry Rashid | 3,156 | |||
Conservative | Abdi Elmi | 574 | |||
Green | Janet Assheton | 556 | |||
Liberal Democrats | Shazad Iqbal | 307 | |||
Majority | 2,582 | ||||
Turnout |
Party | Candidate | Votes | % | ±% | |
---|---|---|---|---|---|
Conservative | Randal Brew | 2,697 | |||
Labour Co-op | Carole Griffiths | 1,768 | |||
UKIP | Barrie Clews | 1,366 | |||
Green | Susan Pearce | 308 | |||
Liberal Democrats | Andrew Moles | 145 | |||
Communities Against the Cuts | Katherine Dunn | 86 | |||
Majority | 929 | ||||
Turnout |
Party | Candidate | Votes | % | ±% | |
---|---|---|---|---|---|
Labour | Barbara Dring | 1,962 | |||
UKIP | Roger Tempest | 1,623 | |||
Conservative | Graham Green | 1,364 | |||
Green | Harry Eyles | 188 | |||
Liberal Democrats | Nicholas Joliffe | 117 | |||
Majority | 339 | ||||
Turnout |
Party | Candidate | Votes | % | ±% | |
---|---|---|---|---|---|
Liberal Democrats | Karen Hamilton | 2,437 | |||
Labour Co-op | Sarfraiz Hussain | 2,278 | |||
UKIP | Charles Douglas | 908 | |||
Conservative | Georgina Chandler | 392 | |||
Majority | 159 | ||||
Turnout |
Party | Candidate | Votes | % | ±% | |
---|---|---|---|---|---|
Labour | Matthew Gregson | 2,612 | 42.3 | ||
Conservative | Ian Colpman | 1,922 | 31.2 | ||
UKIP | Laura Howard | 1,096 | |||
Green | Peter Beck | 329 | |||
Liberal Democrats | Ian Garrett | 175 | |||
TUSC | Nick Hart | 34 | |||
Majority | 690 | ||||
Turnout |
Party | Candidate | Votes | % | ±% | |
---|---|---|---|---|---|
Labour | Changese Khan | 1,684 | 32 | ![]() | |
Liberal Democrats | David Radcliffe | 1,609 | 31 | ![]() | |
Green | Joe Rooney | 711 | 14 | ![]() | |
Conservative | Monica Hardie | 687 | 13 | ![]() | |
UKIP | Peter Hughes | 498 | 10 | ![]() | |
Majority | 75 | ||||
Turnout | 5189 | ||||
Labour gain from Liberal Democrats | Swing | ||||
Party | Candidate | Votes | % | ±% | |
---|---|---|---|---|---|
Labour | John Cotton | 1,791 | |||
UKIP | Iain Roden | 1,754 | |||
Conservative | Roger King | 446 | |||
Green | Stephen Parker | 301 | |||
BNP | Kevin McHugh | 134 | |||
Liberal Democrats | Christopher Barber | 132 | |||
TUSC | Ken Marks | 48 | |||
Majority | 37 | ||||
Turnout |
Party | Candidate | Votes | % | ±% | |
---|---|---|---|---|---|
Liberal Democrats | Mike Ward | 2,750 | 52.1 | ||
UKIP | David Bridges | 1,262 | 23.9 | ||
Labour | Bob Collins | 850 | 16.1 | ||
Conservative | Keely Huxtable | 338 | 6.4 | ||
TUSC | Mark Andrews | 80 | 1.5 | ||
Majority | 1,488 | ||||
Turnout |
Party | Candidate | Votes | % | ±% | |
---|---|---|---|---|---|
Labour Co-op | Sharon Thompson | 4,026 | |||
Conservative | Robert Higginson | 557 | |||
Liberal Democrats | Cabdul Ruumi | 353 | |||
Green | Margaret Okole | 310 | |||
Majority | 3,469 | ||||
Turnout |
Party | Candidate | Votes | % | ±% | |
---|---|---|---|---|---|
Liberal Democrats | Zaker Choudhry | 2,614 | |||
Labour Co-op | Kate Booth | 2,448 | |||
UKIP | Albert Duffen | 1,060 | |||
Conservative | Julia Mackey | 279 | |||
Independent | Dave Willis | 86 | |||
TUSC | Siobhan Friel | 38 | |||
Majority | 3,469 | ||||
Turnout |
Party | Candidate | Votes | % | ±% | |
---|---|---|---|---|---|
Labour | Victoria Quinn | 5,382 | |||
Liberal Democrats | Asad Mehmood | 750 | |||
Conservative | John Turner | 341 | |||
Majority | 4,632 | ||||
Turnout |
Party | Candidate | Votes | % | ±% | |
---|---|---|---|---|---|
Labour | Mohammed Fazal | 3,845 | |||
Liberal Democrats | Tanveer Choudhry | 2,641 | |||
UKIP | Martin Barrett | 395 | |||
Conservative | David Agar | 384 | |||
Majority | 1,204 | ||||
Turnout |
Party | Candidate | Votes | % | ±% | |
---|---|---|---|---|---|
Liberal Democrats | Carol Jones | 2,685 | |||
Labour | Diane Donaldson | 1,523 | |||
UKIP | Graham Duffen | 1,128 | |||
Conservative | Robert Clark | 271 | |||
Green | Grant Bishop | 164 | |||
Majority | 1,162 | ||||
Turnout |
Party | Candidate | Votes | % | ±% | |
---|---|---|---|---|---|
Labour | Penny Holbrook | 3,451 | |||
Conservative | Daniel Caldicott | 494 | |||
TUSC | Ted Woodley | 347 | |||
Liberal Democrats | Franklyn Aaron | 294 | |||
Majority | 2,957 | ||||
Turnout |
Party | Candidate | Votes | % | ±% | |
---|---|---|---|---|---|
Conservative | Anne Underwood | 3,628 | |||
UKIP | Brendan Padmore | 1,370 | |||
Labour | Nick Preston | 884 | |||
Green | David Ratcliff | 343 | |||
Liberal Democrats | Hubert Duffy | 302 | |||
Majority | 2,258 | ||||
Turnout |
Party | Candidate | Votes | % | ±% | |
---|---|---|---|---|---|
Conservative | Ken Wood | 2,659 | |||
UKIP | Stewart Cotterill | 1,429 | |||
Labour | Ian Brindley | 1,129 | |||
Liberal Democrats | Trevor Holtom | 296 | |||
Majority | 1,230 | ||||
Turnout |
Party | Candidate | Votes | % | ±% | |
---|---|---|---|---|---|
Conservative | Ewan Mackey | 2,985 | |||
Conservative | Margaret Waddington | 2,916 | |||
UKIP | Marcus Brown | 1,617 | |||
Labour | Roger Barley | 1,514 | |||
Labour | Philip Innamorati | 1,154 | |||
Liberal Democrats | Sally Lippiatt | 571 | |||
Majority | |||||
Turnout |
Party | Candidate | Votes | % | ±% | |
---|---|---|---|---|---|
Conservative | Andrew Hardie | 2,564 | |||
Labour | Manish Puri | 2,314 | |||
UKIP | Albert Meehan | 1,229 | |||
Liberal Democrats | Lynn Williams | 332 | |||
Majority | 250 | ||||
Turnout |
Party | Candidate | Votes | % | ±% | |
---|---|---|---|---|---|
Labour | Lynda Clinton | 2,171 | |||
Conservative | Clifton Welch | 864 | |||
Liberal Democrats | Ann Holtom | 647 | |||
TUSC | James Redfern | 379 | |||
Majority | 1,307 | ||||
Turnout |
Party | Candidate | Votes | % | ±% | |
---|---|---|---|---|---|
Labour | Mohammed Idrees | 6,598 | |||
Liberal Democrats | Waheed Rafiq | 537 | |||
Conservative | Alexander Hall | 352 | |||
Green | John Bentley | 374 | |||
Majority | 6,061 | ||||
Turnout |
Party | Candidate | Votes | % | ±% | |
---|---|---|---|---|---|
Conservative | Peter Douglas | 2,287 | |||
Labour | Stephen Booton | 1,780 | |||
UKIP | Kevin Morris | 1,205 | |||
Green | Anna Masters | 305 | |||
Liberal Democrats | Sally Haynes-Preece | 223 | |||
Majority | 507 | ||||
Turnout |
Birmingham City Council is the local government body responsible for the governance of the City of Birmingham in England, which has been a metropolitan district since 1974. It is the most populated local council area in the United Kingdom with 101 elected councillors representing over one million people, in 69 wards. The council headquarters are at the Council House in the city centre. The council is responsible for running nearly all local services, with the exception of those run by joint boards. The provision of certain services has in recent years been devolved to several council constituencies, which each have a constituency committee made up of councillors from that district. It is part of the West Midlands Combined Authority. On September 6 2023, the council declared effective bankruptcy, and central government commissioners were later appointed to run the council under emergency measures.
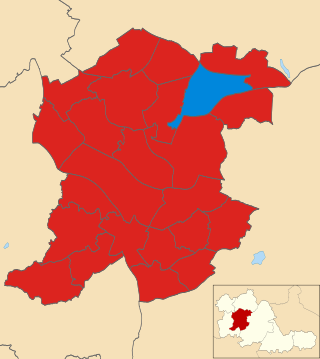
Birmingham Hodge Hill is a constituency of part of the city of Birmingham represented in the House of Commons since 2004 by Liam Byrne, a member of the Labour Party.
Birmingham Selly Oak is a constituency in the West Midlands, represented in the House of Commons of the UK Parliament since 2010 by Steve McCabe of the Labour Party.
Birmingham Erdington is a parliamentary constituency in Birmingham, England, represented in the House of Commons of the Parliament of the United Kingdom since 2022 by Paulette Hamilton of the Labour Party.
Birmingham Hall Green is a parliamentary constituency in the city of Birmingham, which has been represented in the House of Commons of the UK Parliament since 2019 by Tahir Ali of the Labour Party.
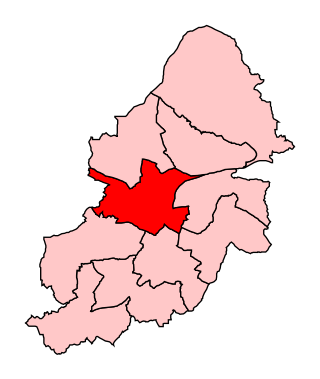
Birmingham Ladywood is a constituency of part of the city of Birmingham, represented in the House of Commons since 2010 by Shabana Mahmood of the Labour Party.
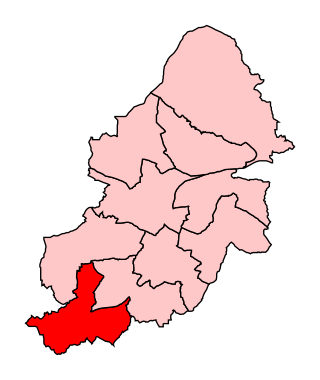
Birmingham Northfield is a constituency represented in the House of Commons of the UK Parliament since 2019 by Gary Sambrook, a Conservative. It represents the southernmost part of the city of Birmingham.
Birmingham Perry Barr is a constituency in the West Midlands, represented in the House of Commons of the UK Parliament since 2001 by Khalid Mahmood of the Labour Party.
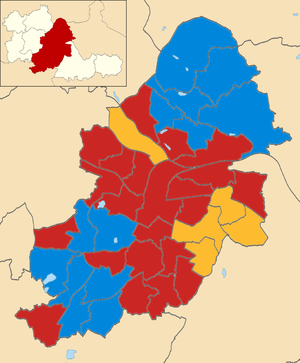
Birmingham City Council elections are held every four years. Birmingham City Council is the local authority for the metropolitan district of Birmingham in the West Midlands, England. Since the last boundary changes in 2018, 101 councillors have been elected from 69 wards. Prior to 2018 elections were held three years out of every four, with a third of the council elected each time.
Kirklees Council is the local authority for the metropolitan borough of Kirklees in West Yorkshire, England. Since the last boundary changes in 2004, the council has comprised 69 councillors representing 23 wards. Elections are held three years out of four, with one third of the councillors elected each time for a four-year term.
Sefton Metropolitan Borough Council elections are generally held three years out of every four, with a third of the council being elected each time. Sefton Metropolitan Borough Council, generally known as Sefton Council, is the local authority for the metropolitan borough of Sefton in Merseyside, England. Since the last boundary changes in 2004, 66 councillors have been elected from 22 wards.
Elections to Birmingham City Council in England were held on 1 May 2008. One third of the council was up for election and the council stayed under no overall control as it had been since 2003.
The 1998 Wyre Forest District Council election took place on 7 May 1998 to elect members of Wyre Forest District Council in Worcestershire, England. One-third of the council was up for election and the Labour Party stayed in overall control of the council.
The 2010 Birmingham City Council Election took place on 6 May 2010 to elect members of Birmingham City Council in the West Midlands, England. One third of the council was up for election, one seat in each of the city's 40 council wards, with the election taking place at the same time as the general election.
The 2011 Sandwell Metropolitan Borough Council election took place on 5 May 2011 to elect members of Sandwell Metropolitan Borough Council in the West Midlands, England. One third of the council was up for election and the Labour Party stayed in overall control of the council.
The 2011 Walsall Metropolitan Borough Council election took place on 5 May 2011 to elect members of Walsall Metropolitan Borough Council in the West Midlands, England. One third of the council was up for election and the Conservative Party lost overall control of the council to no overall control.
Elections to Birmingham City Council in England were held on 3 May 2012 on the same day as other 2012 United Kingdom local elections. One third of the council was up for election and the Labour Party gained overall control of the council from No Overall Control.
The 2015 Birmingham City Council election took place on 7 May 2015 to elect members of Birmingham City Council in England. This was on the same day as other local elections, and also the 2015 UK General Election.
The 2016 Birmingham City Council election took place on 5 May 2016 to elect one third of the members of Birmingham City Council in England. The election was held on the same day as the election of a Police and Crime Commissioner for the West Midlands as part of the 2016 Police and Crime Commissioner elections.
Elections to Birmingham City Council in England were held in May 2007. One third of the council was up for election and the council stayed under no overall control as it had been since 2003.